- heppel's home page
- Posts
- 2021
- July (3)
- 2020
- February (1)
- 2019
- 2018
- 2017
- 2016
- December (2)
- November (2)
- October (3)
- September (2)
- August (1)
- July (3)
- June (5)
- May (8)
- April (4)
- March (1)
- February (2)
- January (2)
- 2015
- December (1)
- November (4)
- October (8)
- September (4)
- August (3)
- July (2)
- June (7)
- May (8)
- April (5)
- March (13)
- February (5)
- January (2)
- 2014
- 2009
- June (3)
- My blog
- Post new blog entry
- All blogs
IterationAnalysis6
The we discussed one more voltage iteration. The proposed correction file is FpdCorr.txt . The corrections are to voltage settings that were present on for data collected on Day70 (16070009 and 16070010).
These corrections are shown in detail in pdf files for small cell corrections and large cell corrections.
The HTML file for this callibration analysis is also posted.
The pdf files attached may help us decide if these are changes that we really want to make at this time.
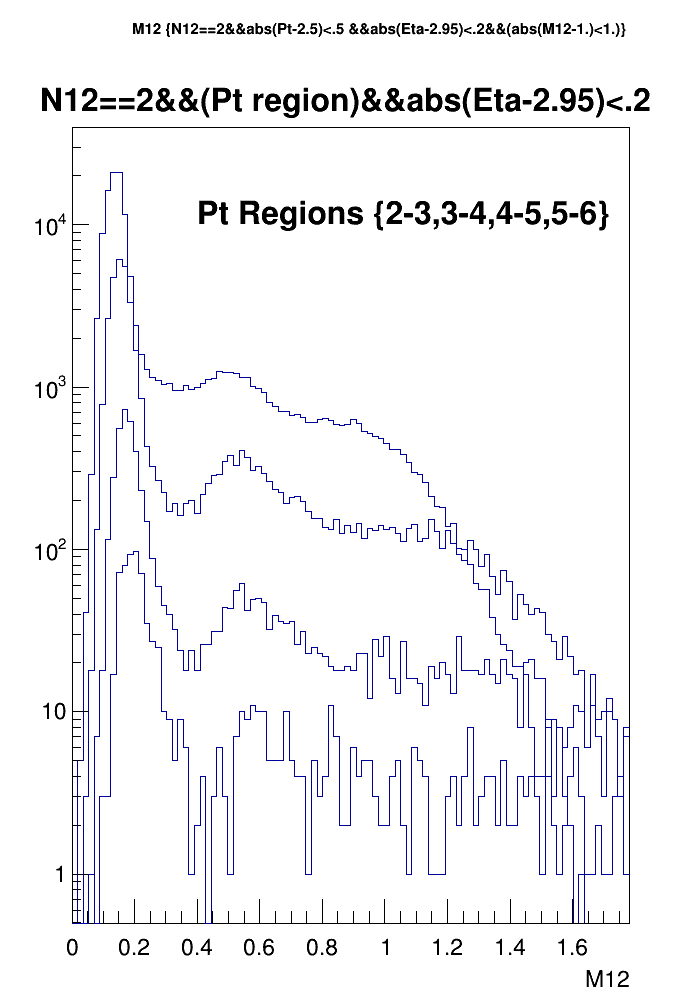
Just for a feel good plot, I plotted masses with the corrections used for this iteration.
This is the data from the same 2 runs (~9 million star triggers) with our best corrections in the rapidity region of the large cells.
It is a feel good plot that shows the mass distributions in each of 4 Pt regions of width 1 GeV/c in the given pseudo-rapidity ranges.

- heppel's blog
- Login or register to post comments
