- jeromel's home page
- Posts
- 2025
- 2020
- 2019
- 2018
- 2017
- 2016
- 2015
- December (1)
- November (1)
- October (2)
- September (1)
- July (2)
- June (1)
- March (3)
- February (1)
- January (1)
- 2014
- 2013
- 2012
- 2011
- 2010
- December (2)
- November (1)
- October (4)
- August (3)
- July (3)
- June (2)
- May (1)
- April (4)
- March (1)
- February (1)
- January (2)
- 2009
- December (3)
- October (1)
- September (1)
- July (1)
- June (1)
- April (1)
- March (4)
- February (6)
- January (1)
- 2008
- My blog
- Post new blog entry
- All blogs
Year 10, W52 production status
- Run 10, W50 production status
- Current status
- Follow-ups
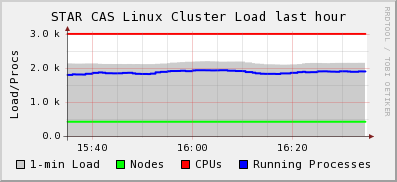
Farm Load CRS
Avg Load (15, 5, 1m): 93%, 92%, 92% with the following distribution
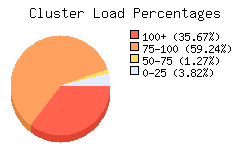 - 94.91% of the cluster is well utilized consistent with expectations.
The load profile shows as follow
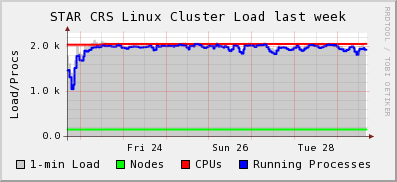
All is well load-wise for the production.
There has been report of slow IO on disk, analysis not going well (a 50% slow down is seen due to slow access to central storage). This is seen from the CAS load as well in this load profile and pattern where max load 2k versus 3k would be consistent with a 50% slow down.
Job efficiency
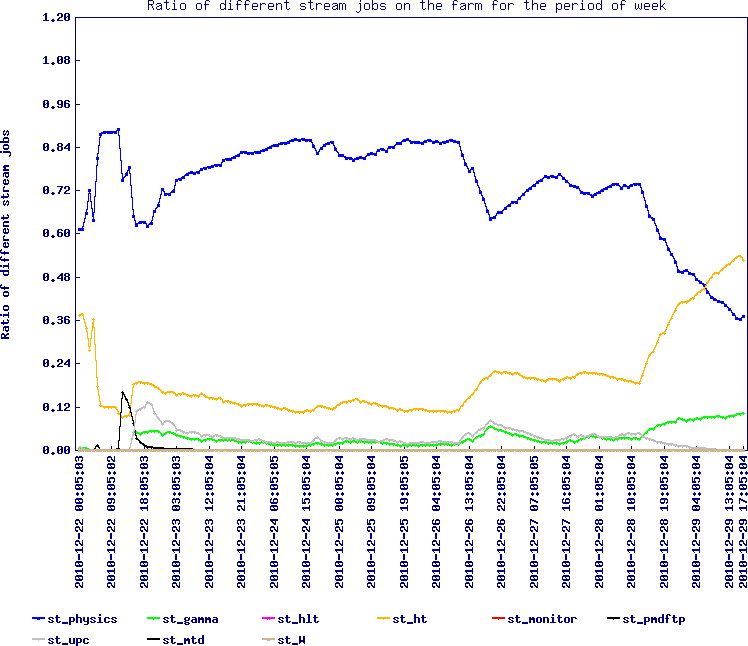
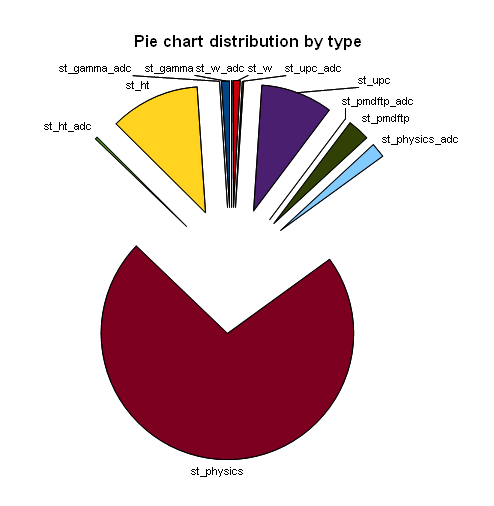
The first plot is the stream ratio for the past week, that is, the proportion of each stream in production.
Apart from the past few days, the mix was very eaven.
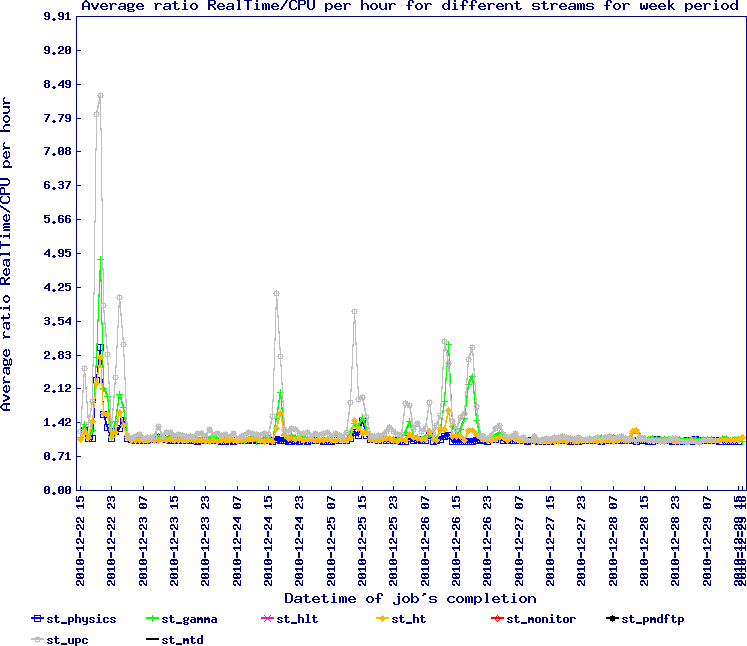
The second plot is the RealTime/CPUTime ratio - a value of 1 is best and anything diverging from it indicate inefficiencies.
Production status and problems
Production overview
Totals so far:
- Number of events in MuDST: 183,372,603 (25% more events than two weeks ago)
- Total size MuDST: 94.7 TB
- Total number of MuDST: 107,223
- Average file size: 0.90 GB
Breakdown of number of events by triggers
Cumulative progress
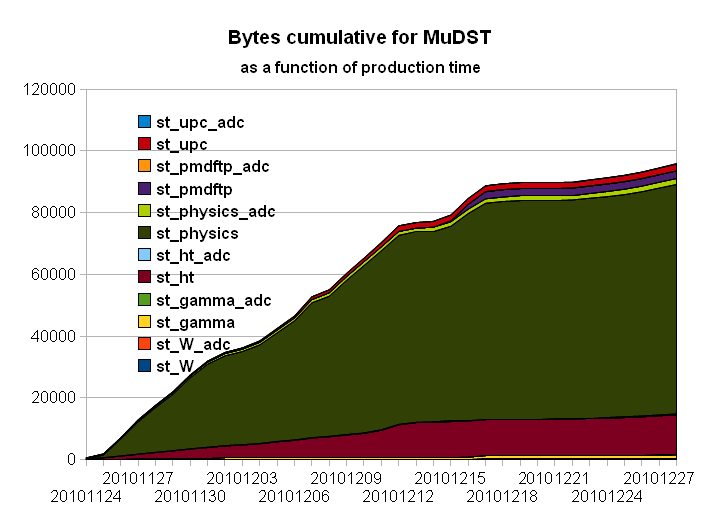
As seen above, a net change occurred two weeks ago, causing a camel shape in progress. We can understand the first slow down as a temporary loss of CPU due to the farm repair (see this announcement). But the slow down persisted requiring a different explanation.
Summary / incremental status
From the slopes, we can infer a slow down by a factor of at a factor of 2-3. The CPUtimes have also been reported as being twice slower. This can be seen looking at the average processing numbers below
          AuAu200_production (adc)  [ht] 2.45189 total MB/evt 0.66783 MB/evt Real=50.74 sec/evt CPU=42.65 sec/evt IO=0.05 (0.06) MB/sec
              AuAu200_production [gamma] 2.51921 total MB/evt 0.66450 MB/evt Real=53.64 sec/evt CPU=46.45 sec/evt IO=0.05 (0.05) MB/sec
                AuAu200_production [upc] 0.44832 total MB/evt 0.10611 MB/evt Real=15.64 sec/evt CPU=9.49 sec/evt IO=0.03 (0.05) MB/sec
       AuAu200_production (adc)  [gamma] 2.58274 total MB/evt 0.66855 MB/evt Real=65.64 sec/evt CPU=45.62 sec/evt IO=0.04 (0.06) MB/sec
         AuAu200_production (adc)  [upc] 0.48205 total MB/evt 0.11321 MB/evt Real=18.44 sec/evt CPU=8.33 sec/evt IO=0.03 (0.06) MB/sec
                 AuAu200_production [ht] 2.37594 total MB/evt 0.64161 MB/evt Real=53.38 sec/evt CPU=46.69 sec/evt IO=0.04 (0.05) MB/sec
               AuAu200_production (adc)  2.07553 total MB/evt 0.55890 MB/evt Real=44.09 sec/evt CPU=38.88 sec/evt IO=0.05 (0.05) MB/sec
                      AuAu200_production 2.01229 total MB/evt 0.53893 MB/evt Real=39.70 sec/evt CPU=38.46 sec/evt IO=0.05 (0.05) MB/sec
Comparing to the projections from two weeks ago, the numbers are much larger (39 sec versus 26.3 before for example for st_physics). Imagining we would restore the initial performance rate, the revised projections would be as follow:
| Goals | Done | Left | %left | Real (sec/evt) | CPU (sec/evt) | Real/CPU | Time left (days) | |
| st_gamma [+] | 3,000,000 | 1,951,097 | 1,048,903 | 34.96% | 38.80 | 29.79 | 1.3 | 0.19 |
| st_ht (all) | 58,752,491 | 21,588,450 | 37,164,041 | 63.26% | 35.69 | 28.34 | 1.26 | 6.34 |
| st_physics | 207,000,000 | 135,762,154 | 71,237,846 | 34.41% | 26.56 | 25.95 | 1.02 | 9.04 |
| st_pmdftp [+] | 5,000,000 | 5,307,771 | -307,771 | -6.16% | 19.05 | 17.68 | 1.08 | -0.03 |
| st_upc | 37,520,000 | 17,203,157 | 20,316,843 | 54.15% | 11.57 | 6.00 | 1.93 | 1.12 |
| Grand totals & avg | 311,272,491 | 181,812,629 | 129,767,633 | 41.69% | 26.33 | 21.55 | 1.22 | 16.69 |
... hence still 17 days to go: in two weeks, we only did 4 days worth of what we would do before. However, we had a 3 days farm downtime (hence 4+3=7 days while we projected Run 10, W50 production status 21 days left). Remains to explain the offset by 21-7*2=7 days worth of data.
This can be understood by looking at the problem initially reported as ticket RT # 2058. A code change is causing some job to get "stuck". We have 8k jobs automatically killed by the production system in this category (the system detects non active jobs and kick them out of the queue). It is believed to be due to a change in the maximum number of allowed vertices (from 20 to now 500). This is under testing and the result should be available by the 30th.
Since we projected earlier on an ETA of mid-January to beginning of February, we are still on target (those projections are snapshots allowing to recover fast - 17 days remaining is on the optimistic side, assuming not problem but duty factors).
We note that we will be done with the st_physics stream soon and this may create another efficiency condition whereas the "stream effect" will become a predominant factor to potential production slow down. We however have several options at this stage:
- Our new database server are operational - database snapshots may be used if necessary
- We may mix some of the st_physics from the rest of production for greater efficiency and farm use
We do not know of other problems at this stage.
Follow-up
While backing off the vertex change may have an effect on the CPU time, the number of jobs being "stuck" did not change. On 2010/12/30 I instructed Lidia to rebuild the library with specific codes as below:
	OK, leave the job on rcrs6101 running (don't kill it) and
rebuild the library with
* a base code from SL10j
* add the following
asps
Simulation/starsim/atmain/agdummy.age - subroutine gcalor micset added;
Simulation/starsim/atgeant/agrot.F - modified to switch off AGROTF_TEST;

StChain
StMaker.cxx - added y2008c, y2009b, y2010b geometry tags;

StEmcADCtoEMaker
StBemcData.cxx, StEmcADCtoEMaker.cxx - patched for BSMDe mapping problem
in P10ih and P10ij productions;
StEmcRawMaker
StBemcRaw.cxx, StBemcRaw.h, StEmcRawMaker.cxx - patched for BSMDe
mapping problem in P10ih and P10ij productions;
StEmcUtil
database/StEmcDecoder.cxx, StEmcDecoder.h - patched for BSMDE mapping
problem in P10ih and P10ij productions;
StEmcSimulatorMaker
StEmcSimulatorMaker.cxx - modified to make the energy assignments of the
newly created strips happen before they are added to the mEmcMcHits
collection; the cross talk leakage is now proportional to the difference
of energies of two neighbor strips;


StGammaMaker
StGammaPythiaEventMaker.cxx - modified to move the StMcEvent check to
the beginning of Make() to avoid crashing when the instance is not present ;
StGammaRawMaker.h - added mutator to exclude BEMC towers; set excluded
BEMC towers in StGammaRawMaker;
StGammaRawMaker.cxx - excluded desired BEMC towers; bug fixed in tower
exclusion code;


pams
/geometry/geometry/geometry.g - defined TPCE04r (reduced TPC envelope
radius) and BTOF67 (btof sensitive volume size fix) and incorporated
them into Y2011 tag; added tags:Y2008c, Y2009c, y2010b;
/geometry/geometry/btofgeo/gbtofgeo7.g - reverted to previous version of
btofgeo6 code; fixes in TOF geometry are applied now in btofgeo7 ;
/geometry/geometry/tpcegeo/tpcegeo3.g - reverted max radius to previous
value; reduced radius is set by TPCE04r flag in geometry.g;


StarDb
VmcGeometry/y2011.h - modified MUTD geometry: 27 backlegs changed with
28 backlegs ;
Geometry.y2008c.C, Geometry.y2009c.C, Geometry.y2010b.C,
Geometry.y2008b.C, Geometry.y2009b.C, Geometry.y2010a.C, y2008c.h,
y2009c.h, y2010b.h - added new files for tags y2008b, y2008c, y2009b,
y2009c, y2010a and y2010b;

	Let us see if this fixes the issue.
	Thank you,
This set of updates works as illustrated by the below graph. The rise in the speed progress is back to previous levels.
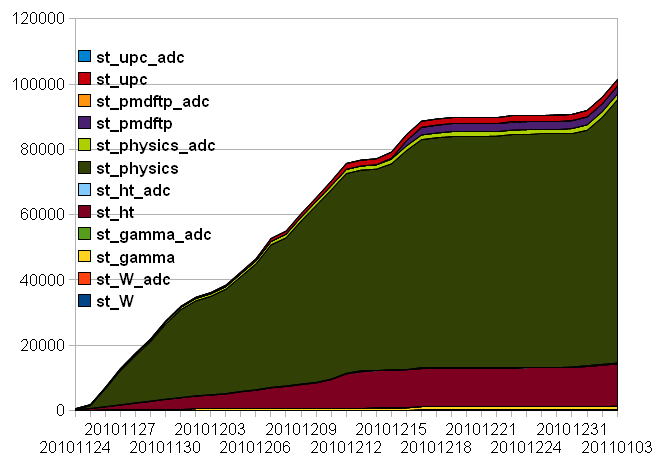
Remains to indentify the problem (this could be done in "dev").

