- jeromel's home page
- Posts
- 2025
- 2020
- 2019
- 2018
- 2017
- 2016
- 2015
- December (1)
- November (1)
- October (2)
- September (1)
- July (2)
- June (1)
- March (3)
- February (1)
- January (1)
- 2014
- 2013
- 2012
- 2011
- 2010
- December (2)
- November (1)
- October (4)
- August (3)
- July (3)
- June (2)
- May (1)
- April (4)
- March (1)
- February (1)
- January (2)
- 2009
- December (3)
- October (1)
- September (1)
- July (1)
- June (1)
- April (1)
- March (4)
- February (6)
- January (1)
- 2008
- My blog
- Post new blog entry
- All blogs
Run 10, W50 production status
- Lidia's page production-status-update-run-2010 contains a grand summary
- Overview of the registered files in the FileCatalog
- Overview of the farm status and performance
STAR FileCatalog statistics
Totals for AuAu200_production
- Number of events in MuDST: 145,880,568
- Total size MuDST: 76.2 TB
- Total number of MuDST: 68,624
- Average file size: 1.14 GB
By trigger
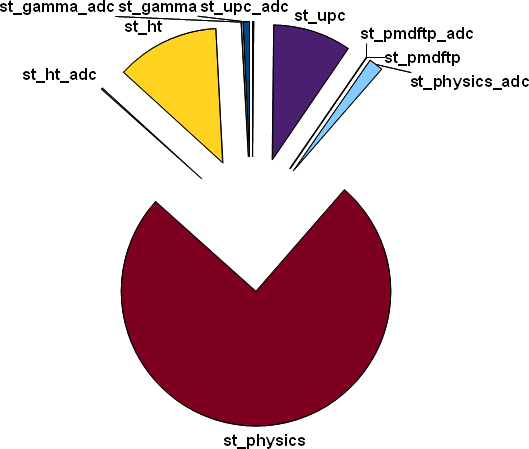
  1,216,537::st_gamma
     22,169::st_gamma_adc
 18,052,594::st_ht
    247,234::st_ht_adc
109,718,488::st_physics
  2,522,600::st_physics_adc
    138,991::st_pmdftp
     23,430::st_pmdftp_adc
 13,668,295::st_upc
    270,230::st_upc_adc
Overall proportion of streams / kind (by events rather than jobs - job analysis will be next):
Current speed of production is as follows:
       AuAu200_production [gamma] 2.45504 MB total/evt 0.64828 MB MB/evt Real=38.80 sec/evt CPU=29.79 sec/evt IO=0.06 (0.08) MB/sec
   AuAu200_production (adc)  [ht] 2.42422 MB total/evt 0.65074 MB MB/evt Real=36.38 sec/evt CPU=29.07 sec/evt IO=0.07 (0.08) MB/sec
         AuAu200_production [upc] 0.50698 MB total/evt 0.12671 MB MB/evt Real=11.57 sec/evt CPU=6.00 sec/evt  IO=0.04 (0.08) MB/sec AuAu200_production (adc)  [gamma] 2.49644 MB total/evt 0.64753 MB MB/evt Real=58.49 sec/evt CPU=31.29 sec/evt IO=0.04 (0.08) MB/sec
  AuAu200_production (adc)  [upc] 0.51360 MB total/evt 0.12758 MB MB/evt Real=16.40 sec/evt CPU=6.45 sec/evt  IO=0.03 (0.08) MB/sec
          AuAu200_production [ht] 2.39427 MB total/evt 0.63913 MB MB/evt Real=35.69 sec/evt CPU=28.34 sec/evt IO=0.07 (0.08) MB/sec
        AuAu200_production (adc)  2.14627 MB total/evt 0.57620 MB MB/evt Real=29.92 sec/evt CPU=25.69 sec/evt IO=0.07 (0.08) MB/sec
               AuAu200_production 2.15684 MB total/evt 0.57377 MB MB/evt Real=26.56 sec/evt CPU=25.95 sec/evt IO=0.08 (0.08) MB/sec
Graphical view of file growth (MuDST only) for storage projection:
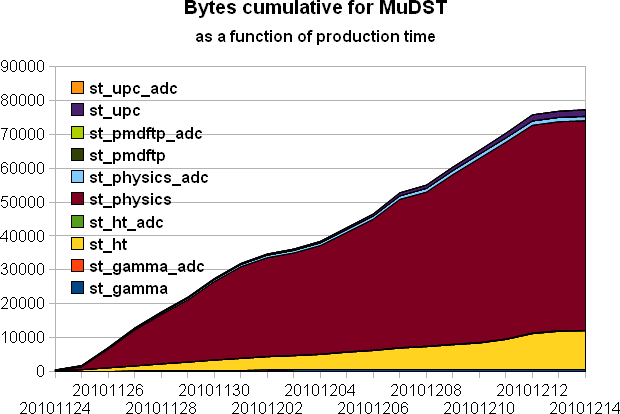
Based on the speed above and assuming 3000 slots with a duty factor of ~ 85%, we estimate a need to free up to 40 TB of disk space every 10 days to keep production going and get the below projections:
| Duty factor | 85.00% | |||||||
| Maximum occupancy | 95.00% | |||||||
| Maximum slots | 3000 | |||||||
| QM 2011 Goals | Done | Left | %left | Real (sec/evt) | CPU (sec/evt) | Real/CPU | Time left (days) | |
| st_gamma [+] | 3,000,000 | 1,238,706 | 1,761,294 | 58.71% | 38.80 | 29.79 | 1.3 | 0.33 |
| st_ht (all) | 58,752,491 | 18,299,828 | 40,452,663 | 68.85% | 35.69 | 28.34 | 1.26 | 6.90 |
| st_physics | 207,000,000 | 112,241,088 | 94,758,912 | 45.78% | 26.56 | 25.95 | 1.02 | 12.02 |
| st_pmdftp [+] | 5,000,000 | 162,421 | 4,837,579 | 96.75% | 19.05 | 17.68 | 1.08 | 0.44 |
| st_upc | 37,520,000 | 13,938,525 | 23,581,475 | 62.85% | 11.57 | 6.00 | 1.93 | 1.30 |
| Grand totals & avg | 311,272,491 | 145,880,568 | 165,391,923 | 53.13% | 26.33 | 21.55 | 1.22 | 20.99 |
Farm status and performance
Farm occupancy
Below if the farm occupancy for the past week
Avg Load (15, 5, 1m): 95%, 96%, 96%
Pie chart distribution is 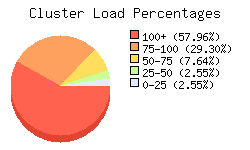
and the load profile as a function of day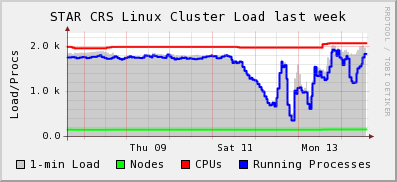 .
.
Note the deep around sunday we explain below. Up and downs of the red curve reference is due to temporary loss of CPUs (at this stage, minimal and of the order of 5% over a period of a week).
Job performance
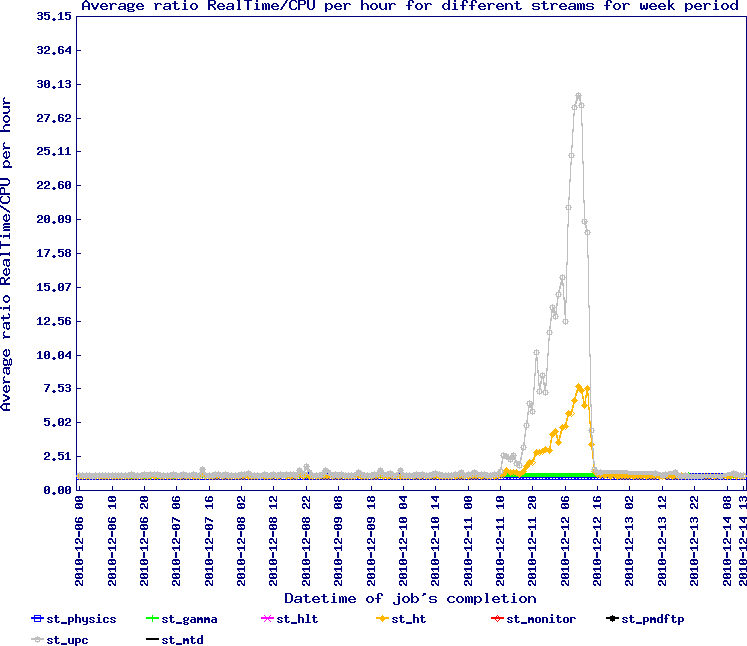
Below is the ration of RealTime/CPUtime for the past week as taken on 2010/12/14
To understand the spike at 30.13 during an increase period of 24 hours (average ratio ~ 10), the proportion of stream is ploted below
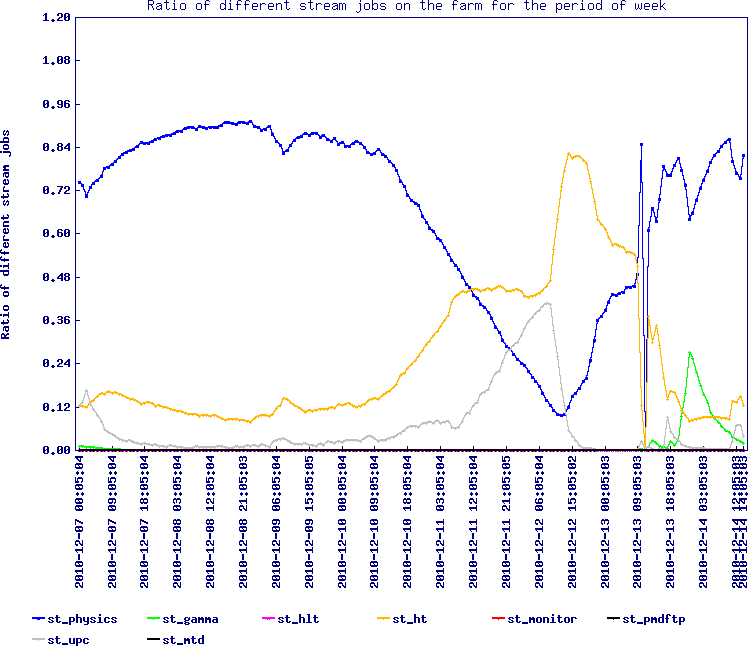
During the same period, the amount of streams reached at least 1/2 of the production contribution and was dominated by st_upc creating the known Effect of stream data on database performance, a 2010 study. The load came back to a near normal as soon as the st_upc processing %tage contribution dropped below 5% (st_ht then increased but did not cause such an effect if we beleive the timeline).
- jeromel's blog
- Login or register to post comments

