Abstract: The EEMC is similar in construction to the CDF endplug calorimeters. CDF performed
extensive testbeam measurements, demonstrating a linear (~1%) response for electrons between 10 and ~400 GeV, but only after making a correction for the preshower response. In this study, we examine a slightly modified EEMC geometry in order to compare linearity achieved with the GEANT model of the EEMC with the CDF test setup.
1.0 Modified EEMC Geometry
The CDF endplugs are similar in construction to the STAR EEMC, with three notable exceptions: (1) the EEMC preshower system is integrated into the calorimeter stack while the CDF endplug preshower system is readout independently, (2) the EEMC has three special layers containing 5mm of plastic scintillator, while the CDF endplug's plastic is 4mm in all layers, and (3) the EEMC consists of 23 Pb/Pl layers (plus Al/preshower-1), while the CDF endplug consists of 22. The light from the EEMC pre- and postshower layers are divided between two fibers, and the plastic is brighter stuff: BC-400 vs. Kurarary SCSN-something-or-other. The net result is that the 5mm of "special" plastic response more like 4mm of the regular stuff. In this modified geometry, I reduce the special layers to 4mm of plastic.
 |
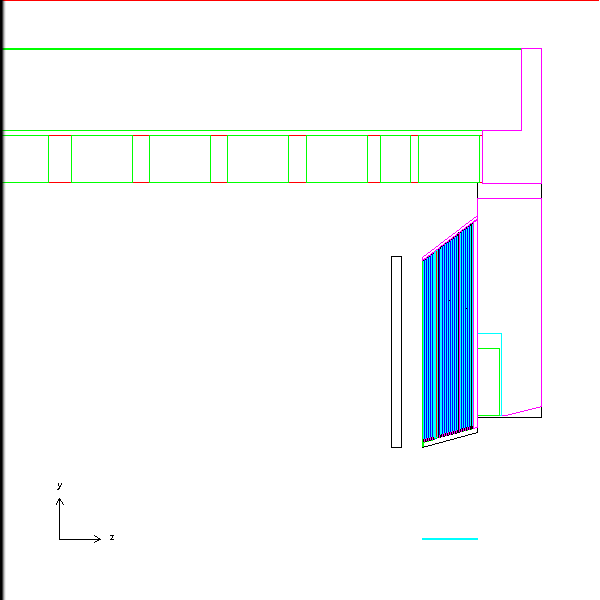
EEMC CDF testbeam mockup:
- Pre- and postshower layers in the EEMC are reduced to 4mm of plastic scintillator
- The EEMC is loaded into the geometry, as well as the magnet structure. The latter is added to provide material behind the endcap, mocking up the presence of the CDF hadron calorimeter.
- A 3.81 cm Al plate is placed "in front of" the EEMC. Position was not specified in the CDF writeup. Chose 250 cm for this study. Will repeat with it closer to the front face of the EEMC as a consistency check.
- The CDF testbeam experiment looked at the linearity of a reference tower sitting ~26 degrees above the beamline. Electrons impinged at the center of the tower. For the EEMC, the closest tower to this angle of incidence will be etabin = 7, at about eta=1.44.
- Single electrons are thrown at an azimuthal angle of 90 degrees, at energies of 0.7, 1, 2, 3, 4, 5, 6, 7, 8, 9, 10, 15, 20, 30, 50, 100, 200 and 250 GeV.
- Energy deposits are summed over all active layers in the EEMC. This differs from the CDF testbeam where they define a 3x3 patch of towers centered on the reference tower.
|
2.0 Sampling Fraction vs. Energy for the CDF Mockup
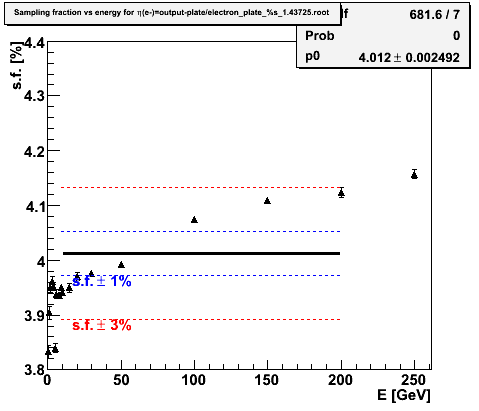
The figure below shows the sampling fraction (defined as energy deposited in the full calorimeter stack divided by the incident energy of the electron) versus the incident energy of the electron. In the CDF testbeam writeup, figure 13 shows the non-linearity (normalized at ~120 GeV) vs. incident energy. For comparison with the figure below, one should look at the open squares in CDF figure 13. Those points show the response of the calorimeter stack without any correction from their preshower. Taking the dfference between their ~180 GeV point and the 10 GeV point, their uncorrected linearity is good to about 3%. Figure 2.1 below shows a comparable linearity. Between 10 GeV and 200 GeV I estimate that the sampling fraction changes by about 4.5%. This is comparable with what CDF's testbeam demonstrated. The difference is probably due to the 3x3 clustering done in the CDF measurement, vs summing the whole endcap in this study.


