- jwebb's home page
- Posts
- 2019
- 2018
- 2017
- 2016
- 2015
- 2014
- 2013
- November (1)
- October (1)
- September (1)
- July (1)
- June (1)
- April (1)
- March (3)
- February (1)
- January (1)
- 2012
- 2011
- December (2)
- September (3)
- August (5)
- July (6)
- June (6)
- May (1)
- April (5)
- March (5)
- February (2)
- January (2)
- 2010
- December (3)
- October (3)
- September (2)
- August (2)
- June (2)
- May (4)
- April (4)
- March (2)
- February (4)
- January (10)
- 2009
- 2008
- 2007
- 2006
- July (1)
- My blog
- Post new blog entry
- All blogs
Comparison of muon energy deposit in 1st layers of EEMC and BEMC in gstar, take 2
Abstract: Muons are thrown with energies of 1, 3, 10, 30 and 100 GeV at eta = 0.025 and eta = 1.85. The energy-loss distributions for muons in preshower-1 and the first lead radiator in the EEMC are compared energy-loss distributions in the barrel (1st lead and 2nd scintillator layers). We also make comparisons between the mean of the distributions and the expected values based on data tables in the particle data book. The observed means are within 5-10% of the expected values.
In order to investigate the observed nonlinearities in the EEMC sampling fraction, we check the energy-loss by muons traversing the first lead and plastic scintillator layers of the endcap and barrel calorimeters. Single-muons are generated in starsim at energies of 1, 3, 10, 30 and 100 GeV. The muons are thrown at pseudorapidities of 1.85 (EEMC) and 0.025 (BEMC), corresponding to incident angles of cos(qinc) = 0.95 and cos(qinc) ~= 1.0 respectively. At these angles of incidence, the muons penetrate approximately the same amount of lead in both calorimeters. This allows us to cross check that 1) GEANT is performing energy loss consistently in both detector volumes, and 2) by comparing with values determined by data tables in the particle data book we can validate the simulation.
1.0 Method
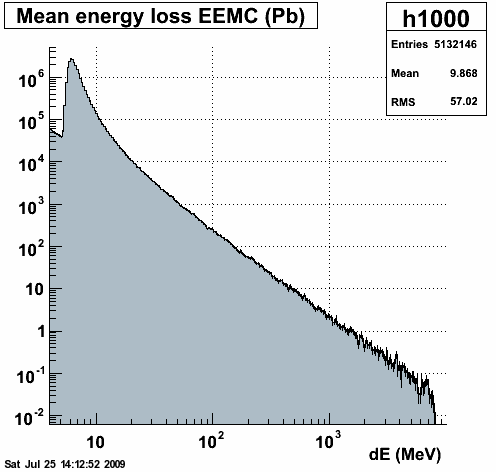
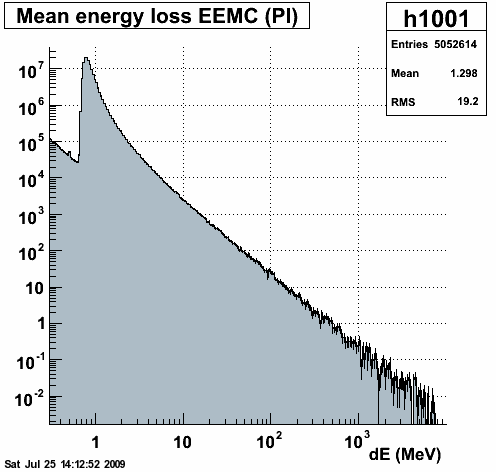
At the end of each tracking step in starsim, the user routine AgUSTEP is called. In this routine we access the geant common blocks to determine which tracking volume we are in and the energy loss applied to the muon in the recently completed tracking step. The energy-loss of single muons as they exit the 1st (1st) lead radiator and the 1st (2nd) plastic scintillator in the EEMC (BEMC) are filled in a histogram. Figure 1.1 below shows the energy-loss distribution of 30 GeV muons incident on 4.57 mm of lead and 5 mm of polystyrene at eta = 1.85 in the EEMC. The histograms are booked with logarithmically-spaced bins. To obtain the distribution of energy loss, we divide the contents in each bin by the bin width. Thus (if we divided the histograms by the number of entries) we have the probability distribution function.
It is interesting to note that the energy-loss distribution terminates around 18-19% of the incident energy. There is a cut in the geometry where only a fixed percentage of the energy of a particle may be lost in any given layer. If this is only the configuration for muons, it is probably not significant. However, it may be a mistake to apply such a restriction to electrons, positrons and gammas.
Figure 1.1 -- Energy-loss distributions for 30 GeV muons in the 1st EEMC lead radiator (left) and the 1st EEMC plastic scintillator (right).
2.0 Expectations based on the PDB
Next we calculate the expected mean energy loss for muons as a function of incident energy. The geant model of both EEMC and BEMC utilizes pure lead for the radiators and CH for the plastic scintillator. We first determine the mean dE/dx for the lead and CH by reading off appropriate values from the particle data book for lead, and calculating it for CH based on the C and H2 values.
Figure 2.1 -- Mean energy loss for ionizing radiation in various materials [1]. The blue line corresponds to a 100 GeV muon. The table below shows the values I read off at each incident muon energy.
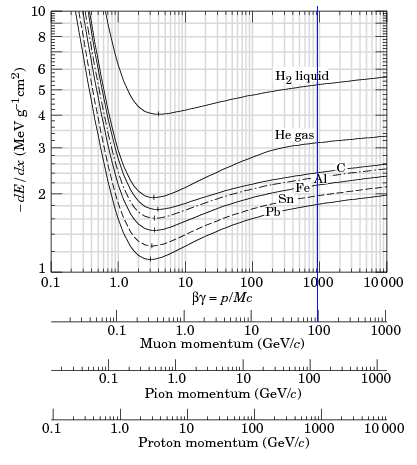
Table 2.1 -- Mean dE/dx for each thrown energy.
| E muon | p muon | -<dE/dx> Pb | -<dE/dx> C | -<dE/dx> H2 | -<dE/dx> CH | -<dE/dx> CH2 |
| [GeV] | [GeV] | [MeV g-1 cm2] | [MeV g-1 cm2] | [MeV g-1 cm2] | [MeV g-1 cm2] | [MeV g-1 cm2] |
| 1.00 | 0.99 | 1.20 | 1.80 | 4.10 | 1.98 | 2.13 |
| 3.00 | 3.00 | 1.40 | 2.00 | 4.50 | 2.19 | 2.36 |
| 10.00 | 10.00 | 1.60 | 2.20 | 4.80 | 2.4 | 2.57 |
| 30.00 | 30.00 | 1.75 | 2.35 | 5.00 | 2.55 | 2.73 |
| 100.00 | 100.00 | 1.80 | 2.40 | 5.30 | 2.62 | 2.81 |
Table 2.2 -- Material and geometry properties
| Layer | Thickness | cos(q inc) | Density | Thickness | Polystyrene (CH) | ||
| [cm] | [g/cm3] | [g/cm2] | f(C) | f(H) | |||
| 0.923 | 0.077 | ||||||
| EEmc Pb | 0.457 | 0.95 | 11.35 | 5.46 | |||
| BEmc Pb | 0.500 | 1.00 | 11.35 | 5.68 | Polyethylene (CH2) | ||
| EEmc Pl | 0.500 | 0.95 | 1.03 | 0.54 | f(C) | f(H) | |
| BEmc Pl | 0.500 | 1.00 | 1.03 | 0.52 | 0.857 | 0.143 | |
Table 2.3 -- Mean energy loss expectations.
| E muon | p muon | EEMC | BEMC | ||
| [GeV] | [GeV] | dE|Pb [MeV] | dE|Pl [MeV] | dE|Pb [MeV] | dE|Pl [MeV] |
| 1.00 | 0.99 | 6.55 | 0.99 | 6.81 | 1.07 |
| 3.00 | 3.00 | 7.64 | 1.1 | 7.95 | 1.19 |
| 10.00 | 10.00 | 8.74 | 1.2 | 9.08 | 1.3 |
| 30.00 | 30.00 | 9.55 | 1.28 | 9.93 | 1.38 |
| 100.00 | 100.00 | 9.83 | 1.31 | 10.22 | 1.42 |
3.0 Results
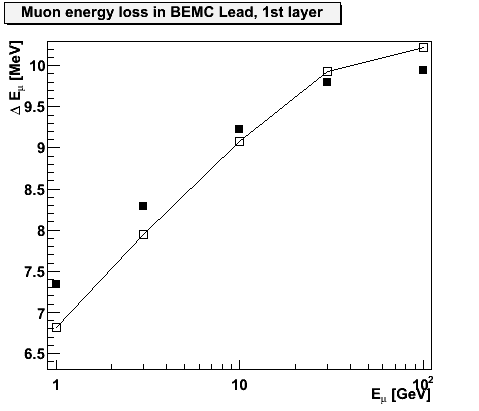
Figure 3.1 below plots the mean energy loss vs incident muon energy in the 1st lead radiator and the first plastic scintillator of the EEMC. The energy loss in Pb agrees with expectations at the 5-10% level in lead and better in the plastic scintillator. Given that there are some uncertainties in reading values off of figure 2.1 above, this is an acceptable level of agreement at present. It does not indicate a large discrepancy between the simulated energy loss and what geant should be doing.
Figure 3.1 -- Mean energy loss vs. incident muon energy for muons penetrating the first lead radiator and the first plastic scintillator in the EEMC. Solid symbols indicate geant response, open symbols the expected values from table 2.2.
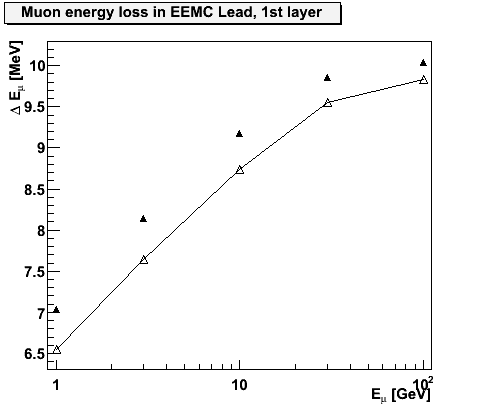

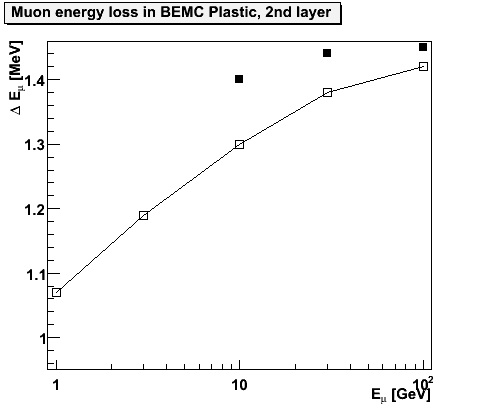
Figure 3.2 -- Mean energy loss vs. incident muon energy for muons penetrating the first lead radiator and the second plastic scintillator in the BEMC. Solid symbols indicate geant response, open symbols the expected values from table 2.2. In the plastic, we resitrict our comparison to E > 10 GeV. Lower values showed odd behavior, probably because multiple scattering messed up the method I used to select out the scintillating layer.
4.0 Conclusions
The energy-loss distributions geant simulates in the lead and plastic scintillator of both the EEMC and BEMC appear to be reasonable. They reproduce the expected mean energy loss within a few to 10%. There is no smoking gun for the EEMC "sampling fraction problem" evidenced by this study. The next step in debugging the EEMC simulations will be to access GEANT hit information event-by-event and calculate the sampling fraction directly in photon and electron induced EM cascades.
References:
Groups:
- jwebb's blog
- Login or register to post comments