Abstract: Single electrons are thrown at the EEMC for energies ranging from ~1 to ~100 GeV at normal incidence, at at an angle of incidence corresponding to η=1.8. The sampling fraction is computed in each energy bin as the ratio of the energy deposited in the endcap plastic scintillator divided by the incident energy of the electron. Between 5 and 20 GeV, the sampling fraction is 4.09%, varying by 1% of its mean value across this energy range. This is consistent with various recollections of the test beam data. Beyond this range, the sampling fraction varies ~smoothly within ~6% of this value.
1.0 Normal Incidence
The vertex is set to (0,150,0) and electrons thrown at near-normal incidence to the EEMC (η=9.5).
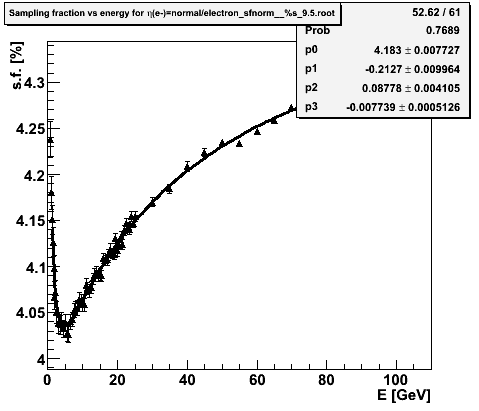
Figure 1.1 -- Sampling fraction vs. incident energy for electrons normally incident on the EEMC. The black line represents a fit over the range from 5 < E < 20 GeV, corresponding to the EEMC testbeam measurements. The blue lines indicate +/- 1% around the fit value. The right plot shows a histogram of the values in the testbeam range. The simulated sampling fractions are consistent with a constant to within 1% over the range of the testbeam data.
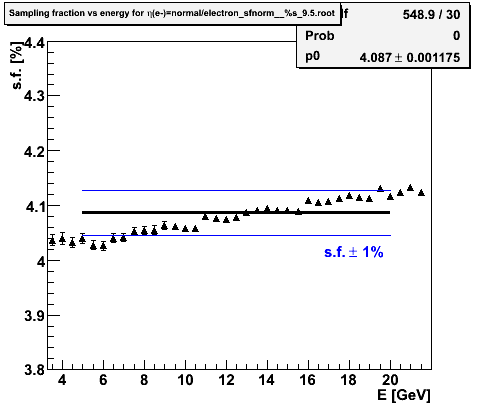
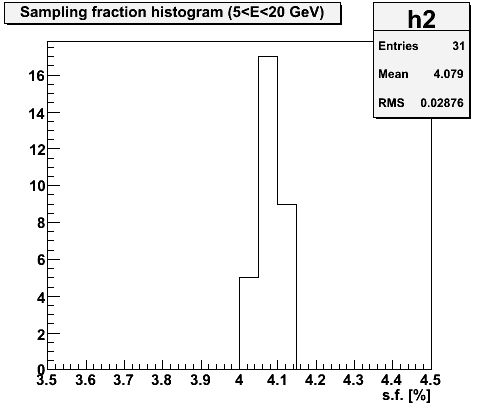
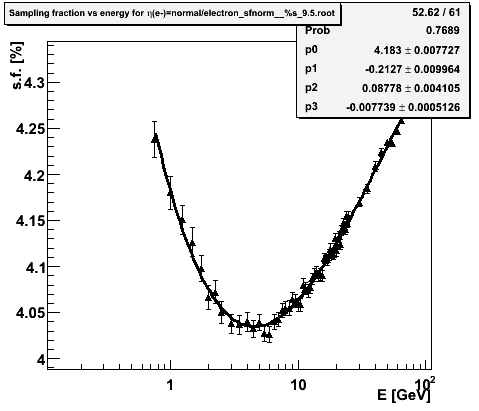
Figure 1.2 -- Sampling fraction vs. incident energy for electrons normally incident on the EEMC. The fit is a third-order polynomial in x=log(E).... i.e. f(E) = p0 + p1*log(E) +p2*log(E)*log(E)+... Right plot shows the same sampling fraction vs energy, but plotted against a logarithmic x-axis. Note the change of y-axis scale from figure 1.1.
Conclusions:
1. The MC sampling fraction for normally-incident electrons is constant w/in +/- 1% over the range 5 to 20 GeV.
2. This is consistent with recollections of test-beam data (based on three measurements at 5, 10 and 20 GeV).'
3. The Monte Carlo does exhibit nonlinearities in its response outside of this range. These nonlinearities reach the few % level, spanning 0.7 to 120 GeV.
4. The energy-dependence of the sampling fraction can be described by a fairly simple functional form.
2.0 Non-normal incidence, eta = 1.85
A more direct comparison with the testbeam data can be made by throwing electrons from the nominal vertex at a pseudorapidity of 1.85.
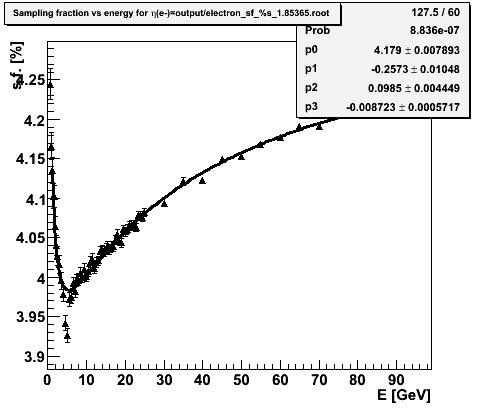
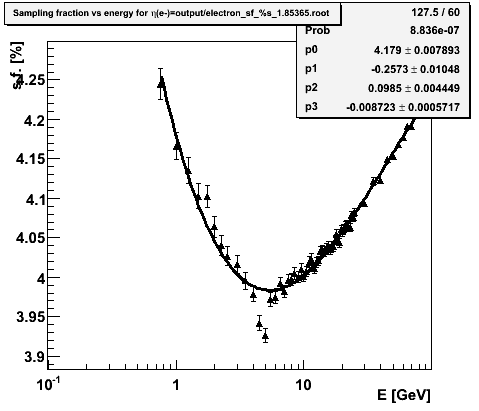
Figure 2.1 -- Sampling fraction vs. incident energy for electrons incident on the EEMC at η=1.85. The black line represents a fit over the range from 5 < E < 20 GeV, corresponding to the EEMC testbeam measurements. The blue lines indicate +/- 1% around the fit value. The right plot shows a histogram of the values in the testbeam range. The simulated sampling fractions are consistent with a constant to within 1% over the range of the testbeam data.
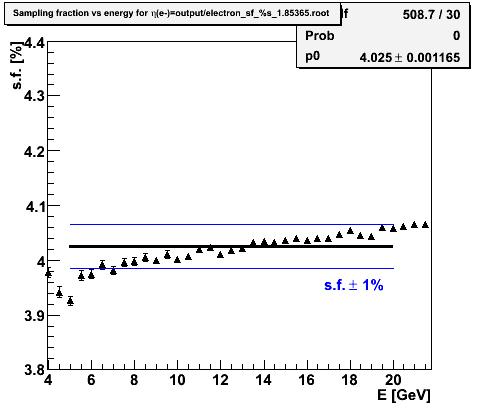
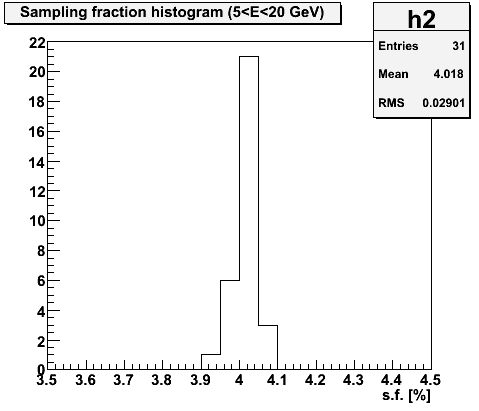
Figure 1.2 -- Sampling fraction vs. incident energy for electrons normally incident on the EEMC. The fit is a third-order polynomial in x=log(E).... i.e. f(E) = p0 + p1*log(E) +p2*log(E)*log(E)+... Right plot shows the same sampling fraction vs energy, but plotted against a logarithmic x-axis. Note the change of y-axis scale from figure 1.1.
Conclusions:
1. The MC sampling fraction for normally-incident electrons is constant w/in +/- 1% over the range 5 to 20 GeV.
2. This is consistent with recollections of test-beam data (based on three measurements at 5, 10 and 20 GeV).'
3. The Monte Carlo does exhibit nonlinearities in its response outside of this range. These nonlinearities reach the few % level, spanning 0.7 to 120 GeV.
4. The energy-dependence of the sampling fraction can be described by a fairly simple functional form, except around E=5 GeV where a fairly sharp dip is observed.
3.0 Scan vs pseudorapidity
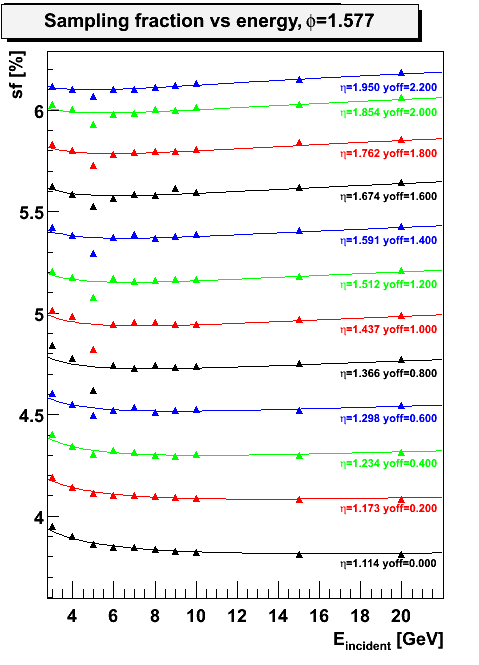
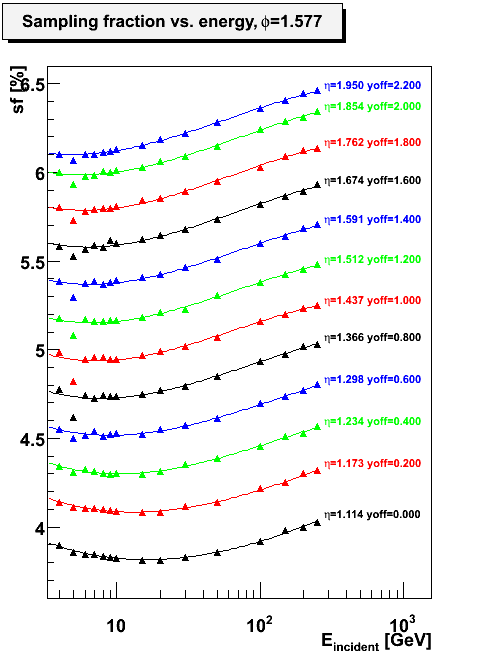
Figure 3.1 -- Plot sampling fraction vs.energy in all 12 pseudorapidity bins. x-axis zoomed in on range relevant to test beam data, 5 to 20 GeV. The curves are fits in each etabin to a 3rd degree polynomial in log(E). The sampling fraction in each etabin has been offset from its true value by the amount noted on the plot.
Over the range 5 - 20 GeV, the sampling fraction is ~ constant within any given eta bin. However, it does change from eta-bin to eta-bin. The fast simulator assumes a constant sampling fraction vs. eta.
Above ~20 GeV the sampling fraction increases proportionatly with incident energy.
Below ~5 GeV the sampling fraction increases inversely with incident energy for larger incident angles, but is much more constant for smaller incident angles.
There is a drop below the "smooth line" at about E=5 GeV which occurs as a function of incident angle. At normal incidence, it is not present. The feature is present in the middle of the detector (eta~1.5), so this doesn't appear to be leakage. It disappears for the last two or three eta rings. It is most prominent, in fact, in the center of the detector. Not a clue what this could be from.


