How to check and visualize the EPD mapping from tile to QT channel
Updated on Mon, 2024-06-10 08:55. Originally created by lisa on 2023-06-12 17:54.
To make a connection with the board numbering scheme of the Trigger group (and which is used in our online plots), take a look here.
Then do the following
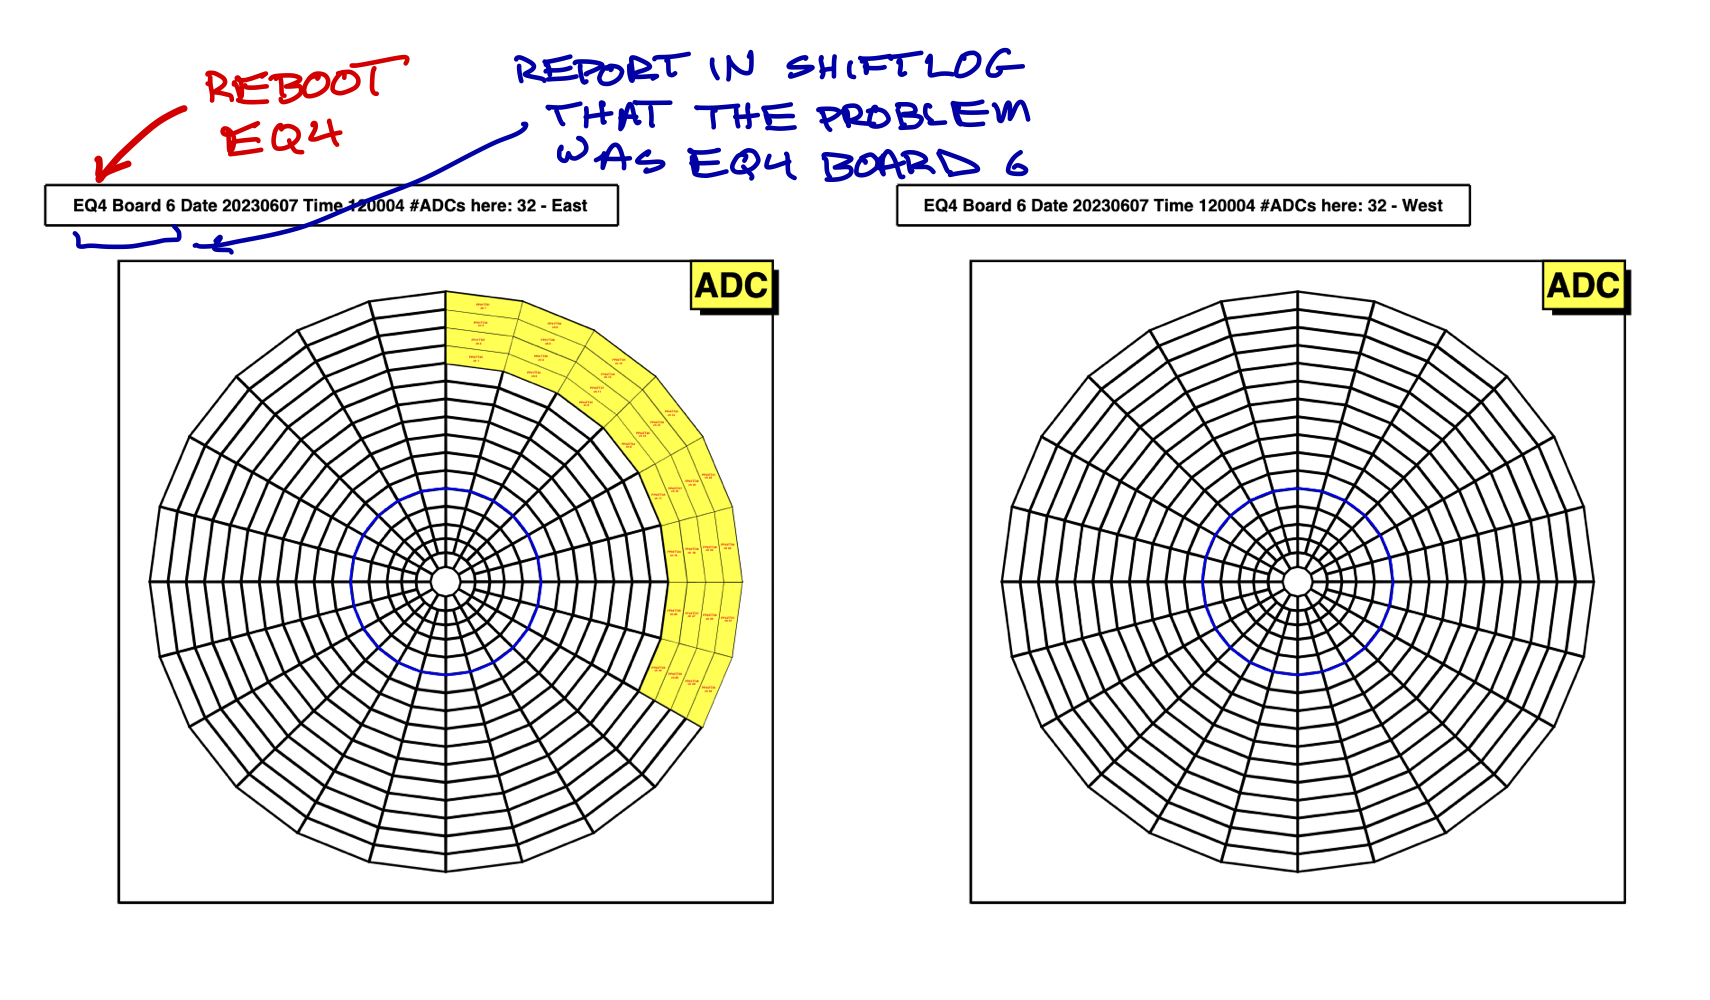
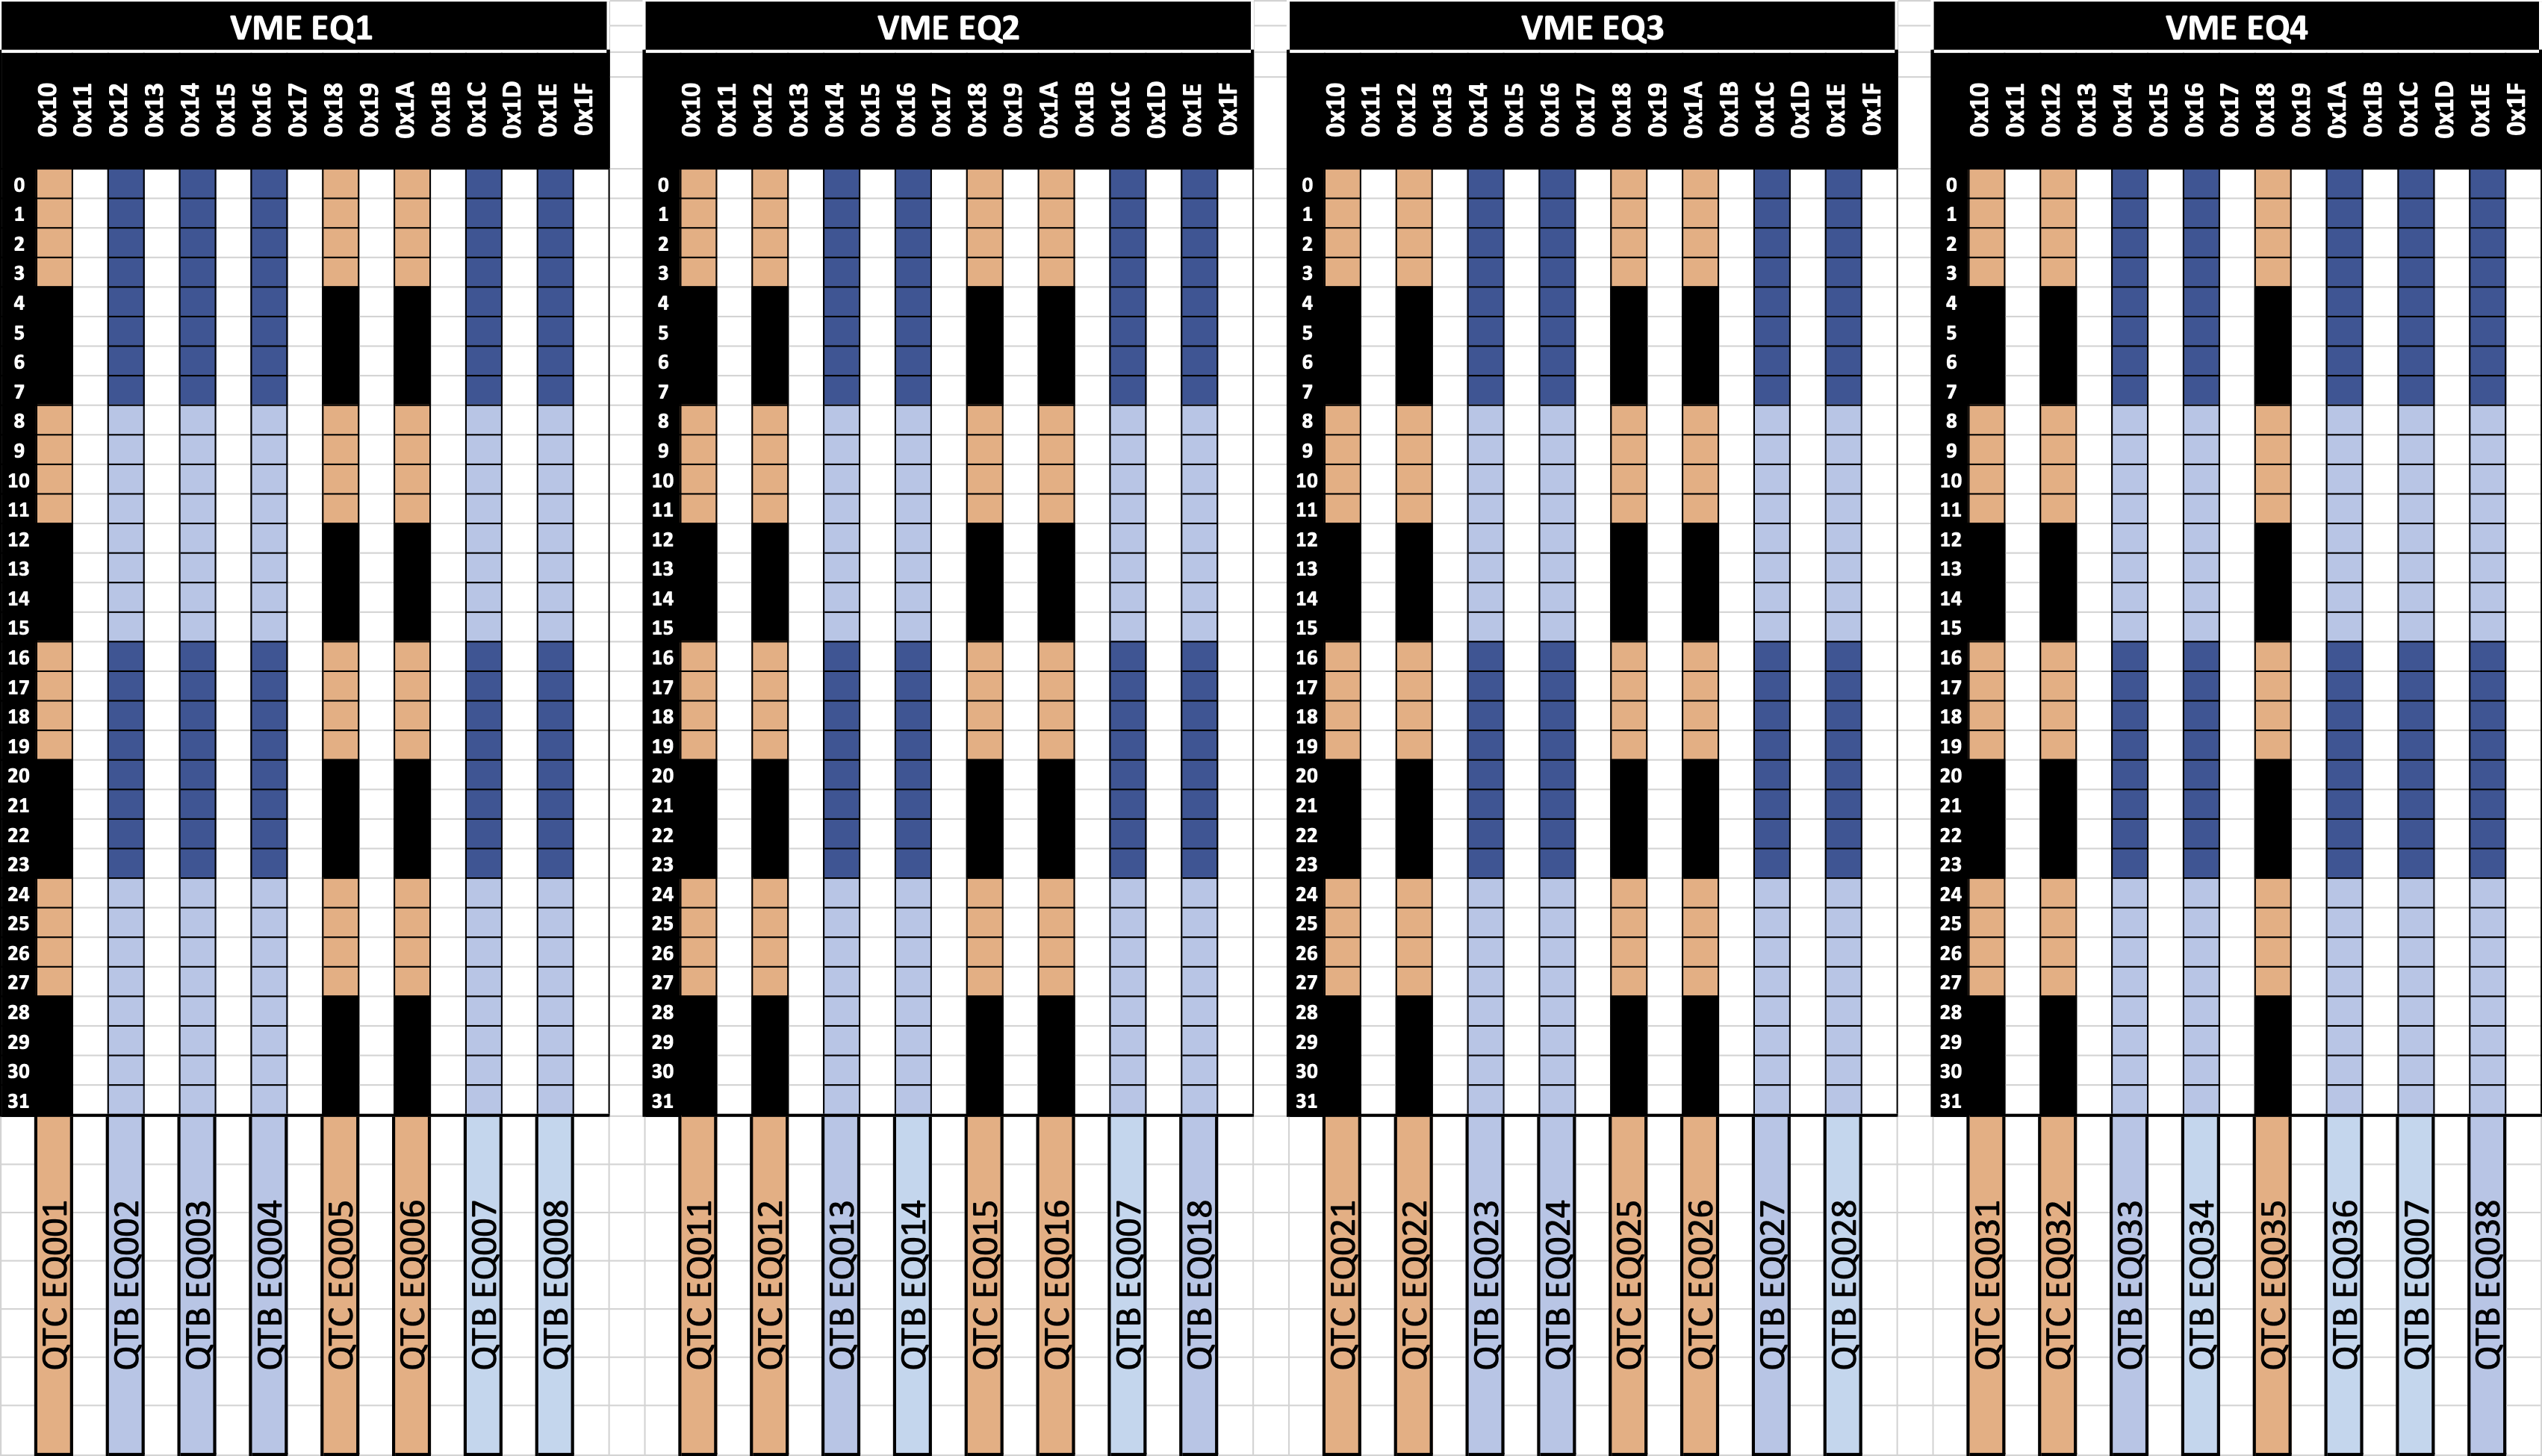
If the failure pattern looks like the image above, the label tells you which crate to reboot (EQ4 in this case) and what to report in the shiftlog.
The Seven Patterns test is the ultimate check of the entire reconstruction chain, including the database, from tile (well, FEE channel) through the picoDst that the physics analyzer relies upon. The Seven Patterns test is discussed here, and instructions on how to perform it are discussed here.
But for QA, online monitoring, and database-checking, is is also useful to visualize the mapping itself. (E.g. if we see groupings of "dead tiles" during the run, is it due to a bad daughter card?) Accessible at the bottom of this page is a macro VerifyEPDqtDB.C, which can be run in root4star. It queries the epdQTMap database, for a given date and time, and (1) checks it for consistency; (2) makes useful visuals of the mapping; (3) generates .txt files that are needed for the online monitoring and QA plots during the run.
Also at the bottom of the page is the .pdf file and .txt file it produces, for date and time 20230607,120004 (7 June 2023 at 12:00:04).
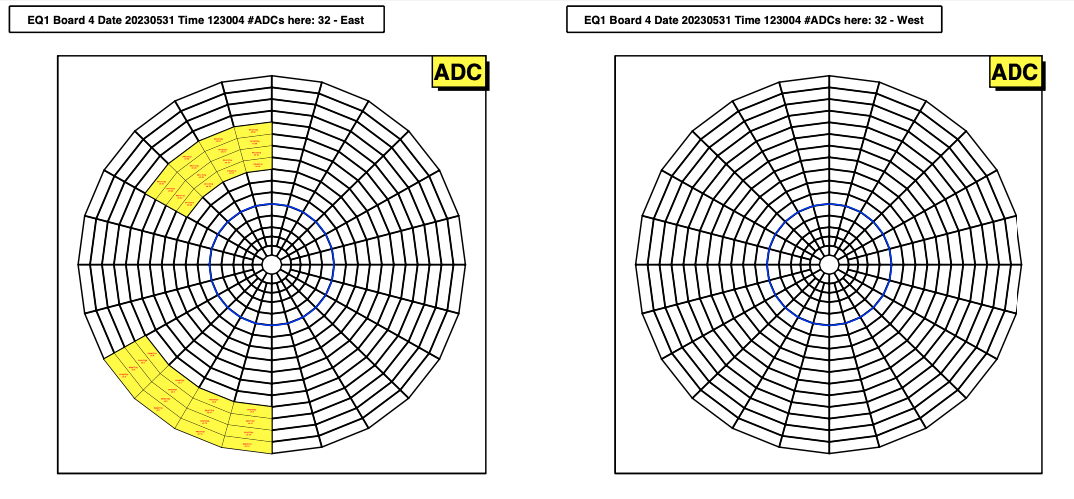
Here are the maps for one of the 32 QT boards used for the EPD:
And here are the tiles connected to each channel in EQ3. (Yellow is ADC, blue is TAC.)
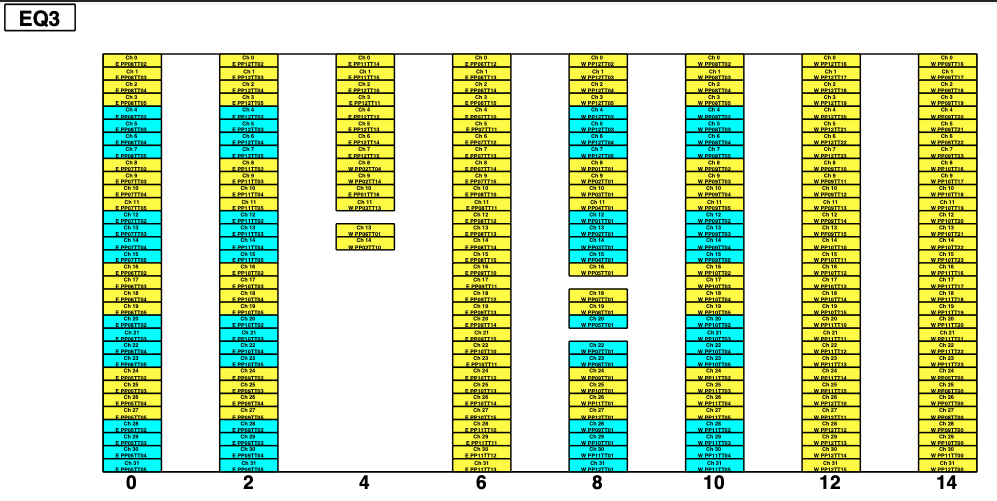
Broad strokes can be seen zoomed-out. If you want to see the actual tile identifiers or channel details, you need to zoom in on the pdf file.
Executive summary:
A code is presented that- checks the EPD QT database for consistency and logic
- makes useful visual representation of the maps
- generates .txt files needed for the online monitoring and QA plots
To make a connection with the board numbering scheme of the Trigger group (and which is used in our online plots), take a look here.
Instructions for shift crew.
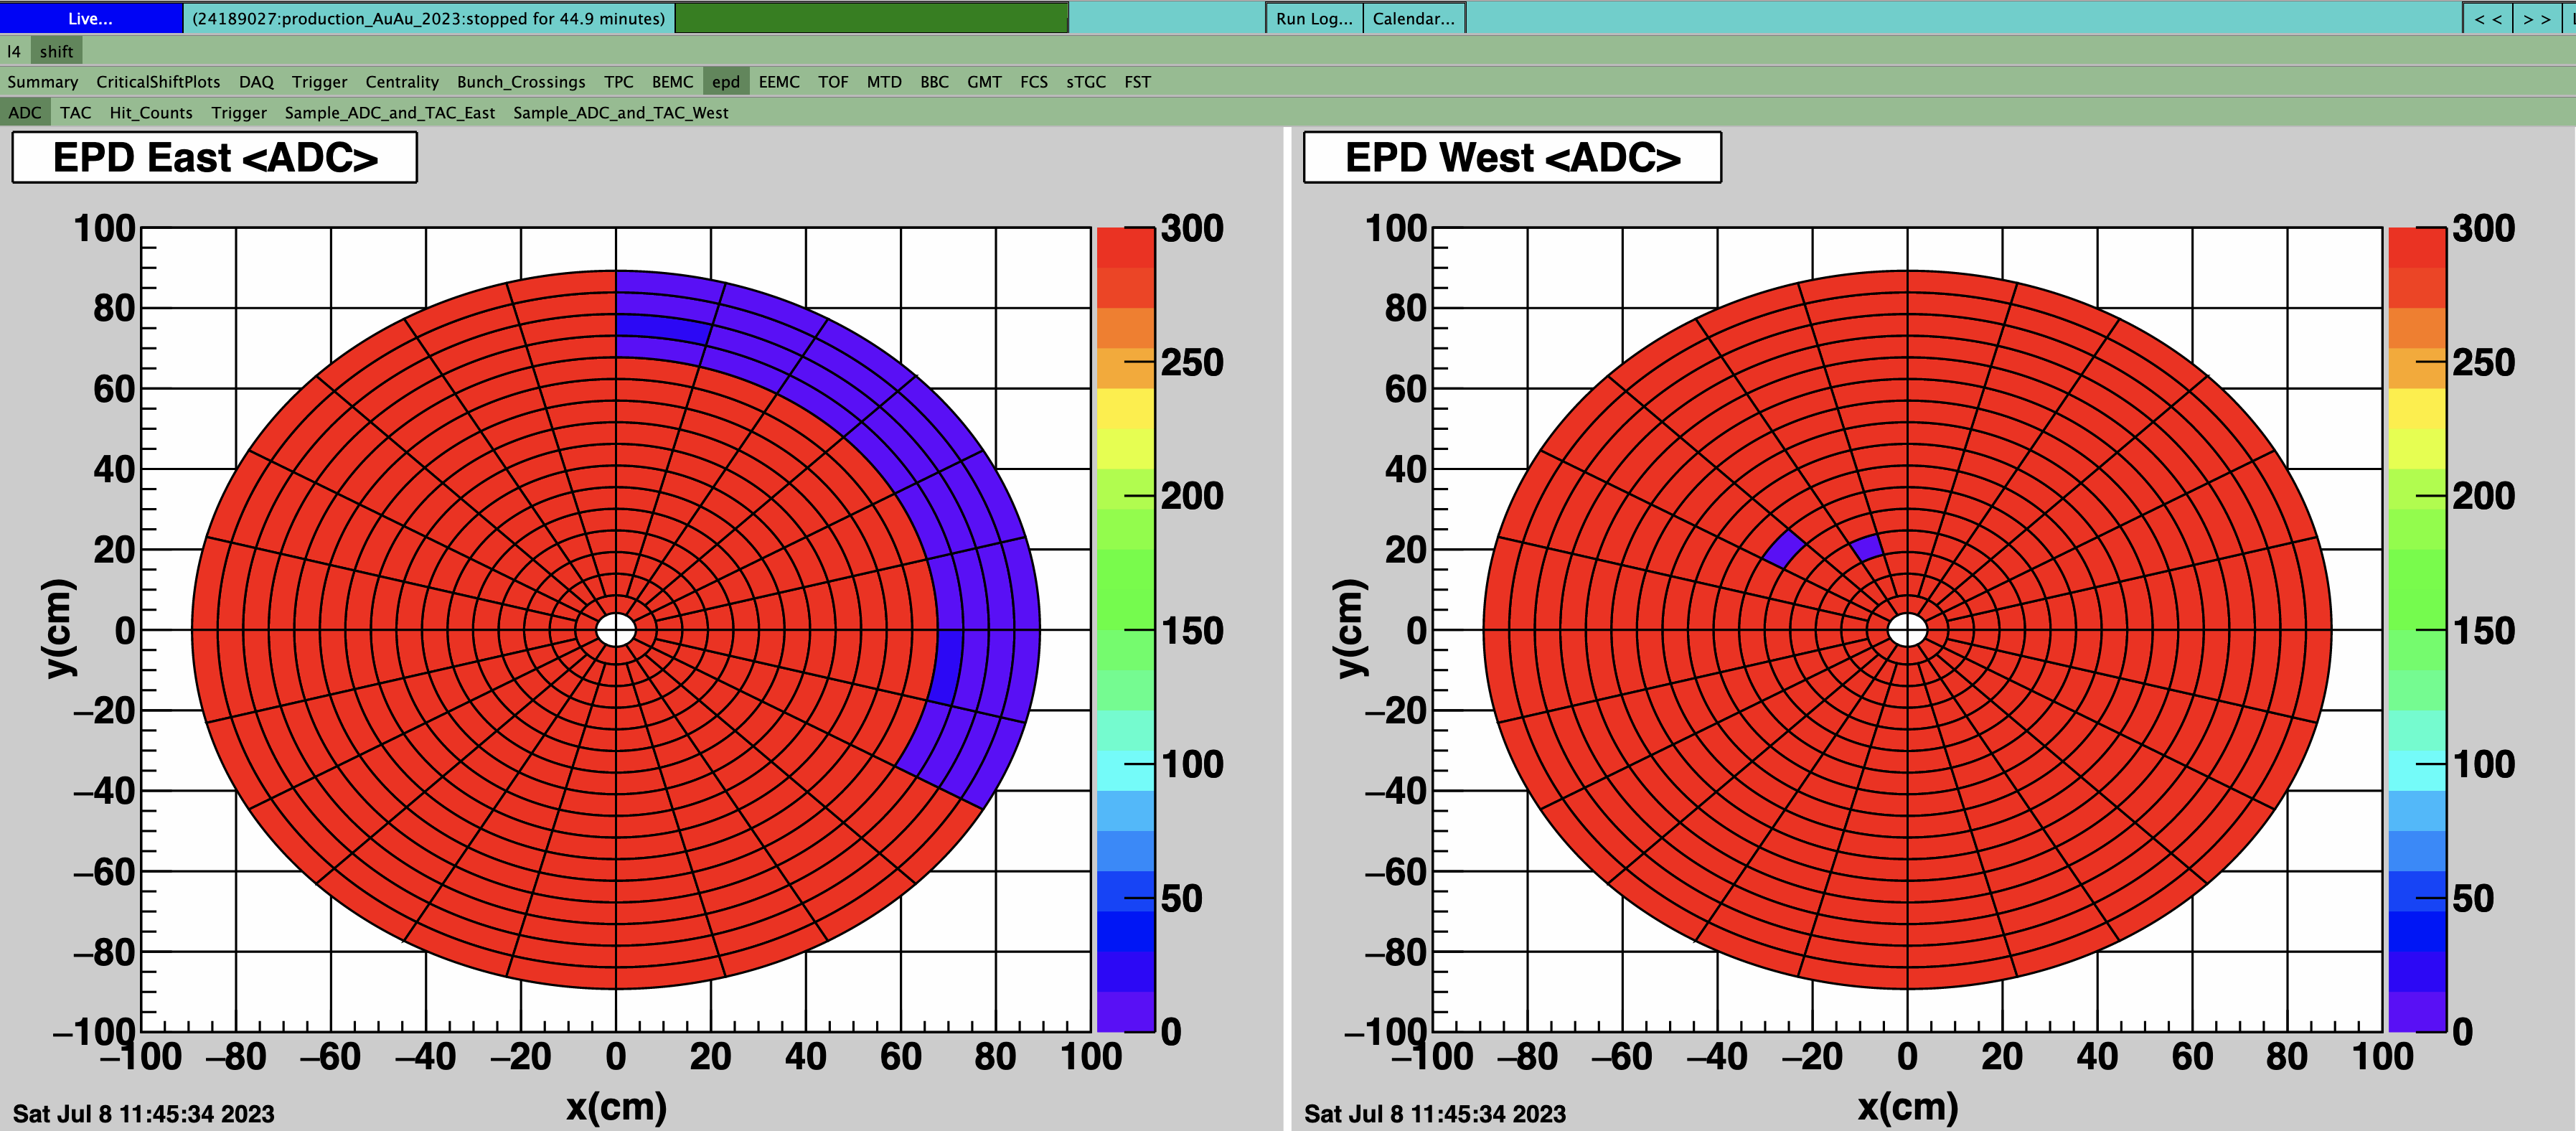
if the online plot for EPD shows many "low" or high (zero) <ADC> values in a cluster, for example like this:Then do the following
- stop the run and restart it
- if that does not fix it then...
- scroll (it's easy and fast, don't worry) through the this pdf to see which EQ crate these tiles correspond to. (For the example above, you will see this pattern on page 46 you will see the image below, telling you that the problem is in EQ4.)
- reboot the crate (if you are doing this for the third time, power cycle the crate, instead)
- reboot TRG and DAQ at Run Control (if you are doing this for the third time, do Reboot All, instead)
- take trigger pedestals with rhic_clock_clean
- restart the run
- report in the shiftlog which crate and which board was the problem (see image below).
- It may be required to perform this procedure up to 3 times.
- if that does not fix it, then call an expert
- experts may find it useful to look at the STP2 Monitor page, to report to trigger group.
If the failure pattern looks like the image above, the label tells you which crate to reboot (EQ4 in this case) and what to report in the shiftlog.
Discussion
The connection between the readout electronics space (Crate,Board,Channel) and geometrical space (EastWest,Position,Tile) is non-trivial, but it must be right, for any detector that claims to find an event plane. That mapping is stored, as a function of time in epdQTMap, one of STAR's many databases. Whenever the physical map changes (cabling changes, boards moved, etc), this database must be updated to reflect the physical reality, or else the data is random telephone numbers.The Seven Patterns test is the ultimate check of the entire reconstruction chain, including the database, from tile (well, FEE channel) through the picoDst that the physics analyzer relies upon. The Seven Patterns test is discussed here, and instructions on how to perform it are discussed here.
But for QA, online monitoring, and database-checking, is is also useful to visualize the mapping itself. (E.g. if we see groupings of "dead tiles" during the run, is it due to a bad daughter card?) Accessible at the bottom of this page is a macro VerifyEPDqtDB.C, which can be run in root4star. It queries the epdQTMap database, for a given date and time, and (1) checks it for consistency; (2) makes useful visuals of the mapping; (3) generates .txt files that are needed for the online monitoring and QA plots during the run.
Also at the bottom of the page is the .pdf file and .txt file it produces, for date and time 20230607,120004 (7 June 2023 at 12:00:04).
Here are the maps for one of the 32 QT boards used for the EPD:
And here are the tiles connected to each channel in EQ3. (Yellow is ADC, blue is TAC.)
Broad strokes can be seen zoomed-out. If you want to see the actual tile identifiers or channel details, you need to zoom in on the pdf file.
»
- lisa's blog
- Login or register to post comments