Second EPD Timing Scan of Run 23
Updated on Tue, 2023-05-23 00:09. Originally created by lisa on 2023-05-22 21:53.
In our first timing scan of this run, we found the optimum timing labels for the EPD QTs. However: (1) EQ4 was not working and (2) none of the QTDs worked.
On 22 May 2023, we took the second timing scan.
Some details
As before, the signal evolution with gate delay for all channels in a given "category" look very similar. (Category means EastQTB, EastQTC. WestQTB. WestQTC, EastQTD.) Except! Now EQ4 looks completely different than the rest.
Examples
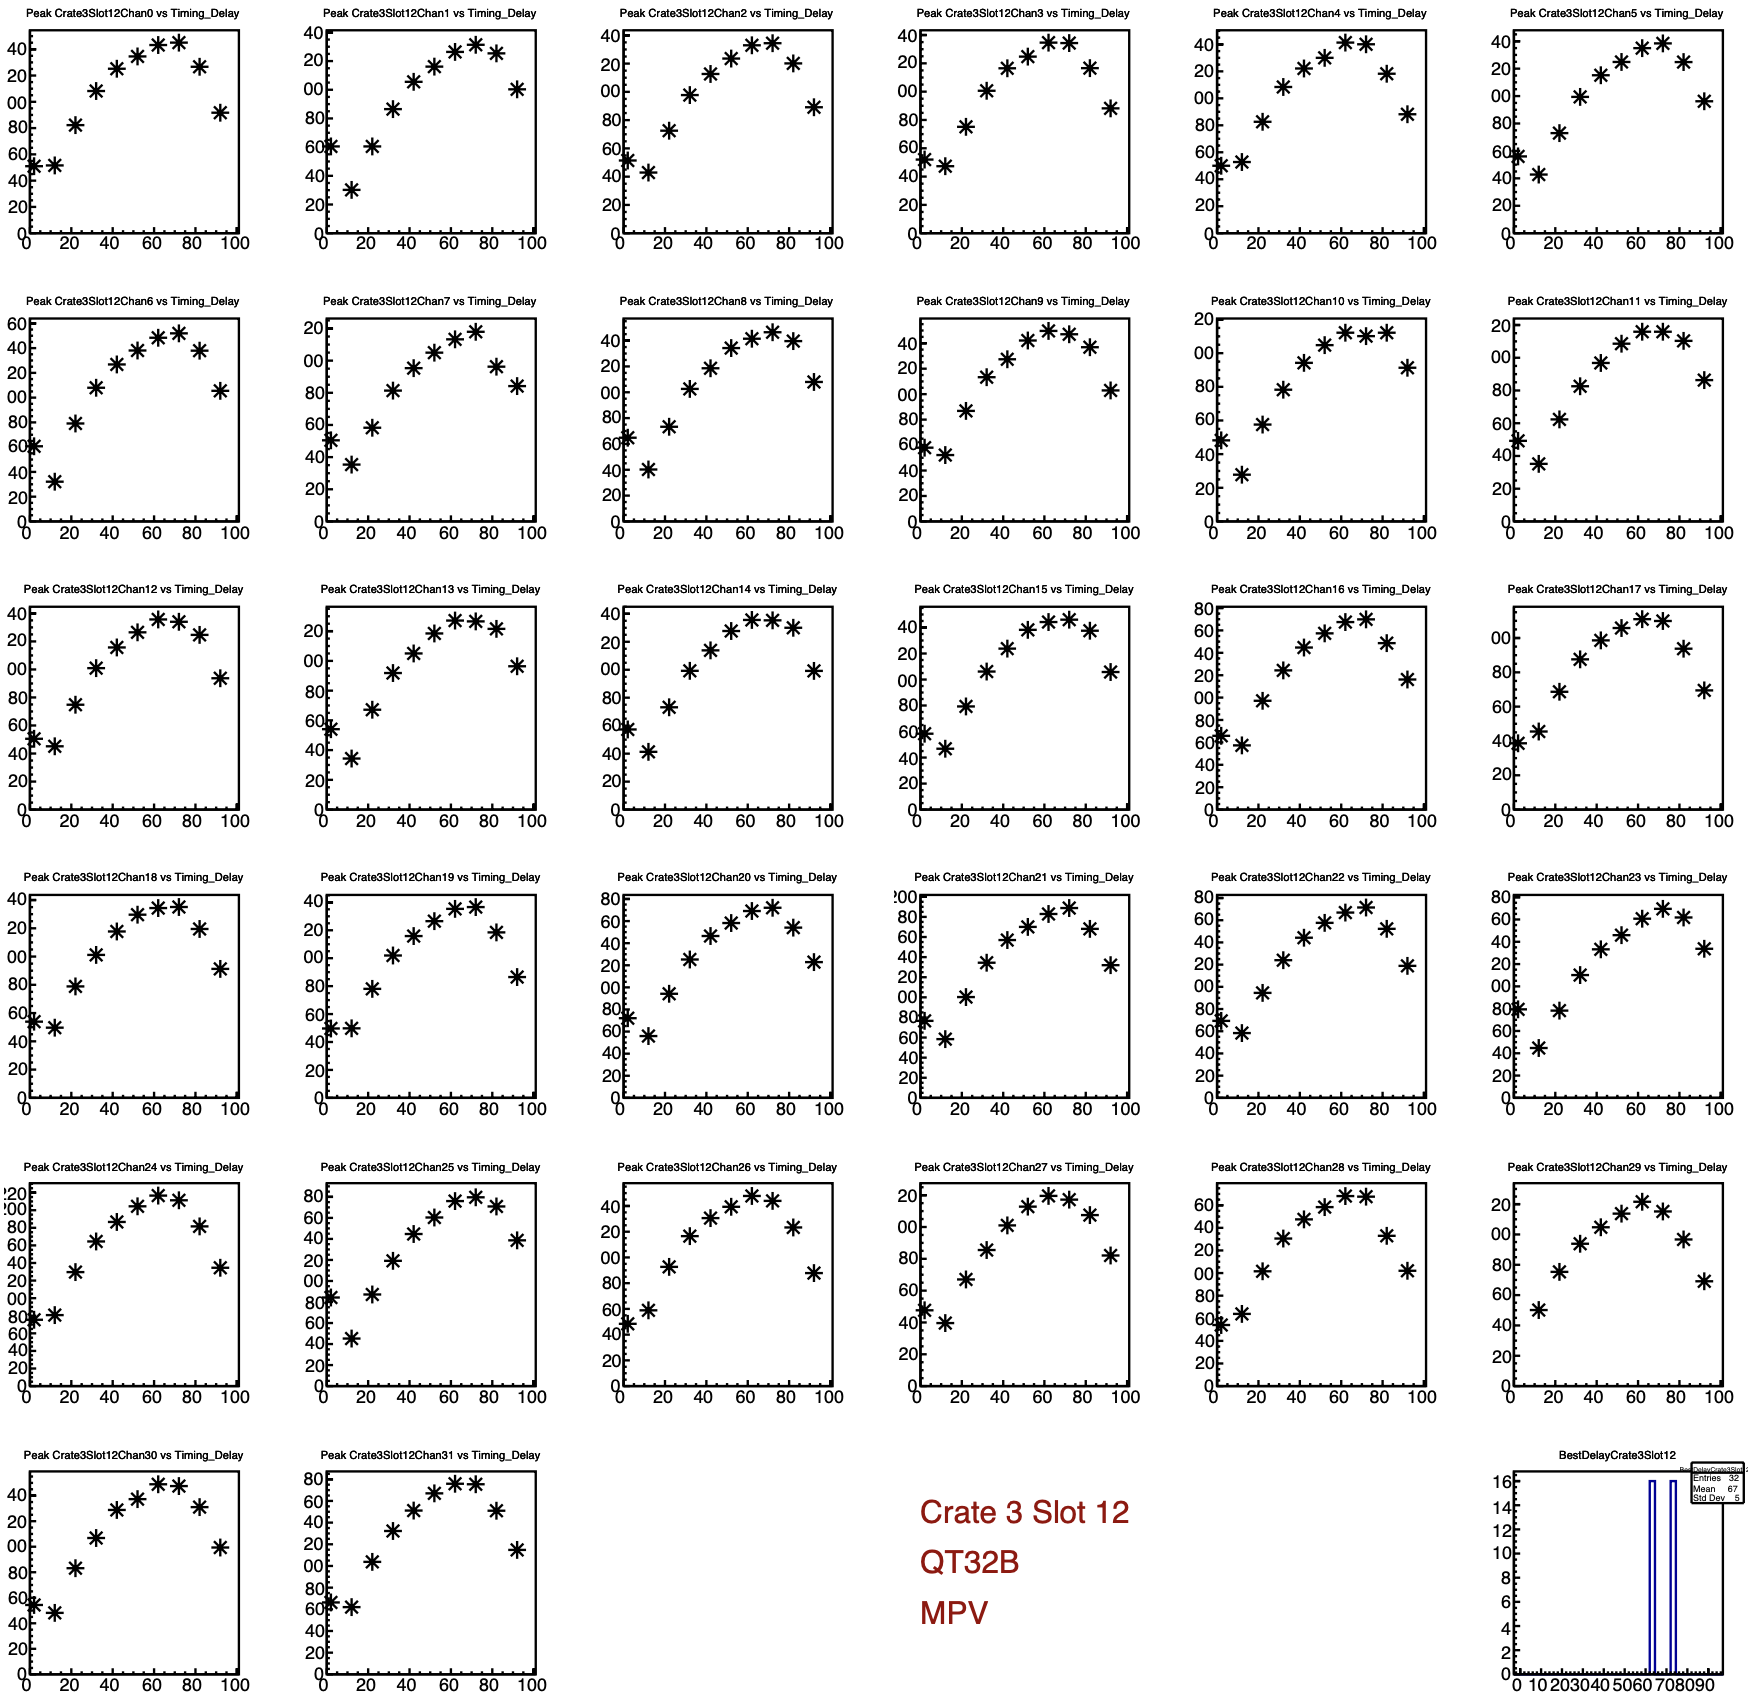
Below is a QTB on the West, in EQ3:
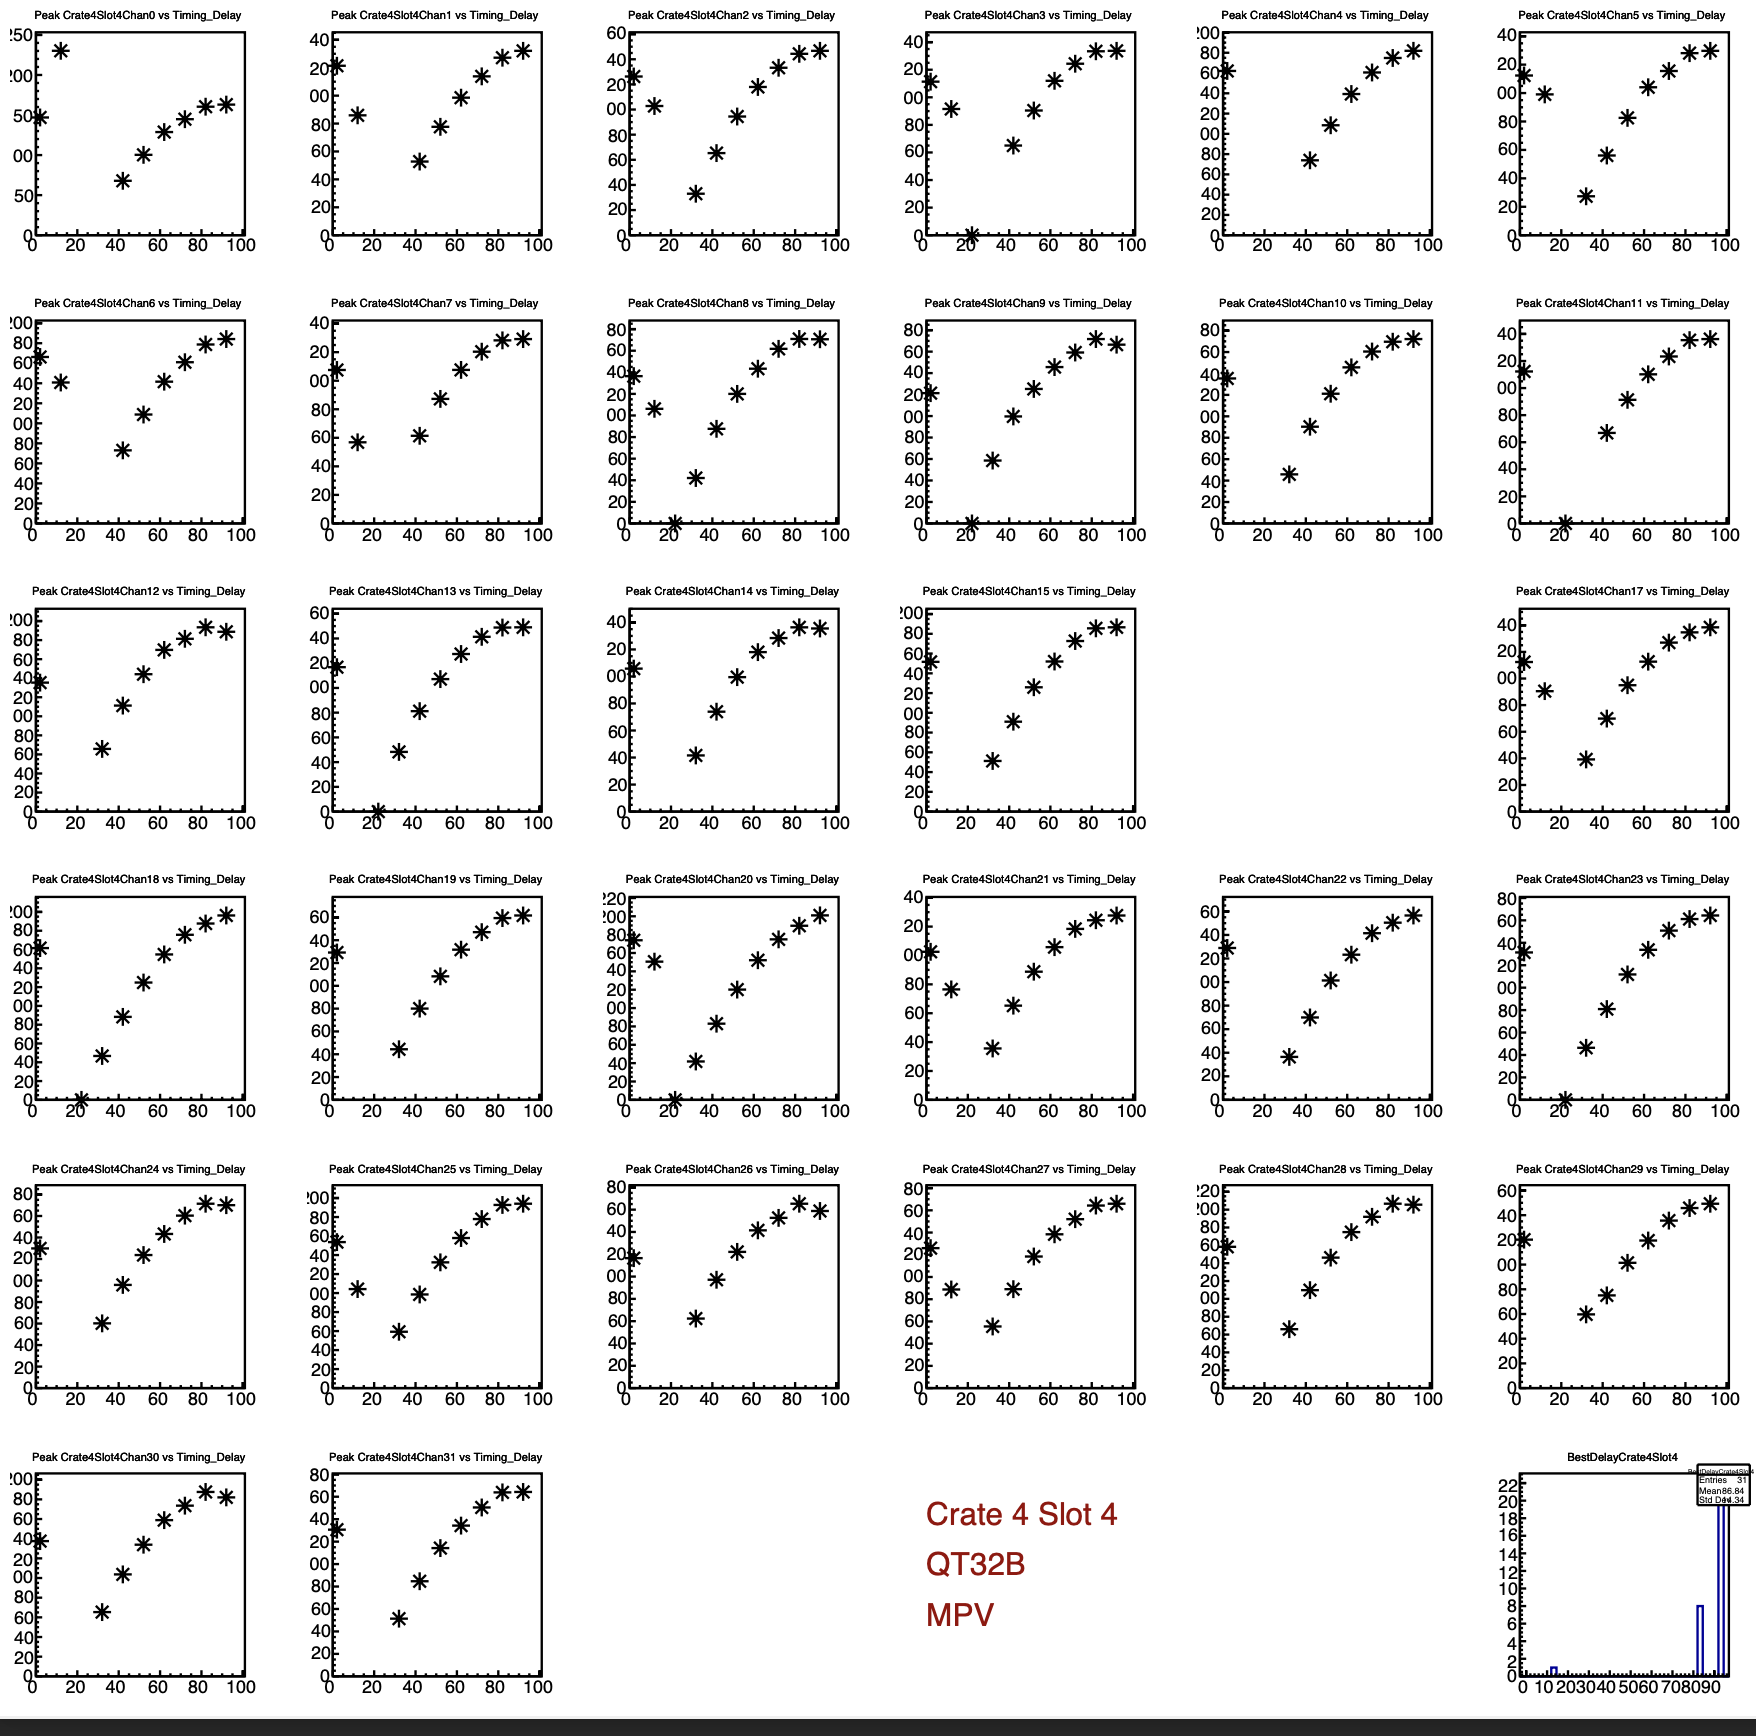
And the same thing, in EQ4:
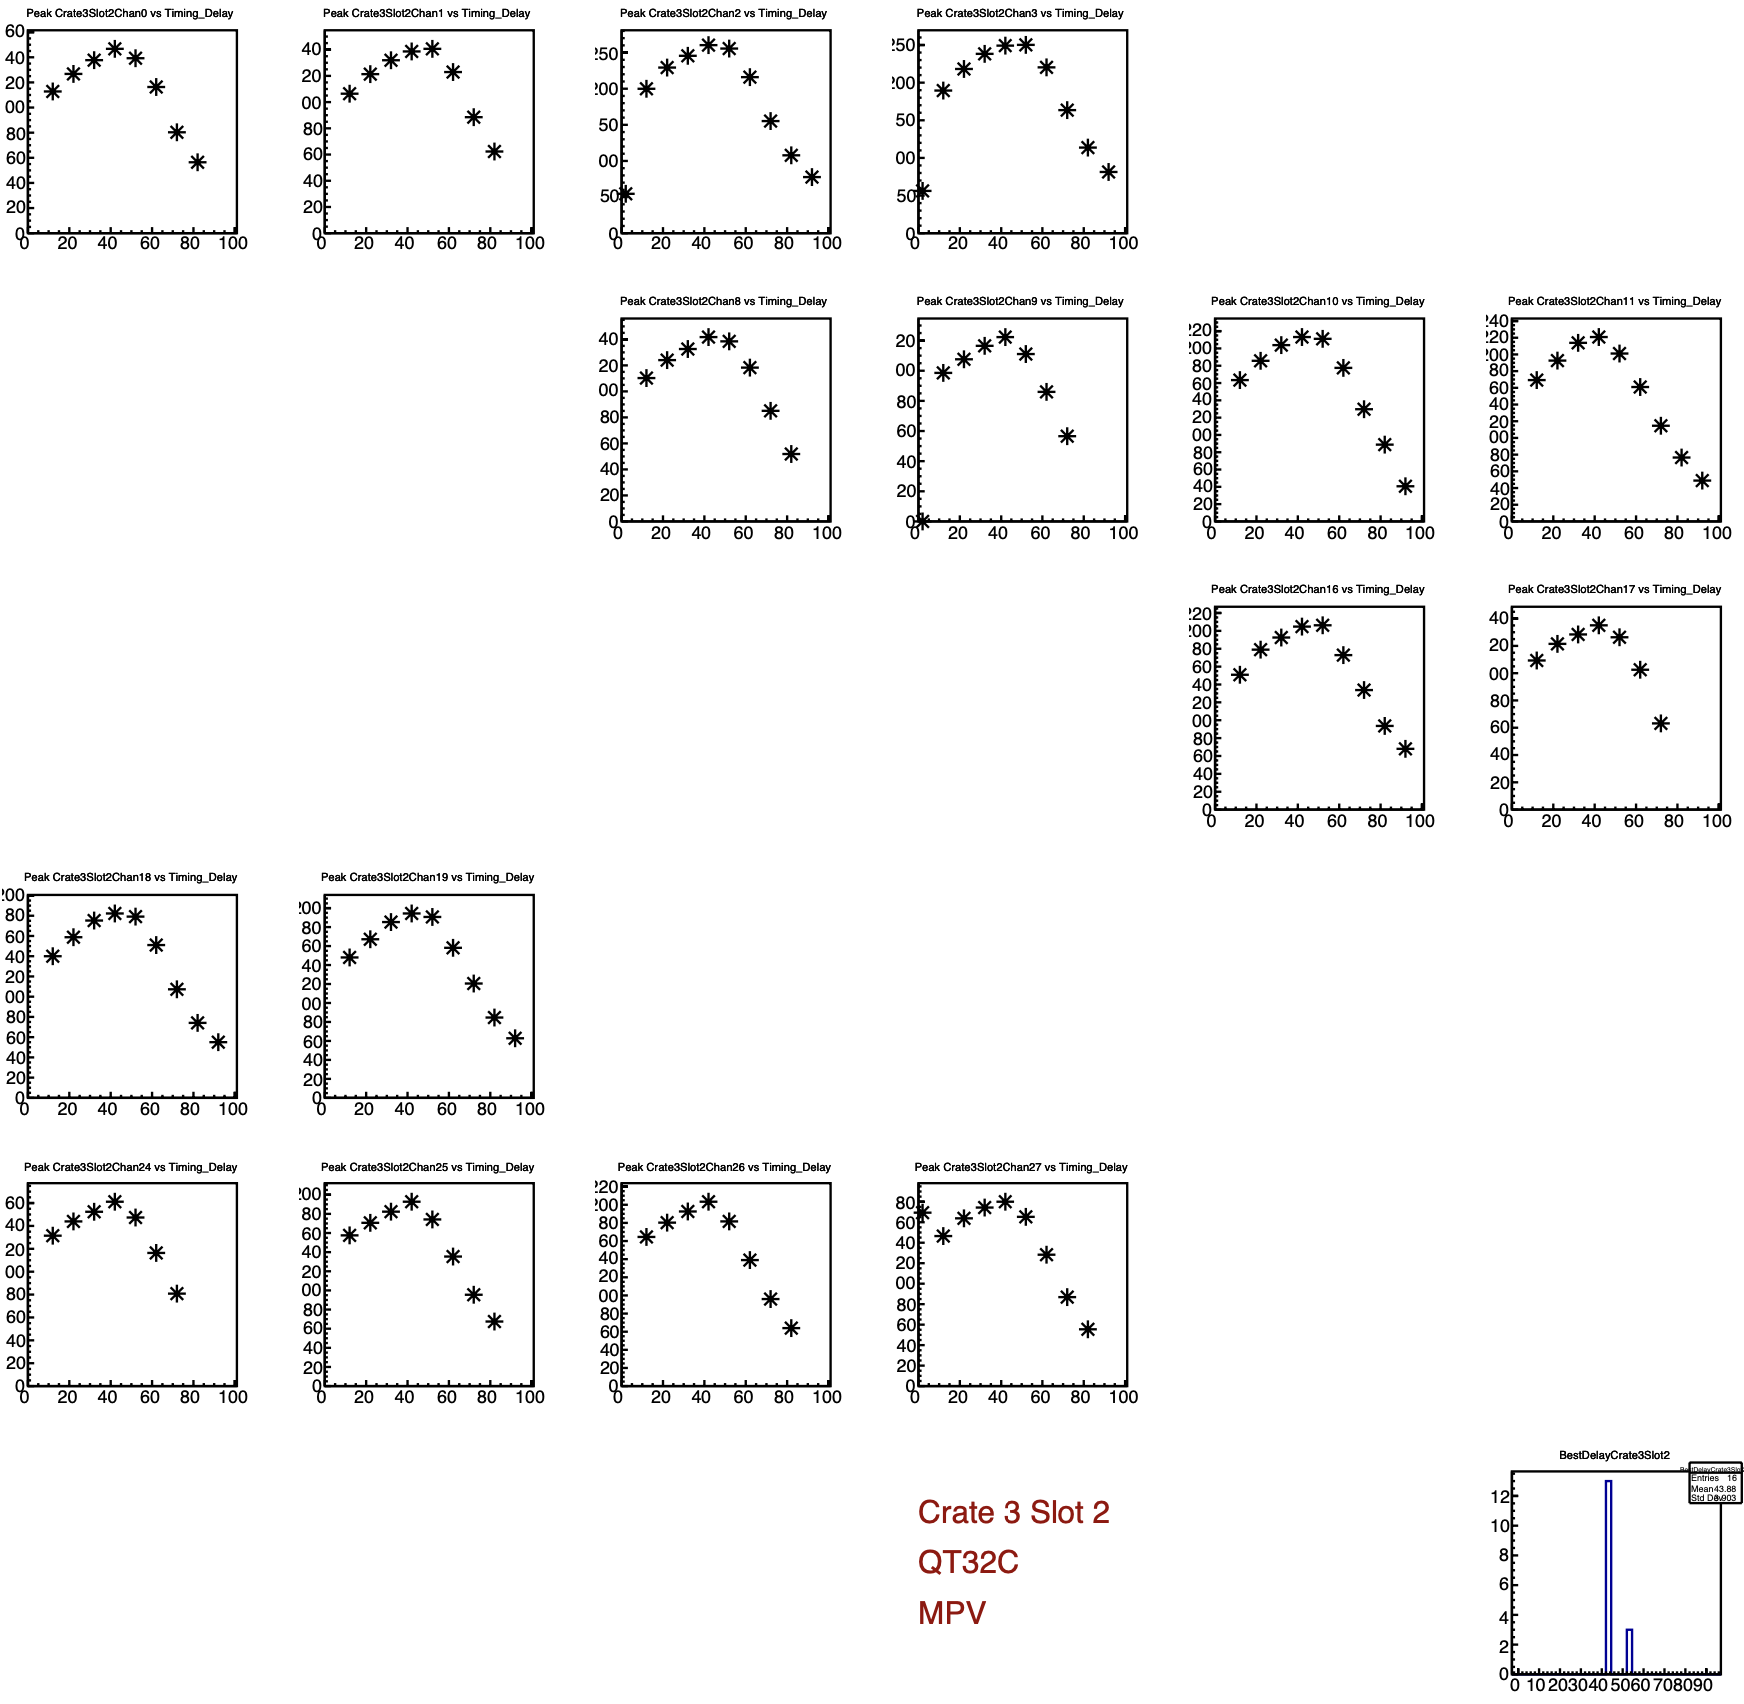
Now a QTC on the East side, from EQ3:
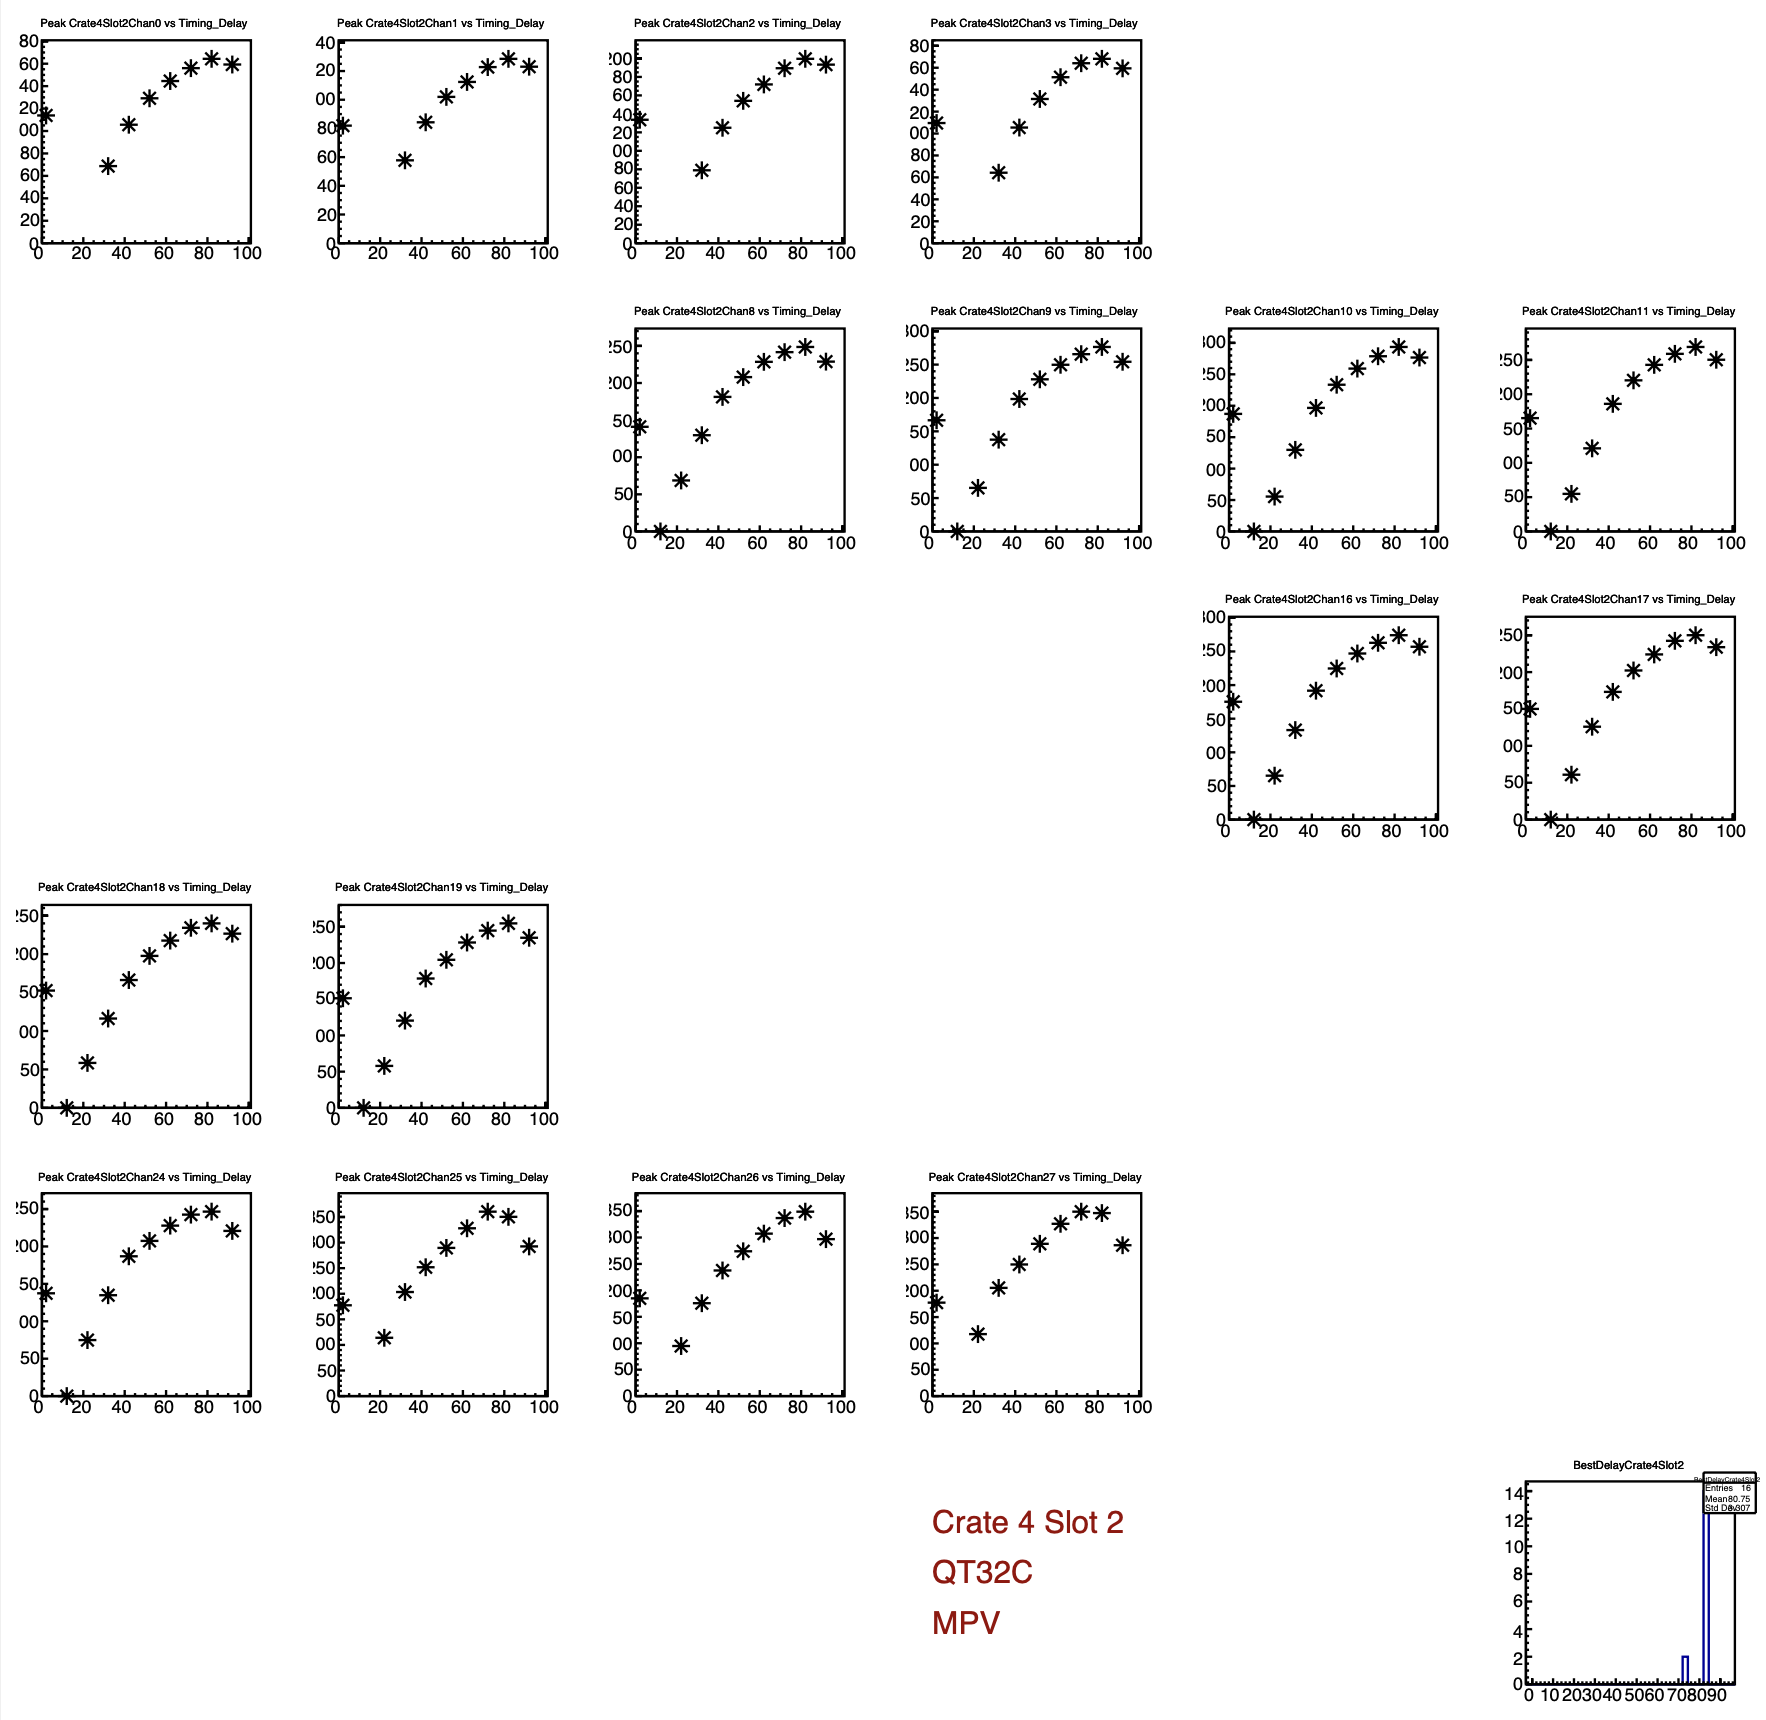
And the same from EQ4:
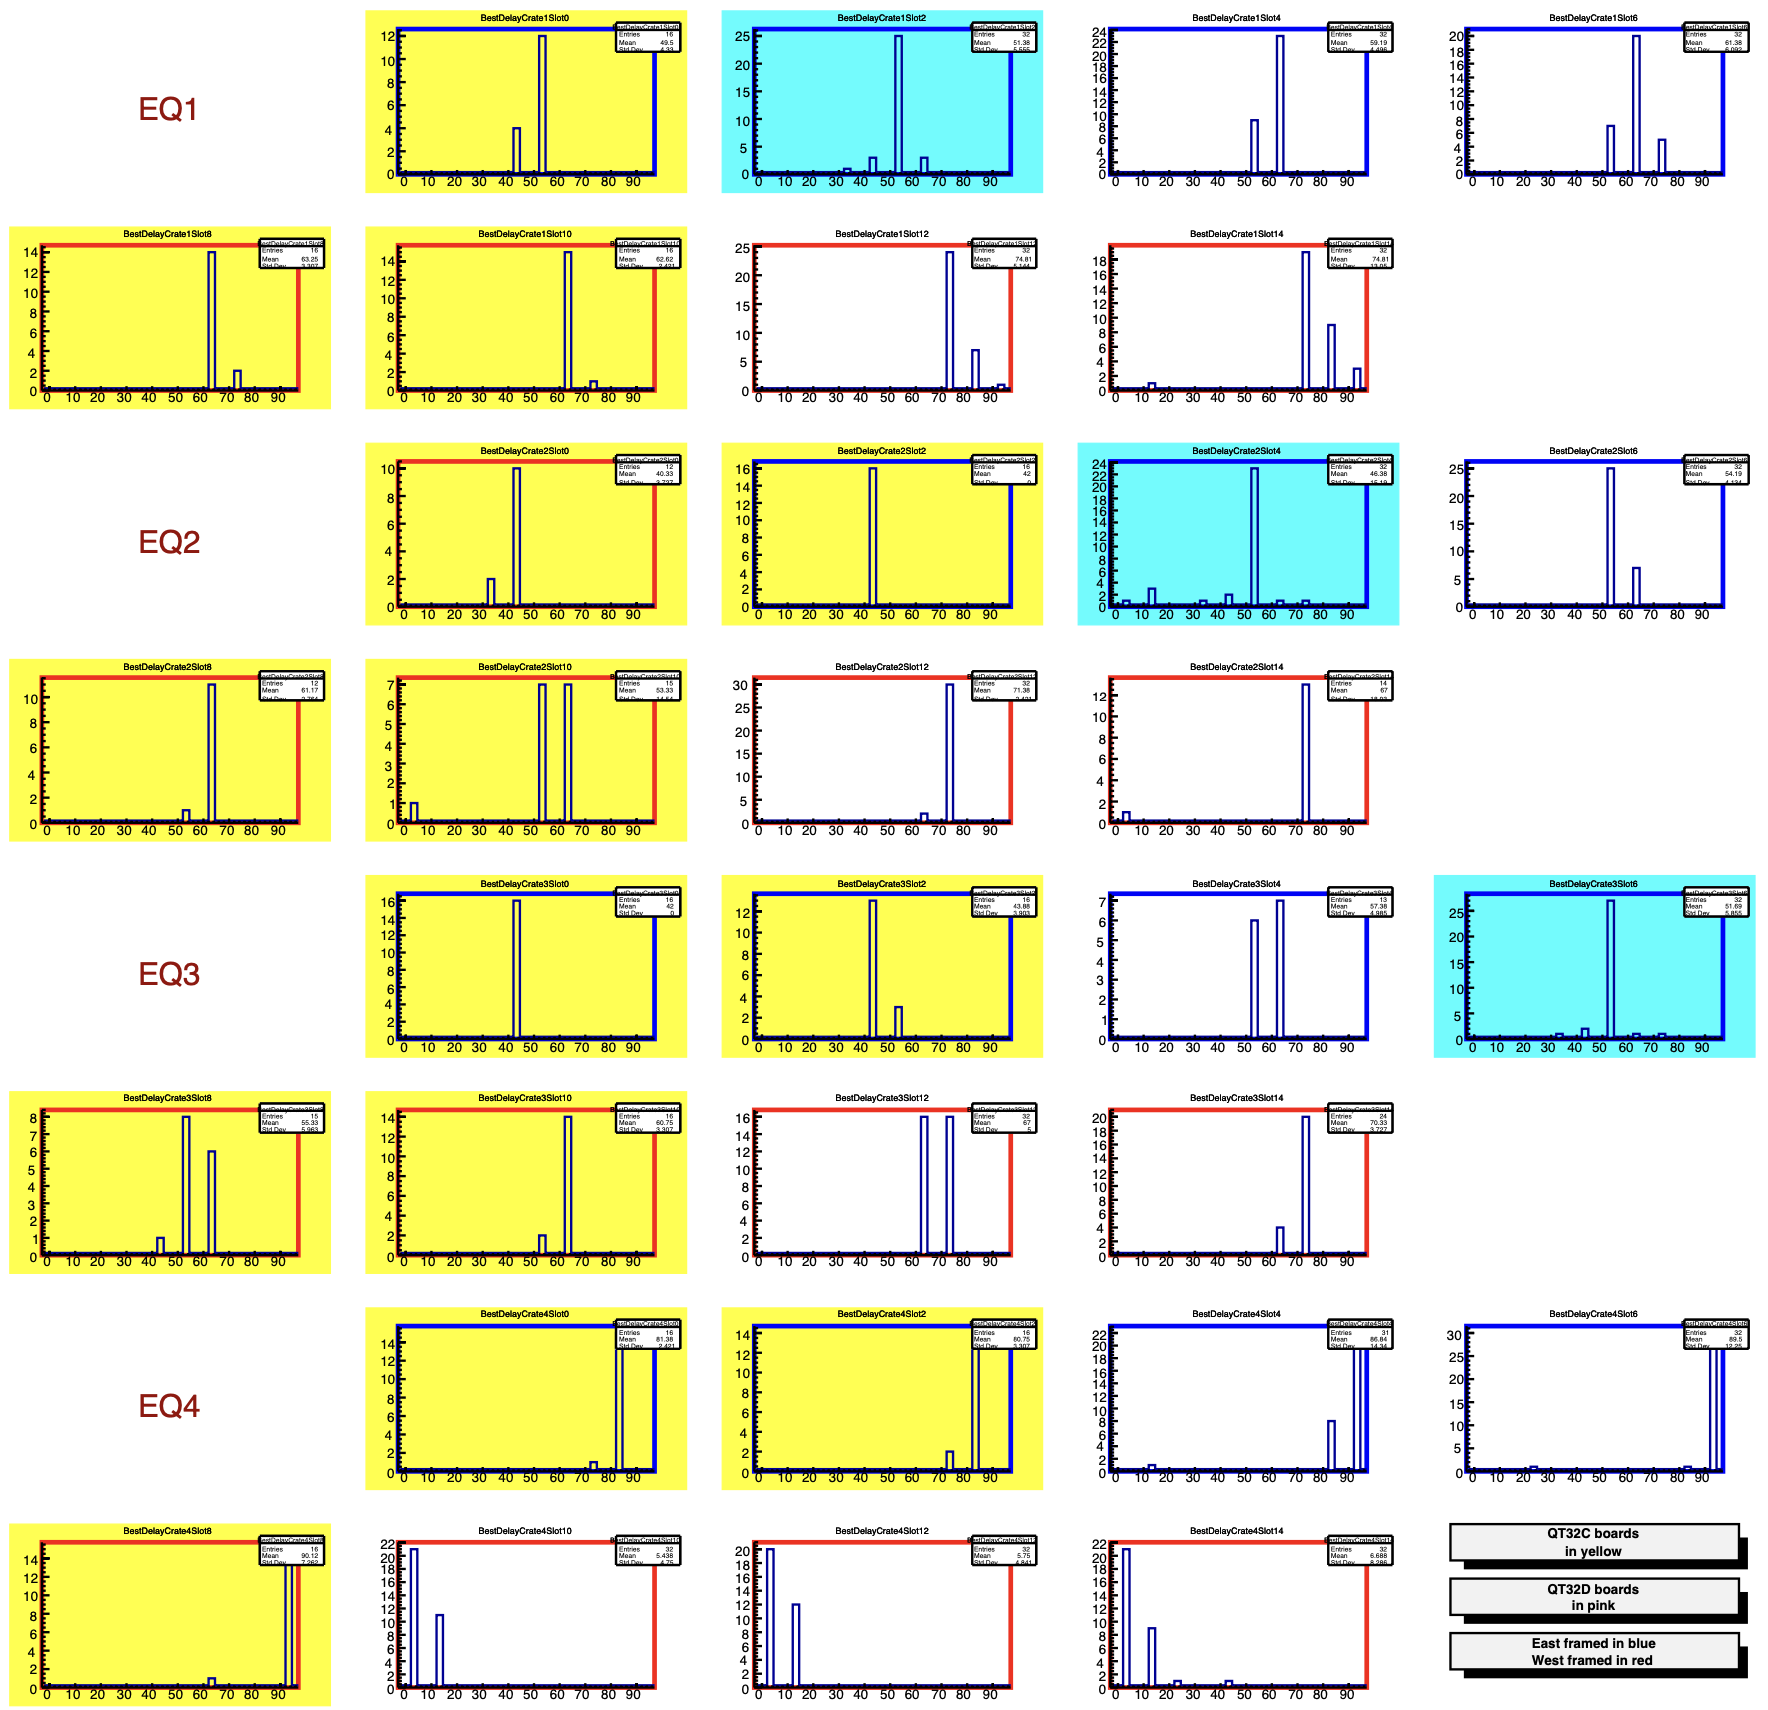
Here are the "optimum" timings for each slot in each crate, where each channel gets one "vote" in the histogram. Colors tell the category, according to the legend at the bottom right of the figure:
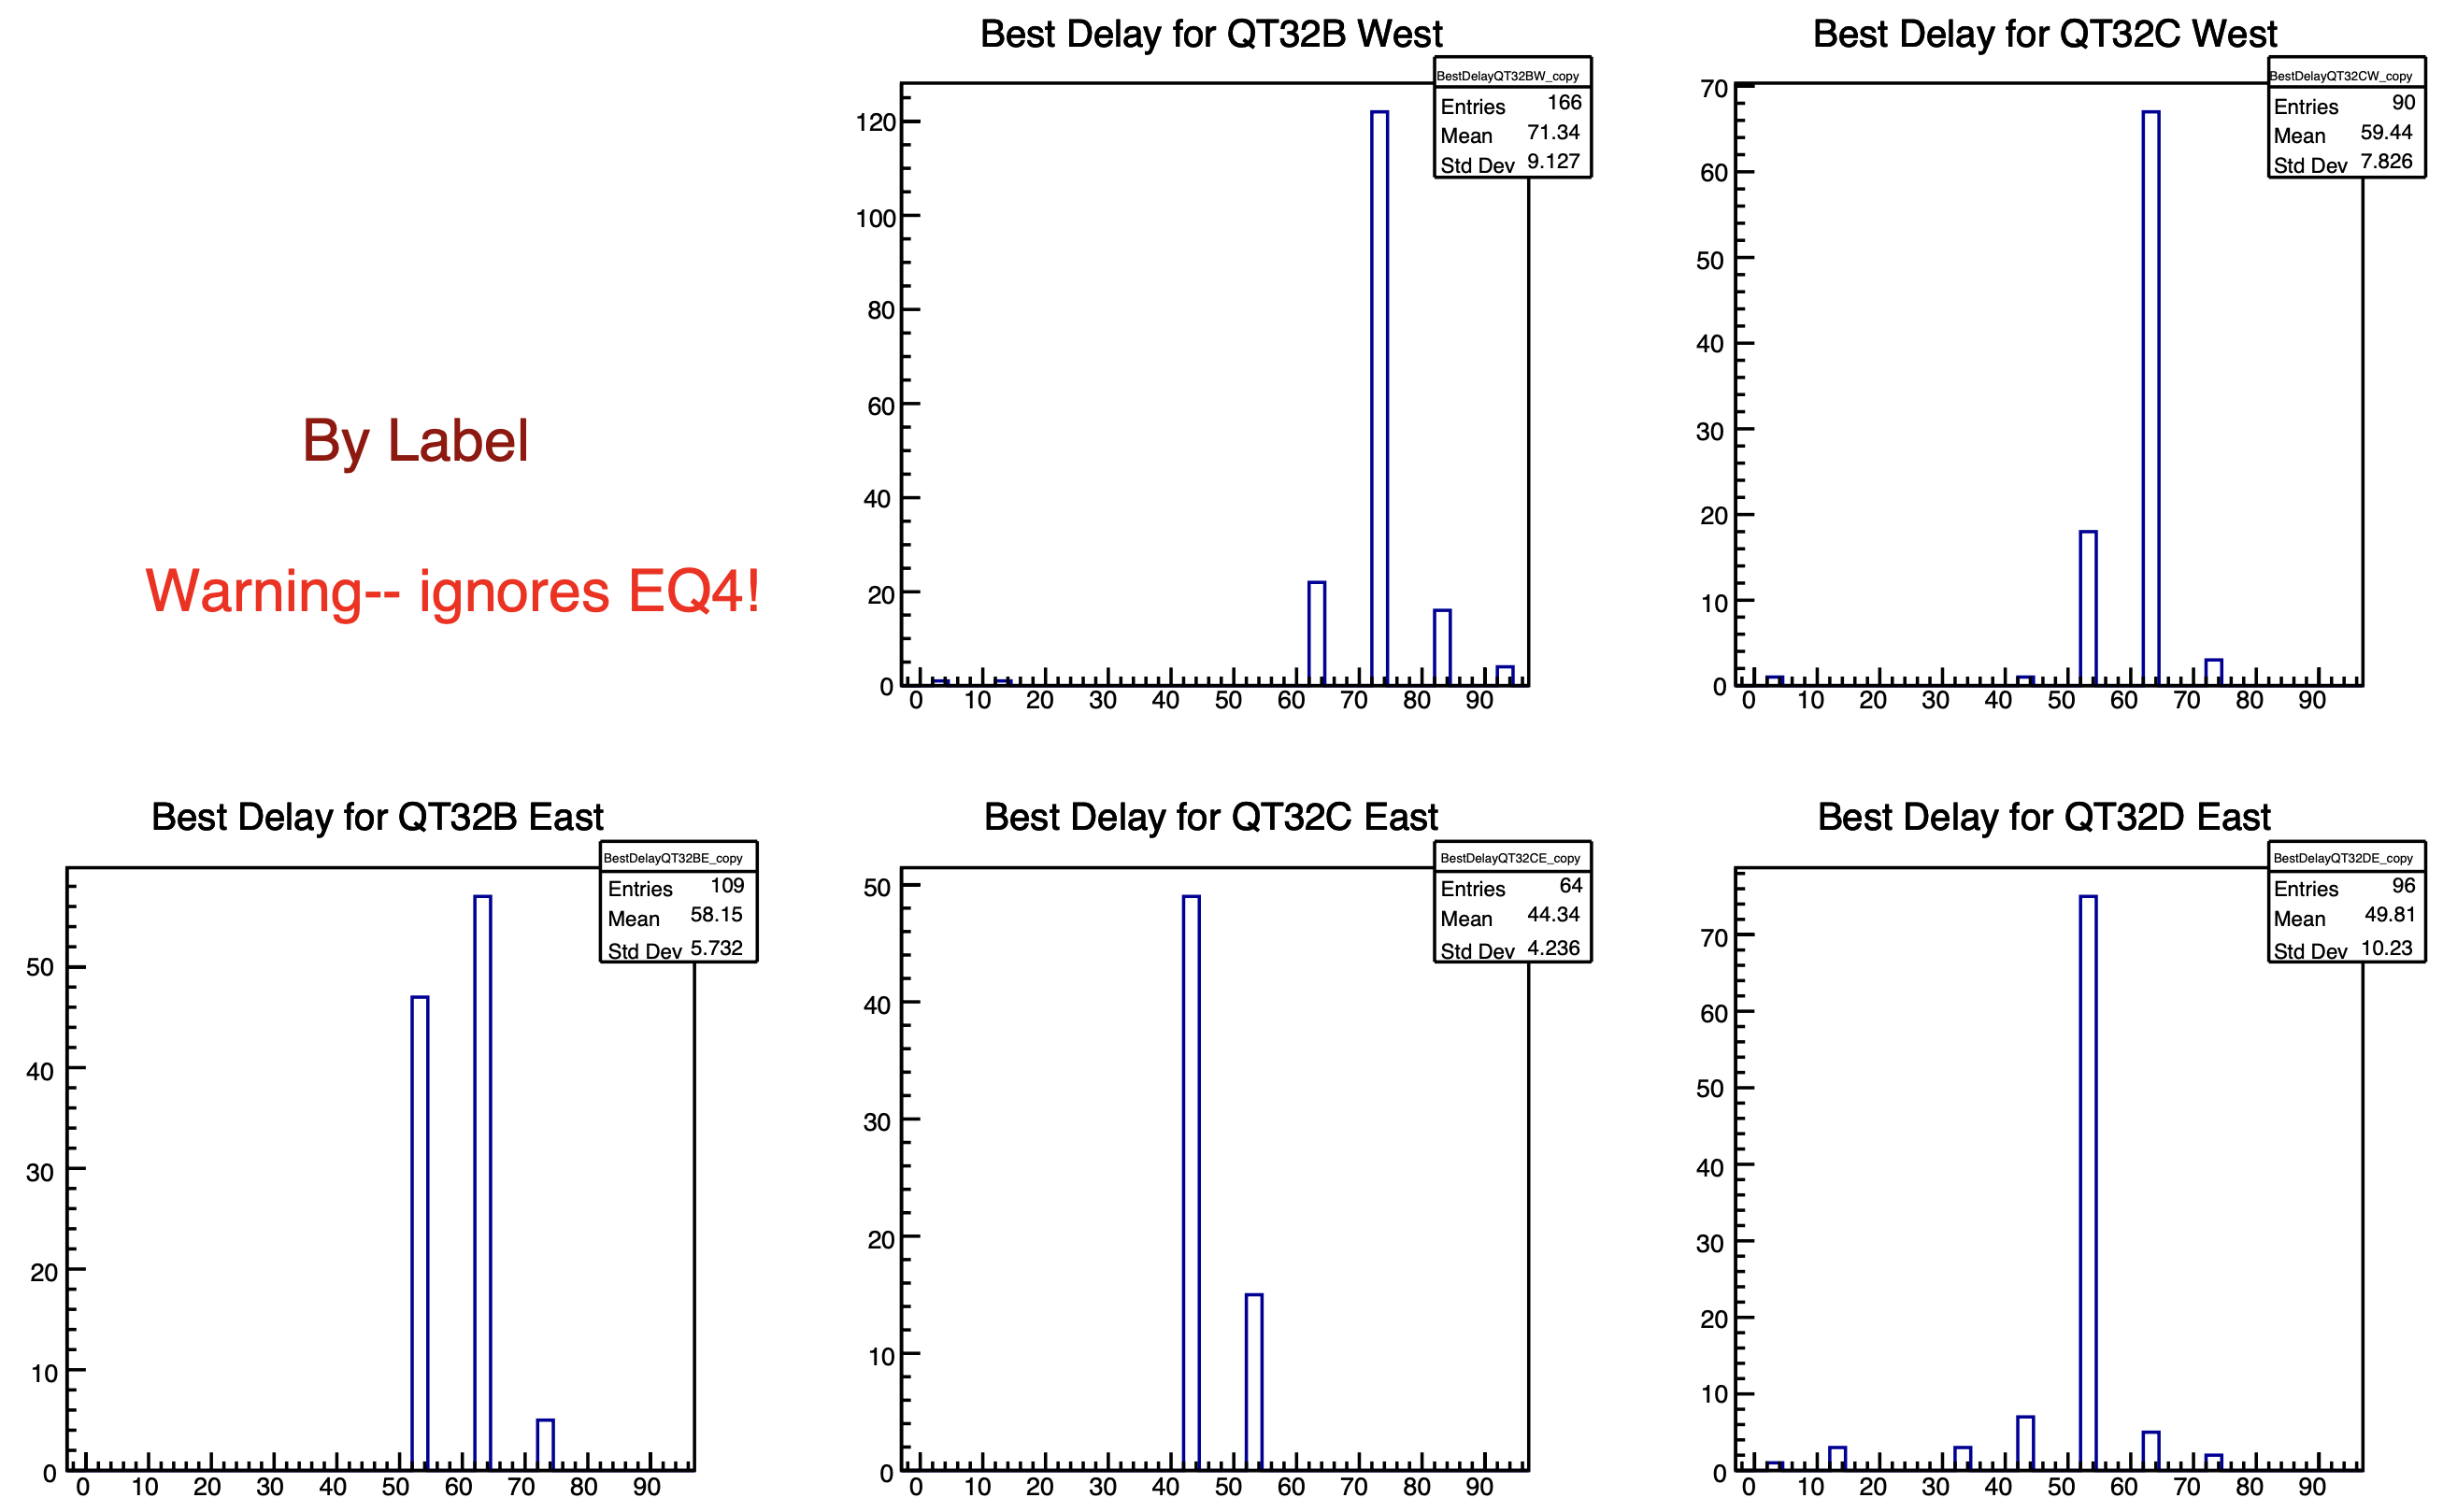
Now I group them together by category, still giving every channel one "vote." However, I only group together EQ1-3, because EQ4 is somehow different:
Notes about this plot above:
On 22 May 2023, we took the second timing scan.
Executive Summary:
Issues:- The first four channels of the QTDs are highly problematic. They show reasonable peaks, but only seem to record data at 10% the rate of all other channels. We have 3 QTDs in the EPD system, and they all show this. There is only one other QTD in STAR, and this shows the same thing, as Rosi noted.
- EQ4 needs its own timing labels. This is strange and has not been seen in previous years. But the optimum timing for the EQBs and EQCs (East and West) in EQ4 are different than EQ1,2,3.
- EQ1-3
- East_QTB_Start_Delay = 55 / East_QTB_Stop_Delay = 71
- East_QTC_Start_Delay = 40 / East_QTC_Stop_Delay = 56
- East_QTD_Start_Delay = 73 / East_QTD_Stop_Delay = 59 (The plot for this is confusing. see below)
- West_QTB_Start_Delay = 72 / West_QTB_Stop_Delay = 88
- West_QTC_Start_Delay = 52 / West_QTC_Stop_Delay = 68
- EQ4
- East_QTB_Start_Delay = 92 / East_QTB_Stop_Delay = 108
- East_QTC_Start_Delay = 72 / East_QTC_Stop_Delay = 88
- West_QTB_Start_Delay = 2 / West_QTB_Stop_Delay = 18
- West_QTC_Start_Delay = 90 / West_QTC_Stop_Delay = 106
Some details
- all bias voltatges were set to VSet=60
- 11 runs were taken, 250K events each. Au200Au minbias. In these runs, the labels were:
- East_QTB_Start_Delay=East_QTC_Start_Delay=West_QTB_Start_Delay=West_QTC_Start_Delay=X.
- East_QTB_Stop_Delay=East_QTC_Stop_Delay=West_QTB_Stop_Delay=West_QTC_Stop_Delay=X+16
- East_QTD_Start_Delay=X+21.
- East_QTD_Stop_Delay=East_QTD_Start_Delay-14 (=X+7)
- X=2,12,22,32,42,52,62,72,82,92,102
- Caveat! Actually, the 11th run didn't happen before the beam died. We still have to do this one. For now, this analysis includes just the first 10 runs. The 11th is important, however, as EQ4 seems to want a timing in this region.
- In all the plots versus delay, X is on the x-axis. That means you can simply read the optimal delay from the graphs for the QTBs and QTCs, but for the QTDs, you need to find X that gives the largest signal, and then add 21. Sorry, I could have done that better.
- As always, the full details can be found in 843 pages of living color in the pdf attached below.
As before, the signal evolution with gate delay for all channels in a given "category" look very similar. (Category means EastQTB, EastQTC. WestQTB. WestQTC, EastQTD.) Except! Now EQ4 looks completely different than the rest.
Examples
Below is a QTB on the West, in EQ3:
And the same thing, in EQ4:
Now a QTC on the East side, from EQ3:
And the same from EQ4:
Here are the "optimum" timings for each slot in each crate, where each channel gets one "vote" in the histogram. Colors tell the category, according to the legend at the bottom right of the figure:
Now I group them together by category, still giving every channel one "vote." However, I only group together EQ1-3, because EQ4 is somehow different:
Notes about this plot above:
- As noted above, the first four channels of all three QTDs are not working well. Therefore, about 1/8 of the counts in the QTD plot above are probably junk.
- The "best" timing delay for QTD_East is not "52", due to the comments I made at the top. Rather, it is 52+21=73. Sorry for that confusion; dumb of me.
»
- lisa's blog
- Login or register to post comments