Is the BBC performing better than the EPD?!?
Updated on Tue, 2018-04-17 10:17. Originally created by lisa on 2018-04-16 08:48.
Update 17 April 2018: The BBC event planes initially reported were incorrect. I have posted below the correct ones from Gene's QA code. They are still massively nonflat with the same phase and conclusions of this page are not affected.
Executive summary:
There was early indication that the EPD event-plane resolution in the isobar run is about the same (perhaps worse) than that of the BBC.
However, the extreme anisotropy of the EP distributions due to BBC efficiency/gain leads to an apparent East-West correlation that is artificially high.
No firm statement can be made about the BBC resolution except that the initial estimate by the QA group is probably way, way too hign.
Details and Discussion:
As I have discussed in two previous blog entries (here and here), the correlation between the 2nd-order plane seen by East and West EPD wheels, quantified by:
Using the simple approximation
These numbers are okay, but what had worried me was a statement by Gene Van Buren, who said that similar numbers were being reported by the QA group for the BBC from minimum-bias events! Yikes! Why replace the BBC, if it performs as well as the EPD?
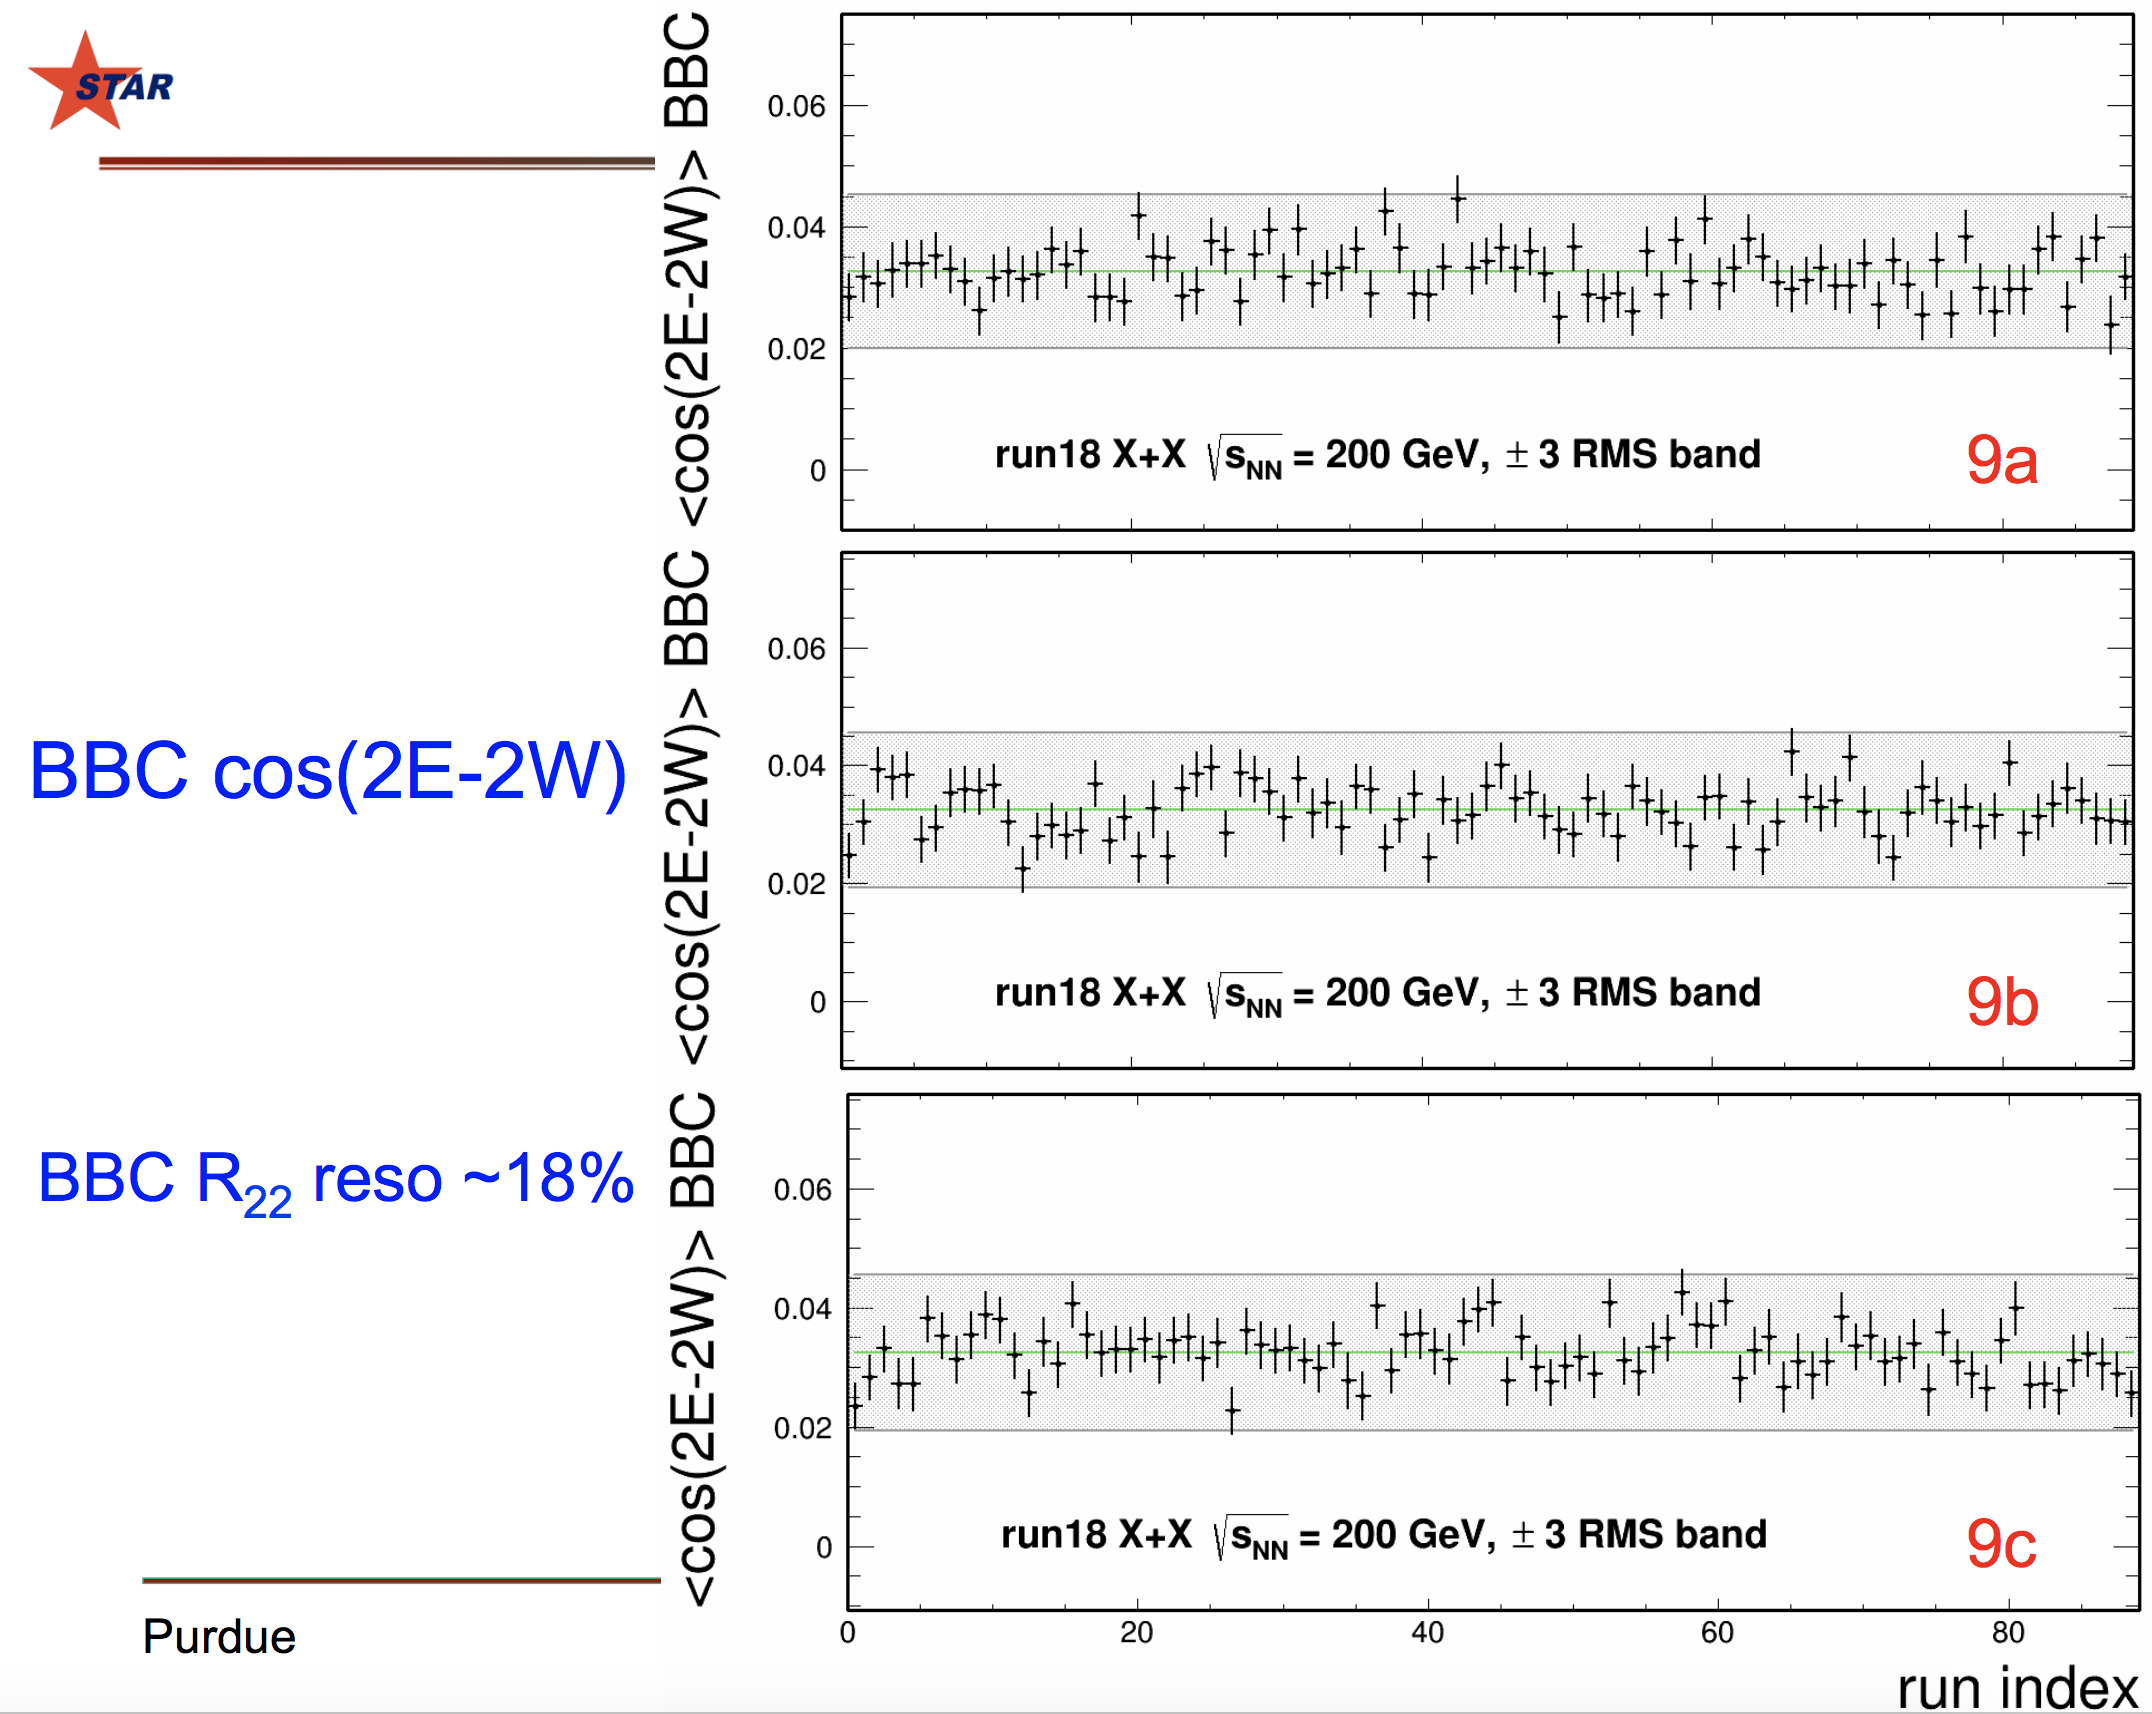
Gene sent me the following slide made by the QA code, of <cos(2E-2W)> as a function of run. (Don't worry about the details of panels a, b, c.)

Figure 1 - Slide from the QA group sent to me by Gene Van Buren. The correlation quantity <cos(2E-2W)> is plotted in a profile histogram as a function of run. Ignore difference between the various panels.
The BBC supposedly gets <cos(2E-2W)>=0.032 for minbias, compared to our 0.07 for mid-central. Why are we not doing much better?
Non-flat event planes:
To investigate this, I analyzed 1M events in picoDst format on my laptop (it takes about 8 wall-clock minutes). I see huge non-flatness of both the East and West event planes from the BBC. Importantly, the "phase" of these anisotropies line up, meaning that <cos(2E-2W)> will be much increased.
I see also a non-flatness (though MUCH less) for the EPD event-plane angles. However, the "phase" of these anisotropies will mean that <cos(2E-2W)> will be artificially DEcreased.

Figure 2: Event planes for 100<RefMult<240 from the 200 GeV isobar run. Top panels are for EPD. Bottom are BBC (BBC plots above are wrong. see update below). Left: Psi_2 for West side versus East Side. Middle: EP distribution for East side. Right: EP distribution for West side.
Update 17 April 2018: Thanks to Joey for asking about how the one-tube-two-tile nightmare was handled in the BBC event plane determination above. It turns out that I had screwed that up. Rather than erase the plots we had discussed, I here below show the planes as they are (correctly) calculated by Gene's QA code. The conclusions of this study are unchanged.

Figure 3: BBC event plane calculated by Gene's QA code. In my original post (bottom panels of Figure 2 on this page), I had screwed up the BBC-phototube-to-tile-to-angle mapping. Figure 3 replaces the bottom panels of Figure 2.
Conclusions and next steps:


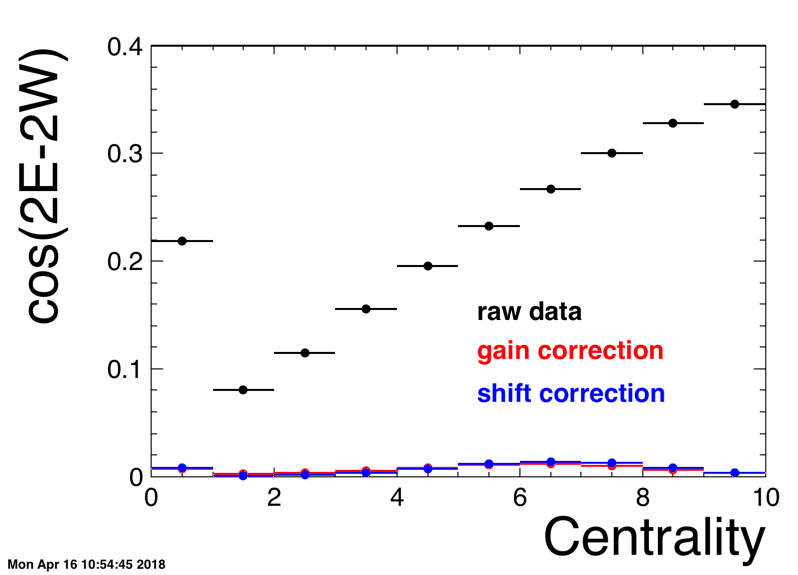
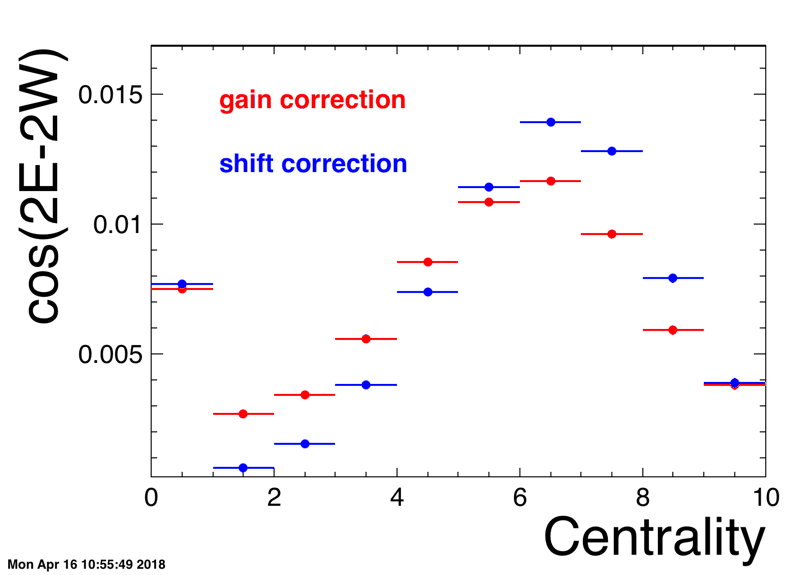
Figures 3 and 4: The effects of "gain correction" and "shift correction" on the correlation measure <cos(2E-2W)>, as a function of centrality for Au+Au collisions at 200 GeV. (Figure 4 is a blow-up of figure 3.) Clearly the gain correction dominates. Calculation and plots from Jie Zhao (Purdue).
Executive summary:
There was early indication that the EPD event-plane resolution in the isobar run is about the same (perhaps worse) than that of the BBC.
However, the extreme anisotropy of the EP distributions due to BBC efficiency/gain leads to an apparent East-West correlation that is artificially high.
No firm statement can be made about the BBC resolution except that the initial estimate by the QA group is probably way, way too hign.
Details and Discussion:
As I have discussed in two previous blog entries (here and here), the correlation between the 2nd-order plane seen by East and West EPD wheels, quantified by:
<cos(2E-2W)>
is about 0.07 for mid-central (100<RefMult<240) collisions in the 200 GeV isobar run.Using the simple approximation
R[full] = sqrt(2<cos(2E-2W)>)
this corresponds to a full-event EP resolution of about 38%, or a single-side EP resolution of
R[one-side] = sqrt(<cos(2E-2W)>) = 26%
These numbers are okay, but what had worried me was a statement by Gene Van Buren, who said that similar numbers were being reported by the QA group for the BBC from minimum-bias events! Yikes! Why replace the BBC, if it performs as well as the EPD?
Gene sent me the following slide made by the QA code, of <cos(2E-2W)> as a function of run. (Don't worry about the details of panels a, b, c.)

Figure 1 - Slide from the QA group sent to me by Gene Van Buren. The correlation quantity <cos(2E-2W)> is plotted in a profile histogram as a function of run. Ignore difference between the various panels.
The BBC supposedly gets <cos(2E-2W)>=0.032 for minbias, compared to our 0.07 for mid-central. Why are we not doing much better?
Non-flat event planes:
To investigate this, I analyzed 1M events in picoDst format on my laptop (it takes about 8 wall-clock minutes). I see huge non-flatness of both the East and West event planes from the BBC. Importantly, the "phase" of these anisotropies line up, meaning that <cos(2E-2W)> will be much increased.
I see also a non-flatness (though MUCH less) for the EPD event-plane angles. However, the "phase" of these anisotropies will mean that <cos(2E-2W)> will be artificially DEcreased.

Figure 2: Event planes for 100<RefMult<240 from the 200 GeV isobar run. Top panels are for EPD. Bottom are BBC (BBC plots above are wrong. see update below). Left: Psi_2 for West side versus East Side. Middle: EP distribution for East side. Right: EP distribution for West side.
Update 17 April 2018: Thanks to Joey for asking about how the one-tube-two-tile nightmare was handled in the BBC event plane determination above. It turns out that I had screwed that up. Rather than erase the plots we had discussed, I here below show the planes as they are (correctly) calculated by Gene's QA code. The conclusions of this study are unchanged.

Figure 3: BBC event plane calculated by Gene's QA code. In my original post (bottom panels of Figure 2 on this page), I had screwed up the BBC-phototube-to-tile-to-angle mapping. Figure 3 replaces the bottom panels of Figure 2.
Conclusions and next steps:
- Until the BBC EP distributions are flattened, no conclusion can be drawn about the BBC EP resolution. It will almost certainly be reduced from current estimates, however. For the EPD, flattening should change the estimates only a little, and will probably lead to an increased (i.e. "better") resolution estimate.
- The QA group is providing to Gene some code to do gain corrections for the BBC. Apparently this makes most of the difference, as shown by the plot below. I must admit that this surprises me. I thought Akio had done at least rough gain-matching in hardware.
- I will provide to Gene some code for <cos(2E-2W)> for the EPD. At least for starters, I won't worry about flattening.
- I will ask Gene and the QA group to include some measure of EP flatness run-by-run, since it is so important for estimating EP resolution.


Figures 3 and 4: The effects of "gain correction" and "shift correction" on the correlation measure <cos(2E-2W)>, as a function of centrality for Au+Au collisions at 200 GeV. (Figure 4 is a blow-up of figure 3.) Clearly the gain correction dominates. Calculation and plots from Jie Zhao (Purdue).
»
- lisa's blog
- Login or register to post comments
