The EPD Fast Simulator
Updated on Fri, 2020-04-10 21:35. Originally created by lisa on 2020-03-31 18:41.
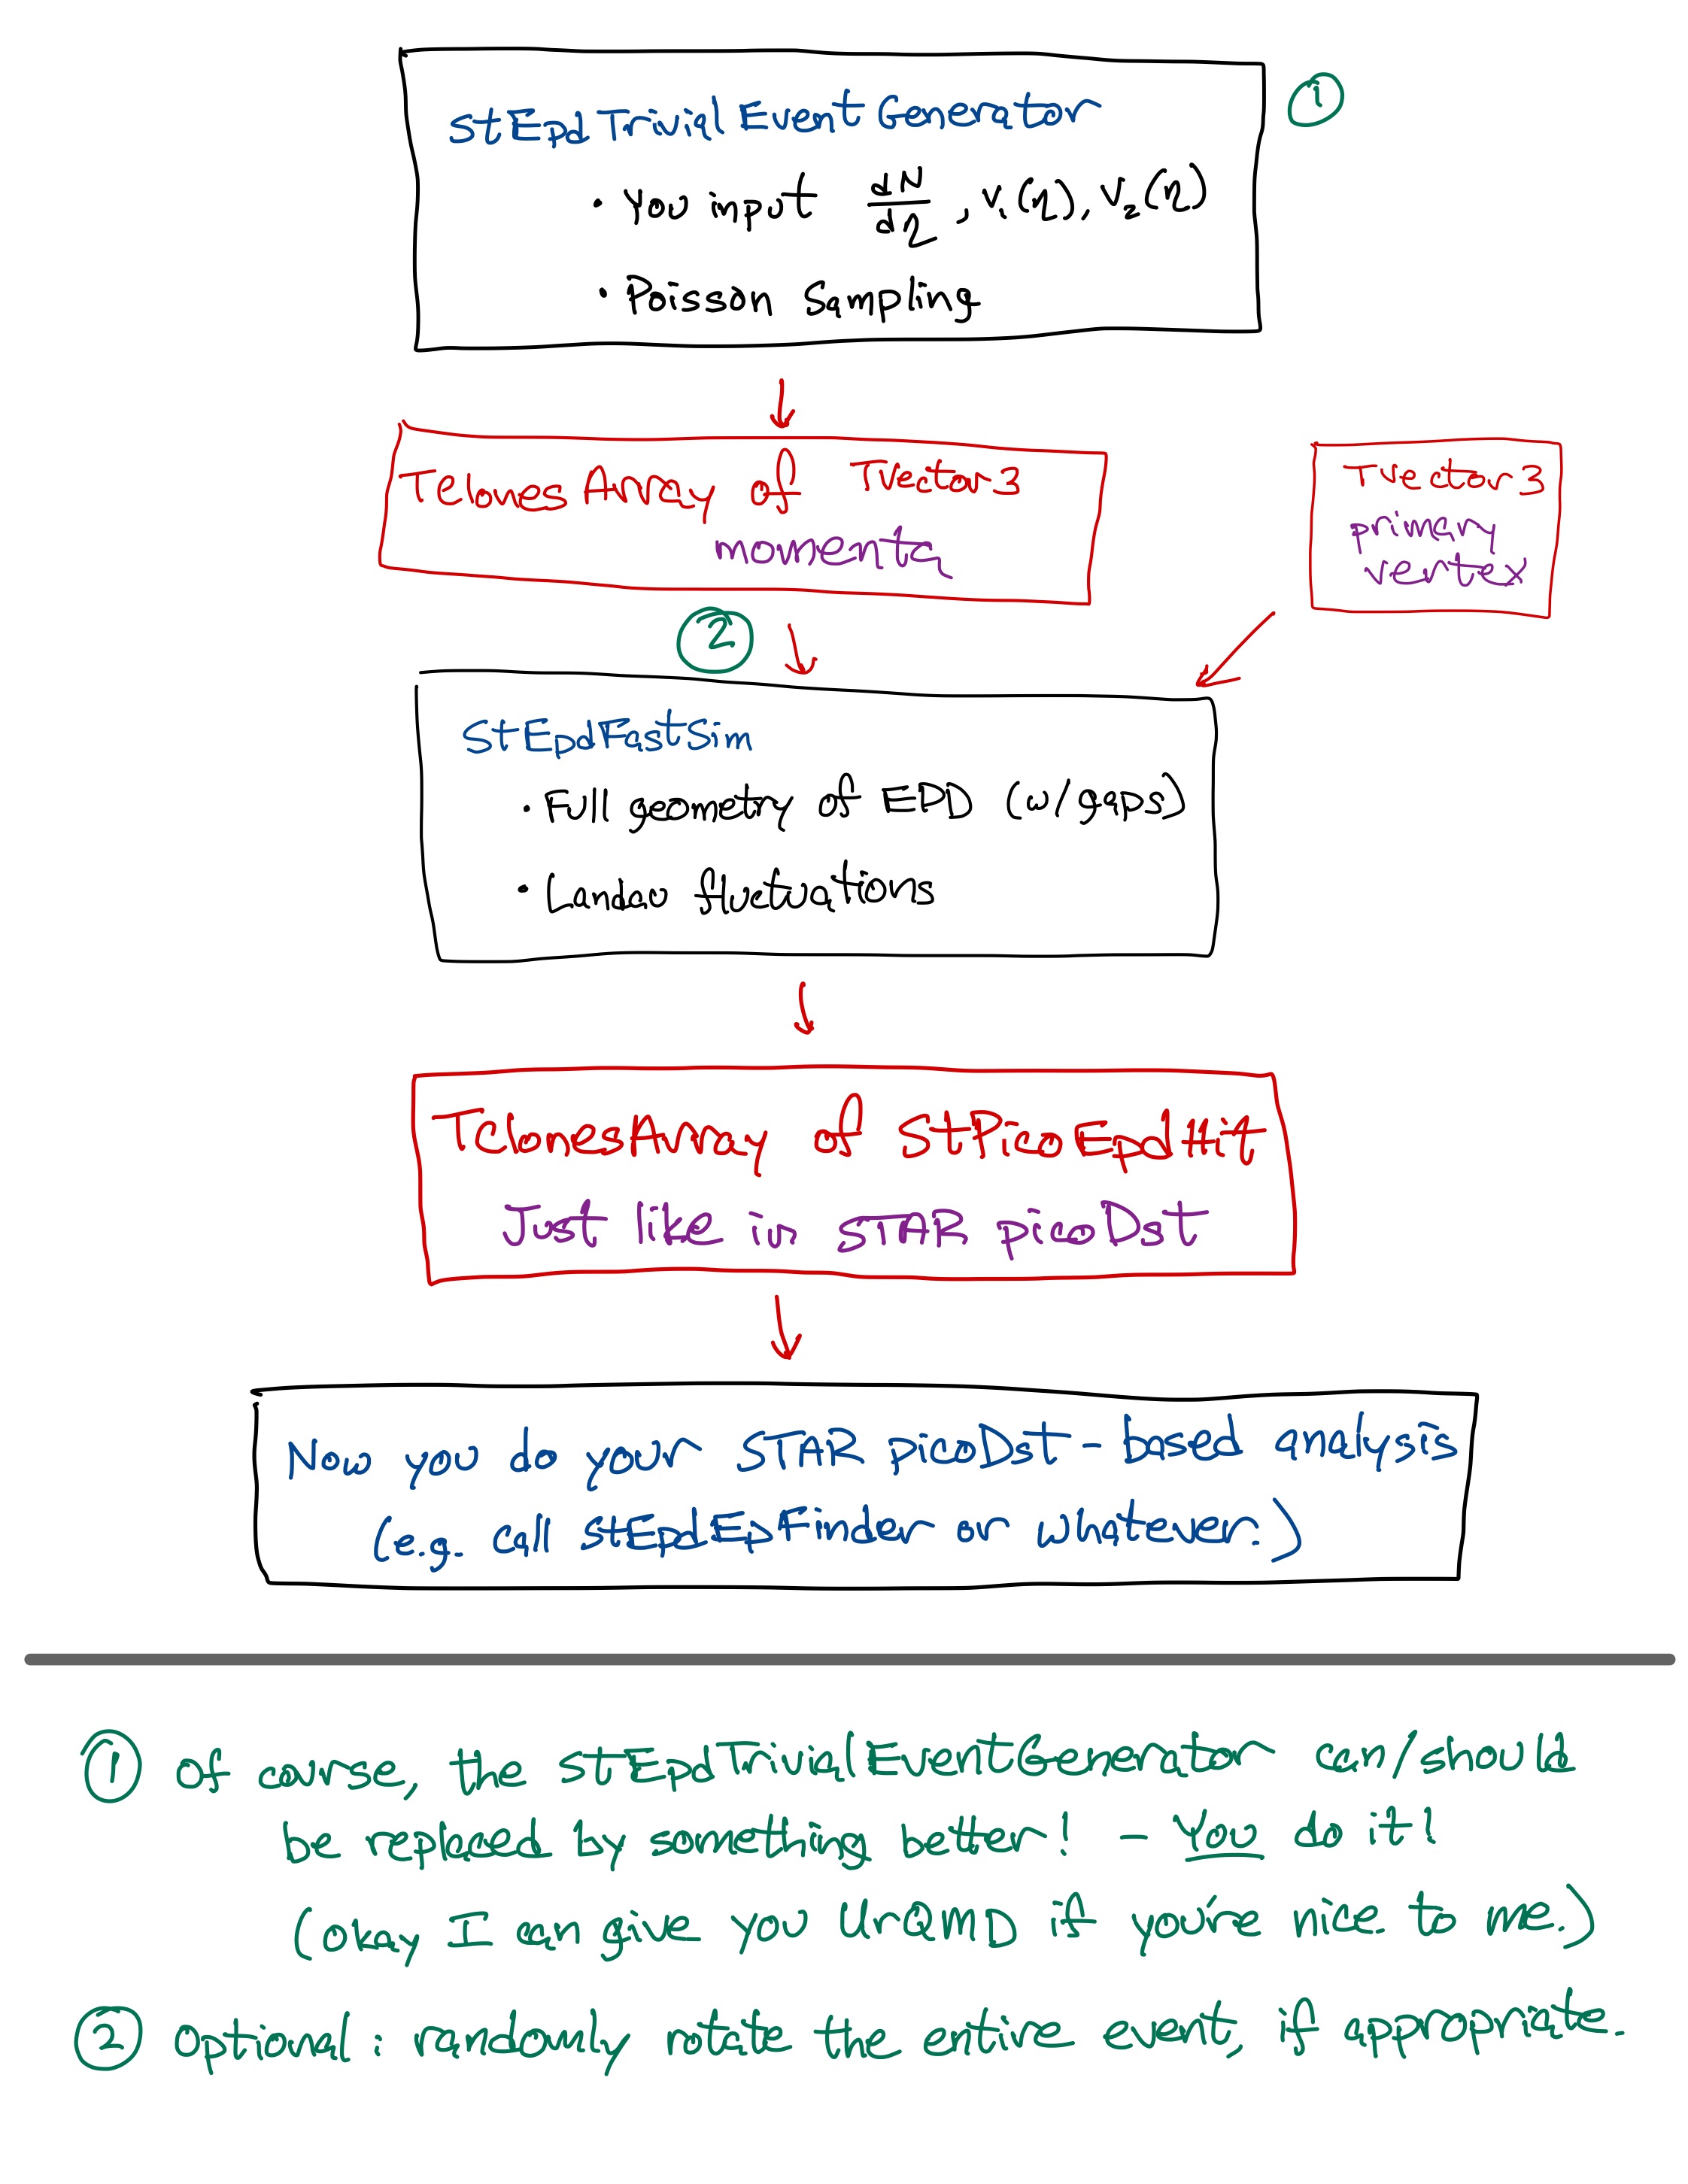
Figure 1: A sketch of the simulation flow.
You will also find a macro, RunSimulator.C, that runs the above. It should be self-explanatory.
You can run it at RCF, but I like to run it on my laptop. To use it on your laptop:
Xiaoyu spun over a few STAR picoDsts for 27 GeV Au+Au collisions with 10-40% centrality, and made nMIP distributions for each of the 16 rings of the EPD. All 24 tiles (12 in the case of ring 1) contribute to the nMIP spectrum.
I inputted the dN/deta distribution measured by PHOBOS at 19.6 GeV (get the paper here and their data here) into the StEpdTrivialEventGenerator and then into the StEpdFastSim. You can compare the measured and simulated nMIP spectra. The STAR data is compared to the PHOBOS+FastSim results, using various collision centralities reported by PHOBOS. The match is never perfect: the inner rings are better described by some centralities, and the outer by others. This can be due to several reasons.
For this study, WID/MPV (the only parameter in the FastSim) is set to 0.15, and the primary vertex was set to (0,0,0). The macro to run this study is attached to this page, or click here.
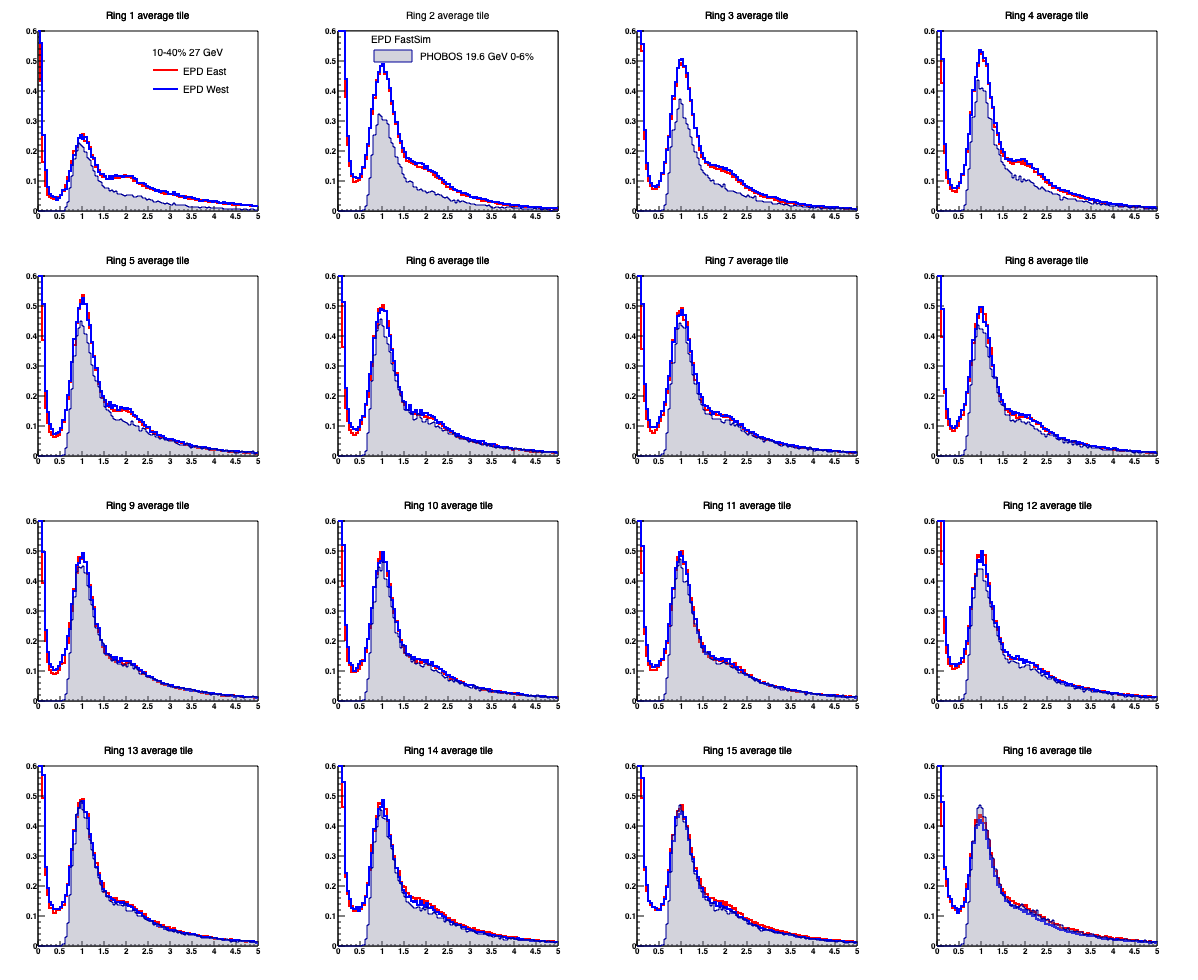
Figure 2: nMIP spectra for the 16 rings measured for Au+Au collisions at 27 GeV, 10-40% central. Red and blue histograms (nearly overlapping) are for the East and West wheels, respectively. Grey filled spectrum is from the simulator. Note that no special normalization is done. Only a division by the total number of events.
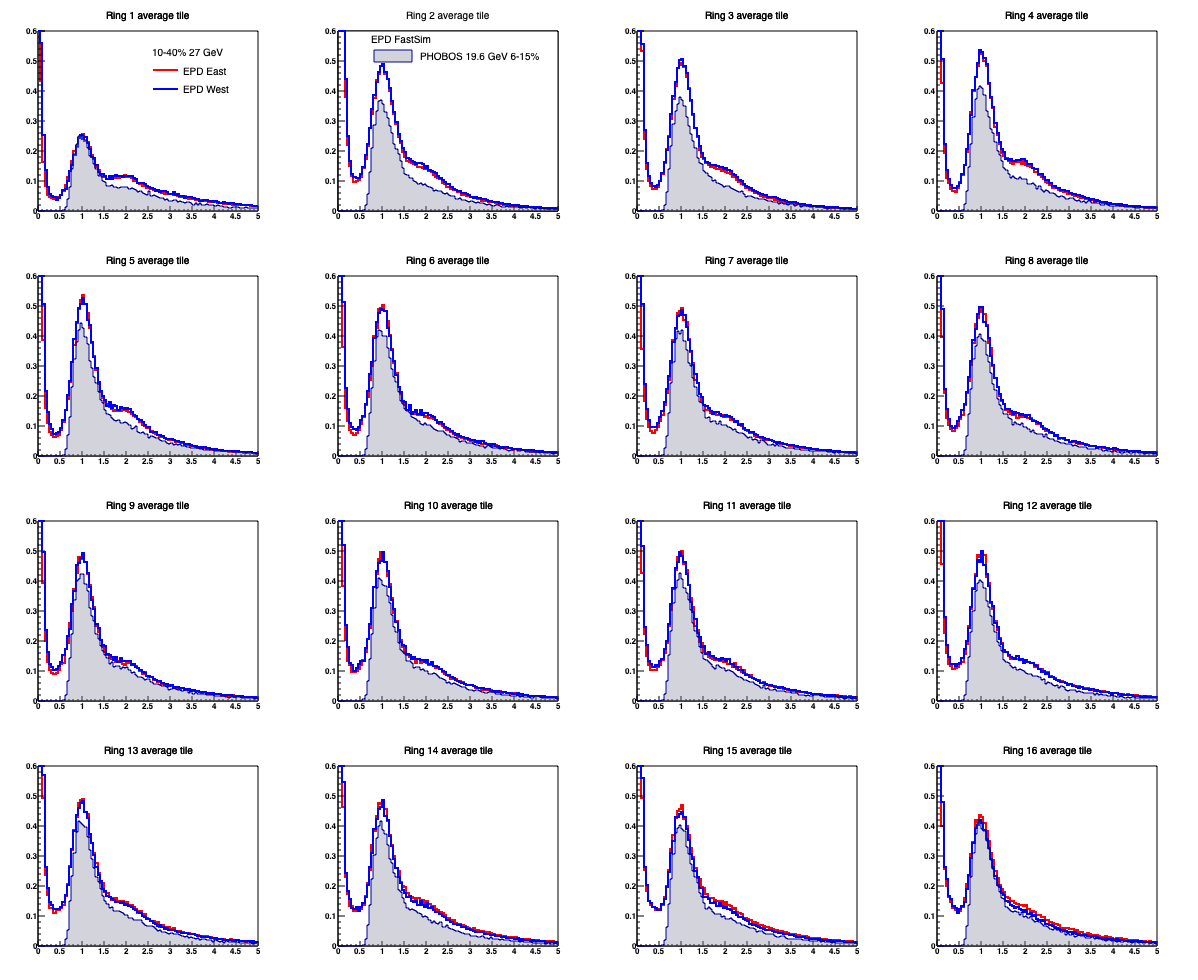
Figure 3: Same as figure 2, but compared to PHOBOS 6-15% centrality.
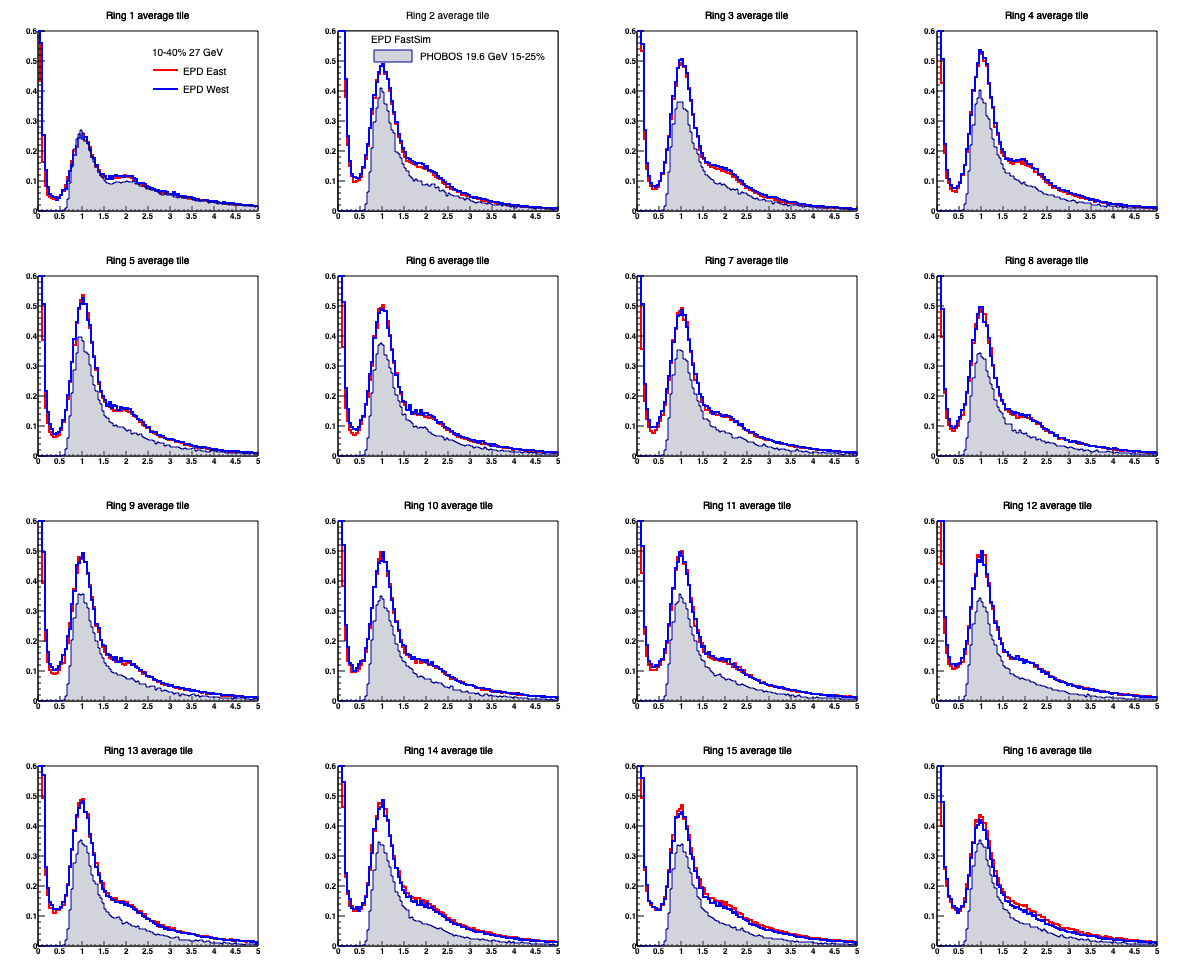
Figure 4: Same as figure 2, but compared to PHOBOS 15-25% centrality.
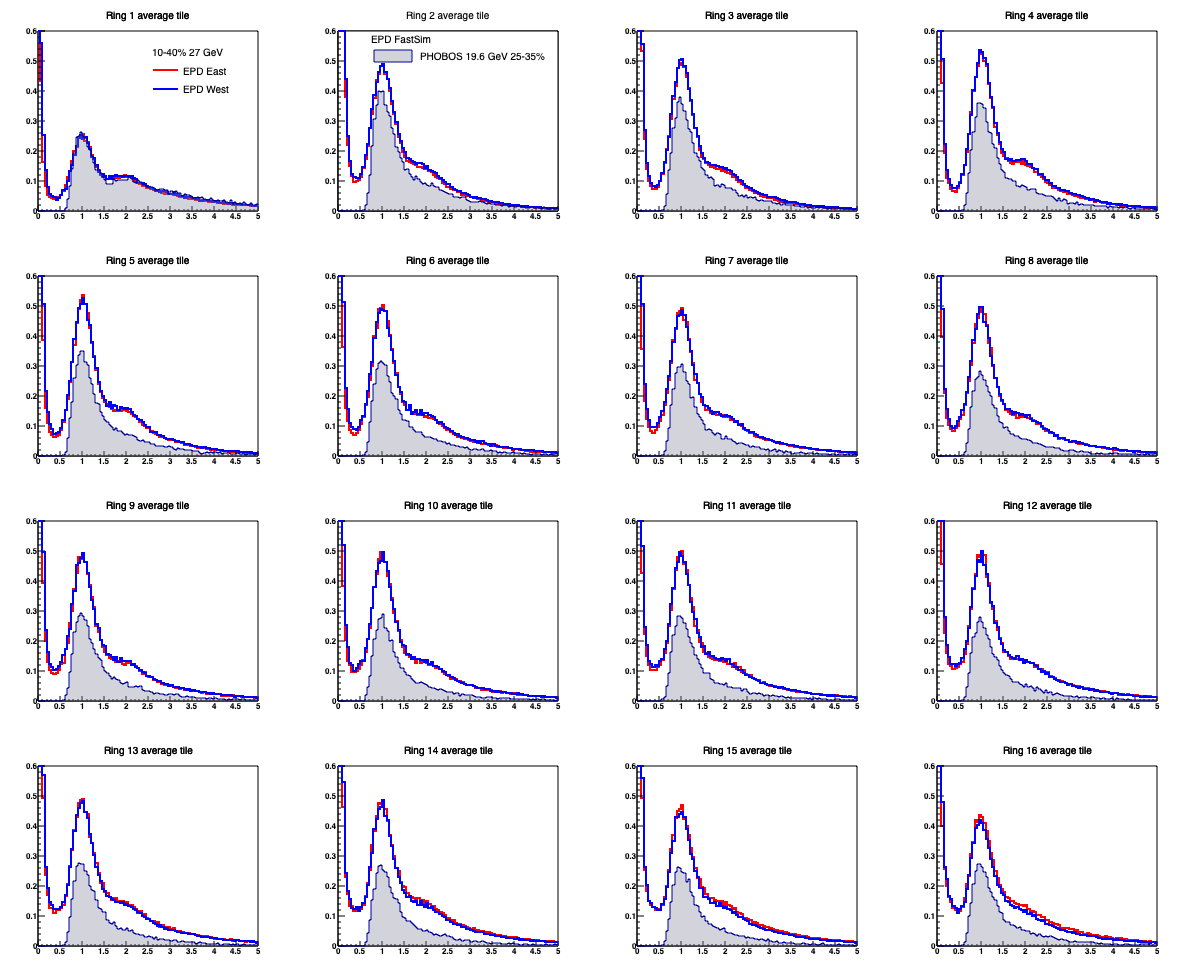
Figure 5: Same as figure 2, but compared to PHOBOS 25-35% centrality.
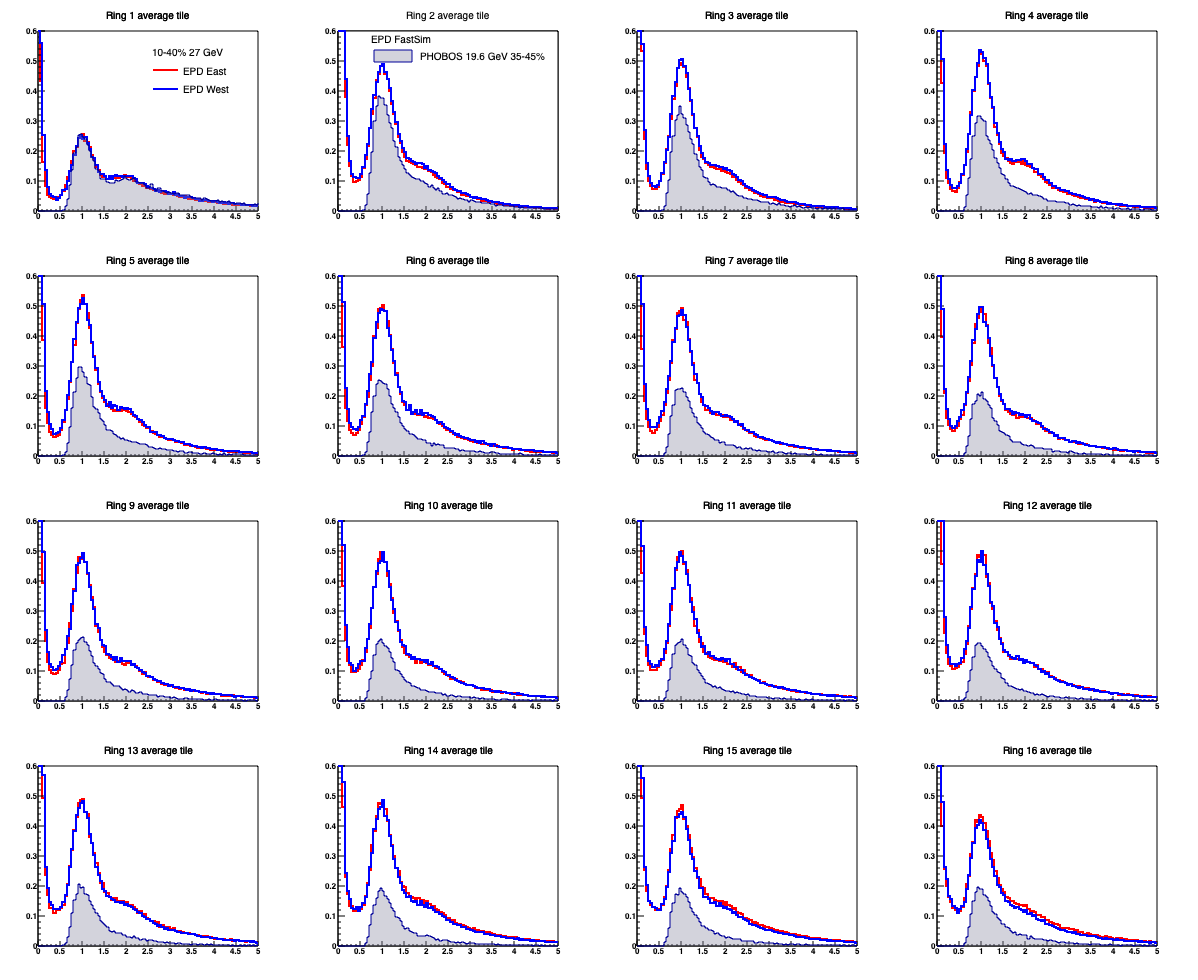
Figure 6: Same as figure 2, but compared to PHOBOS 35-45% centrality.
In the above study, the primary vertex was fixed to (0,0,0) (center of STAR). But as we know, a given tile (say tile 04) corresponds to a different eta range, for different primary vertex position.
It is easy to simply sample the measured primary vertex distribution, which I show below, for the STAR 27 GeV data shown above. It's pretty flat with +/- 40 cm. I have attached the macro to do this at the bottom of the page, or click here.
.png)
Figure 7. The primary vertex distribution in the STAR Au+Au 27 GeV data that was used to make the ring nMIP distributions.
Below I show the nMIP spectra when the above vertex distribution is used. It should be compared to figure 6, for which (0,0,0) is used.
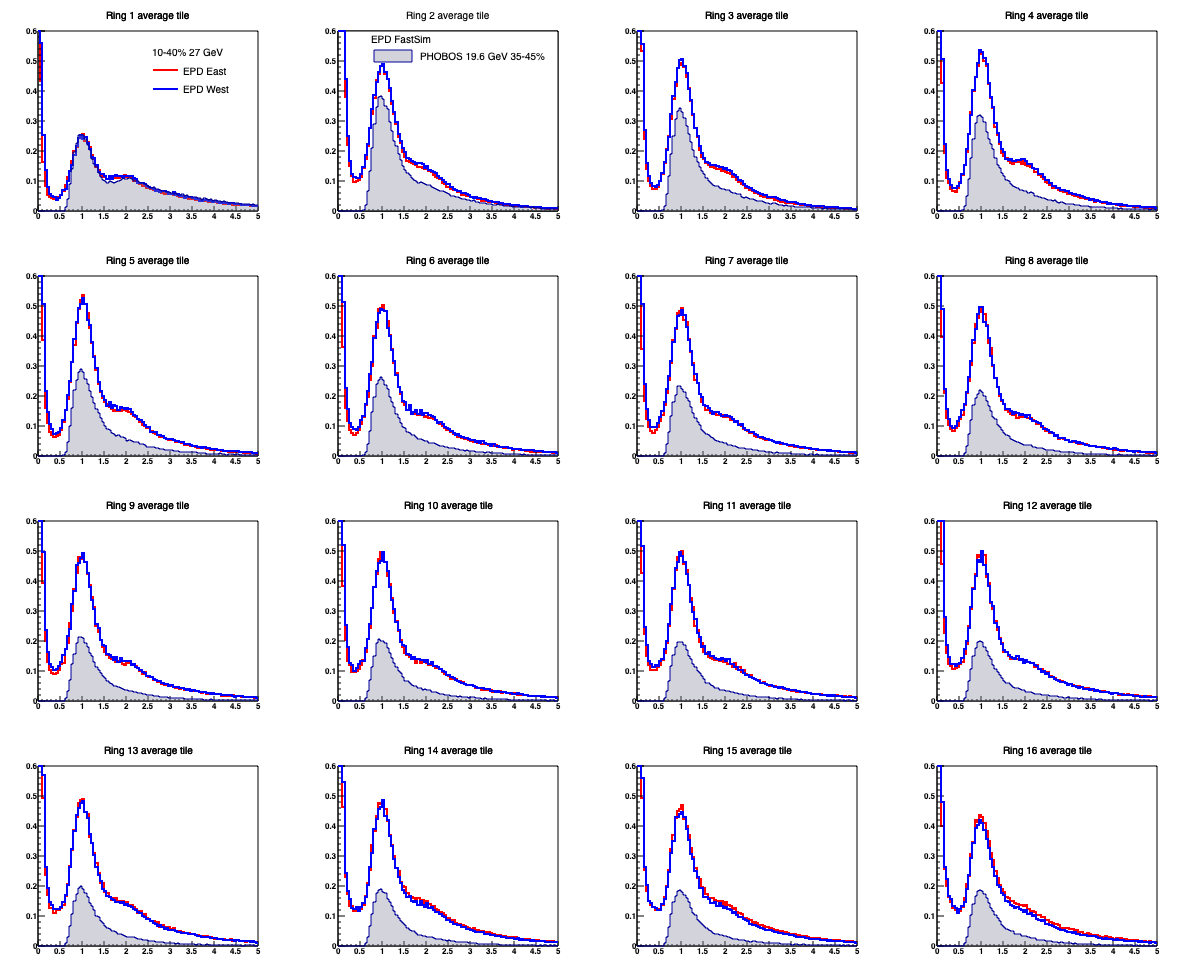
Figure 8. This is the same thing as in figure 6, except in figure 6, Vz==0 and here, the distribution shown in figure 7 is used.
So, we see that reasonable/typical Vz distributions produce essentially identical. In the next plot I put the Vz=3 meters (note z_EPD = 3.75 meters), simply to show that if the difference from (0,0,0) is large enough, it does matter.
.png)
Figure 9. This is the same thing as in figures 6 and 7, except a very extreme Vz=3 meters is assumed here.
Conclusion: While primary vertex position does in principle matter and the FastSim shows this, reasonable fluctuations in z-vertex don't affect things much.
Next up: tweaking dN/deta until the nMIP distributions are matched for all rings. See this page.
Summary:
- A "fast simulator" for the EPD has been written, which takes event generator input, and produces StPicoEpdHits, exactly like you find in STAR picoDsts. So, you can simulate your full analysis chain.
- While we wait for a full GSTAR-based simulation, this will serve us well. It might even be all we actually need at the end, anyway.
- When convoluted with dN/deta from 19.6 GeV data from PHOBOS, the nMIP (calibrated ADC) spectra resemble STAR's results at 27 GeV.
- A distribution of primary vertex positions can be used. For typical distributions (say |Vz|<40 cm), the results are very similar to simply assuming vertex = (0,0,0).
Introduction:
I have written a “Fast Simulator” for the EPD which is not complete (e.g. it does not include scattering through material that sits between the collision vertex and the detector, and also neglects magnetic field) but which is also not a complete joke. It takes a list (TClonesArray) of charged-particle momenta (TVector3), and it outputs data in the exact format (TClonesArray of StPicoEpdHit objects) that is found in the STAR picoDsts. Therefore, the simulated data can be put through the same analysis software as you are using for real data.
The code is in the StRoot/StEpdUtil/StEpdFastSim/ directory in CVS. You will find two classes:
- Input: User defines dN/deta, v1(eta), v2(eta), using TH1D
- Output: TClonesArray of TVector3, which are just the momenta of charged particles.
- This trivial event generator simply does Poisson sampling of dN/deta and samples according to v1 and v2.
- You can use something like UrQMD instead. I have a macro that does this, if you like.
- Input: The TClonesArray of TVector3 mentioned just above. Also, a TVector3 specifying the primary vertex.
- Output: TClonesArray of StPicoEpdHit objects, just like you find in the STAR picoDsts.
- This simulator has the full geometry of the EPD, including gaps. It includes Landau energy loss fluctuations. It accounts for a variable primary vertex position.
Figure 1: A sketch of the simulation flow.
You will also find a macro, RunSimulator.C, that runs the above. It should be self-explanatory.
You can run it at RCF, but I like to run it on my laptop. To use it on your laptop:
- In a clean directory on RCF, ‘cvs co StRoot/StEpdUtil’ then ‘cvs co StRoot/StPicoEvent’
- Transfer all files in that directory to your laptop.
- Follow the instructions at the beginning of StRoot/StEpdUtil/StEpdFastSim/RunSimulator.C
A semi-realistic study
Xiaoyu spun over a few STAR picoDsts for 27 GeV Au+Au collisions with 10-40% centrality, and made nMIP distributions for each of the 16 rings of the EPD. All 24 tiles (12 in the case of ring 1) contribute to the nMIP spectrum.
I inputted the dN/deta distribution measured by PHOBOS at 19.6 GeV (get the paper here and their data here) into the StEpdTrivialEventGenerator and then into the StEpdFastSim. You can compare the measured and simulated nMIP spectra. The STAR data is compared to the PHOBOS+FastSim results, using various collision centralities reported by PHOBOS. The match is never perfect: the inner rings are better described by some centralities, and the outer by others. This can be due to several reasons.
- PHOBOS data are 19.6 GeV, and the STAR data are 27 GeV. Obviously a little different shape and magnitude for the eta distribution, especially right near beam rapidity. If STAR ever produces the 19.6 GeV data, another comparison will be very interesting. We have been waiting for that production for more than a year, and maybe we have to wait another year, though.
- Effects of material between the collision and the EPD are not taken into account. A proper job of this needs to wait for GSTAR-based Geant simulation. This seems particularly difficult. We have been waiting for this for several (3?) years, and if we wait another couple of years, then there is no point to pursue it further, as STAR will be winding down. For this reason, I will probably work to include material effects in the FastSim.
- Magnetic field effects are ignored. This is almost certainly a negligible effect, but it can have the effect of "making the apparent dNdeta distribution more forward-peaked than it really is." Xinyue did some nice quantitative studies of this when he was at OSU, and they can be repeated, but I think this is super-small.
- Primary vertex fluctuations are ignored in figures 2-6. (V=(0,0,0) is assumed.) However, in the next section, I show that it is unimportant in this case.
For this study, WID/MPV (the only parameter in the FastSim) is set to 0.15, and the primary vertex was set to (0,0,0). The macro to run this study is attached to this page, or click here.
Figure 2: nMIP spectra for the 16 rings measured for Au+Au collisions at 27 GeV, 10-40% central. Red and blue histograms (nearly overlapping) are for the East and West wheels, respectively. Grey filled spectrum is from the simulator. Note that no special normalization is done. Only a division by the total number of events.
Figure 3: Same as figure 2, but compared to PHOBOS 6-15% centrality.
Figure 4: Same as figure 2, but compared to PHOBOS 15-25% centrality.
Figure 5: Same as figure 2, but compared to PHOBOS 25-35% centrality.
Figure 6: Same as figure 2, but compared to PHOBOS 35-45% centrality.
What about fluctuations in the primary vertex position?
In the above study, the primary vertex was fixed to (0,0,0) (center of STAR). But as we know, a given tile (say tile 04) corresponds to a different eta range, for different primary vertex position.
It is easy to simply sample the measured primary vertex distribution, which I show below, for the STAR 27 GeV data shown above. It's pretty flat with +/- 40 cm. I have attached the macro to do this at the bottom of the page, or click here.
Figure 7. The primary vertex distribution in the STAR Au+Au 27 GeV data that was used to make the ring nMIP distributions.
Below I show the nMIP spectra when the above vertex distribution is used. It should be compared to figure 6, for which (0,0,0) is used.
Figure 8. This is the same thing as in figure 6, except in figure 6, Vz==0 and here, the distribution shown in figure 7 is used.
So, we see that reasonable/typical Vz distributions produce essentially identical. In the next plot I put the Vz=3 meters (note z_EPD = 3.75 meters), simply to show that if the difference from (0,0,0) is large enough, it does matter.
Figure 9. This is the same thing as in figures 6 and 7, except a very extreme Vz=3 meters is assumed here.
Conclusion: While primary vertex position does in principle matter and the FastSim shows this, reasonable fluctuations in z-vertex don't affect things much.
Next up: tweaking dN/deta until the nMIP distributions are matched for all rings. See this page.
»
- lisa's blog
- Login or register to post comments