Extracting dNdeta with the EPD Fast Simulator
Updated on Tue, 2020-04-07 10:12. Originally created by lisa on 2020-04-01 12:05.
There, I convoluted 19.6 GeV PHOBOS measurements of dN/deta to simulate STAR EPD nMIP distributions. Comparing to the 27 GeV STAR data, the results were close, but not bang on for any given centrality. This is not surprising, since
PHOBOS reports dN/deta in eta bins that are 0.2 units wide (4.1, 4.3, 4.5, ...). That's a good choice, so I'll use that, too. It is helpful to remember what rings are affected by what values of eta. Naturally, that depends on the location of the primary vertex. Here are a few ways to quantify/visualize it.
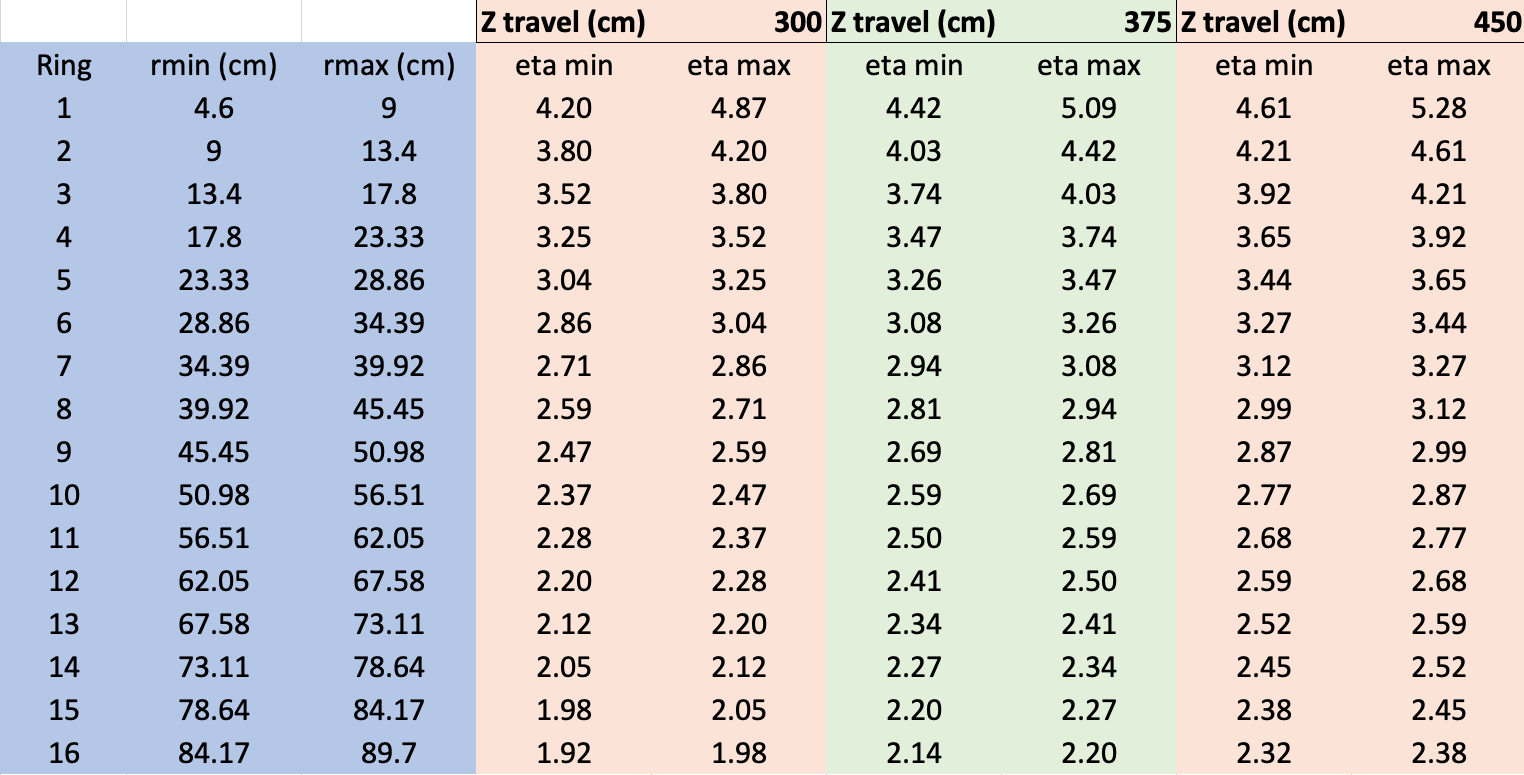
Figure 1 - Ring radii and corresponding eta ranges. If the collision is at STAR's center, particles travel 375 cm in z to reach the EPD; that is the green-shaded values. Also shown are corresponding values when z=+75 cm and z=-75 cm. As an approximate rule of thumb, moving the vertex 75 cm means changing eta by 0.2.
.png)
.png)
Figures 2 and 3: The eta coverage of each of the 16 rings of the EPD is shown, as a function of primary vertex z. In figure 3, I plot over a more limited range, and horizontal lines correspond to the eta bins I am using. The macro to make this pictures is attached to this page, or else you can click here.
When adjusting by hand, figure 3 will be helpful to tell me which ringS (plural) are affected by a given eta bin.
Aaaaaand.... with 25 minutes of hand-tuning, I was actually able to tweak the dN/deta distribution to pretty much EXACTLY match the nMIP spectra. Note again, this is not just reproducing the average, or the weighted average or whatever. This is reproducing the entire nMIP spectrum, for every ring! Seriously, this is non-trivial, and you should be impressed.
I started with the PHOBOS 19.6 GeV dN/deta distribution for 0-6% centrality (see figure 2 on this page), and just tweaked each of the 18 bins until the ADC spectra matched. It wasn't hard. (And yes, of course I will turn it into a proper automated fit, and we'll have errorbars etc).
.png)
Figure 4. nMIP spectra from the 16 rings of the EPD, measured for 27 GeV Au+Au collisions of 10-40% centrality. The East (West) EPD is shown as the red (blue) curve; East and West are nearly indistinguishable which is good. Grey histograms show simulated nMIP distributions that come from the dN/deta distribution in panel 6 and the primary vertex distribution (taken from the data) in panel 11. They are an excellent match to the measured spectra.
Okay I know what you're saying. Well, I know what you should be saying, so I'll say it for you: nice! You're welcome. The macro I used to hand-tweak this (look at function at the bottom) is attached below, or click here.
Very nice. Next step: find a way to "mechanize" this, to get a publishable plot....
Summary:
The EPD Fast Simulator was described on this page. There, it was shown that the nMIP distributions are sensitive to the dNdeta distribution but not very much to Zvertex position, neither one of which is surprising.There, I convoluted 19.6 GeV PHOBOS measurements of dN/deta to simulate STAR EPD nMIP distributions. Comparing to the 27 GeV STAR data, the results were close, but not bang on for any given centrality. This is not surprising, since
- they are not at the same energy.
- Another reason could be that the effects of material between collision and EPD are important.
- For this study, I will hand-vary dN/deta. At some point, I'll have to mechanize it.
- Also, even if I get it totally perfect, this is only "the dN/deta seen by the EPD," not "the dN/deta produced in the collision," since there can be rescattering in other material in STAR.
Acceptance:
PHOBOS reports dN/deta in eta bins that are 0.2 units wide (4.1, 4.3, 4.5, ...). That's a good choice, so I'll use that, too. It is helpful to remember what rings are affected by what values of eta. Naturally, that depends on the location of the primary vertex. Here are a few ways to quantify/visualize it.
Figure 1 - Ring radii and corresponding eta ranges. If the collision is at STAR's center, particles travel 375 cm in z to reach the EPD; that is the green-shaded values. Also shown are corresponding values when z=+75 cm and z=-75 cm. As an approximate rule of thumb, moving the vertex 75 cm means changing eta by 0.2.
Figures 2 and 3: The eta coverage of each of the 16 rings of the EPD is shown, as a function of primary vertex z. In figure 3, I plot over a more limited range, and horizontal lines correspond to the eta bins I am using. The macro to make this pictures is attached to this page, or else you can click here.
When adjusting by hand, figure 3 will be helpful to tell me which ringS (plural) are affected by a given eta bin.
First results....
Aaaaaand.... with 25 minutes of hand-tuning, I was actually able to tweak the dN/deta distribution to pretty much EXACTLY match the nMIP spectra. Note again, this is not just reproducing the average, or the weighted average or whatever. This is reproducing the entire nMIP spectrum, for every ring! Seriously, this is non-trivial, and you should be impressed.
I started with the PHOBOS 19.6 GeV dN/deta distribution for 0-6% centrality (see figure 2 on this page), and just tweaked each of the 18 bins until the ADC spectra matched. It wasn't hard. (And yes, of course I will turn it into a proper automated fit, and we'll have errorbars etc).
Figure 4. nMIP spectra from the 16 rings of the EPD, measured for 27 GeV Au+Au collisions of 10-40% centrality. The East (West) EPD is shown as the red (blue) curve; East and West are nearly indistinguishable which is good. Grey histograms show simulated nMIP distributions that come from the dN/deta distribution in panel 6 and the primary vertex distribution (taken from the data) in panel 11. They are an excellent match to the measured spectra.
Okay I know what you're saying. Well, I know what you should be saying, so I'll say it for you: nice! You're welcome. The macro I used to hand-tweak this (look at function at the bottom) is attached below, or click here.
Very nice. Next step: find a way to "mechanize" this, to get a publishable plot....
»
- lisa's blog
- Login or register to post comments