EPD timing scan for Run 2018
Updated on Fri, 2018-08-17 15:51. Originally created by lisa on 2018-03-14 16:53.
Executive Summary:
Gate-delay study finds that maximizing average signal integration (i.e. largest ADC value for MIP peak) is obtained for
Akio has pointed out convincingly that, while we will have a bit smaller MIP peaks on average, in order to capture the earliest hits, we should run with values a little lower than these. This is for purposes of timing with the QT32Cs (see histogram in 4th column for run 50 here), as well as to ensure we capture fluctuations from events with different vertex position.
Therefore, we will run with:
Two files are attached to this page
The first preliminary timing study can be found here: drupal.star.bnl.gov/STAR/blog/lisa/first-epd-timing-scan-2018
All analysis plots are in this 811-page pdf file.
Beginning in this analysis, we refer directly to the value of the "tags" that specify the gate delay, rather than choosing some reference setting as "t=0" and describing shifts relative to that, as we had been doing. The tags are below. We change the Start_delay tags for QT32B & QT32C. The Stop_delays and TAC_Stop had fixed relationship to these Start_delays, as follows
Runs, spectra
We took several runs (~10 minutes each) with ~150k triggers with stable beam the night of 13-14 March. Bias voltage was 58 V for all tiles. (This is probably higher than what will be our average this year.)
Peaks were measured in all 744 tiles and fitted with Landau functions. With these stats, the fitting was straightforward. One tile is shown below, for 14 values of EPD_QT_Gate_Start_delay. Plots like this are found on pages 2-745 of the pdf file.
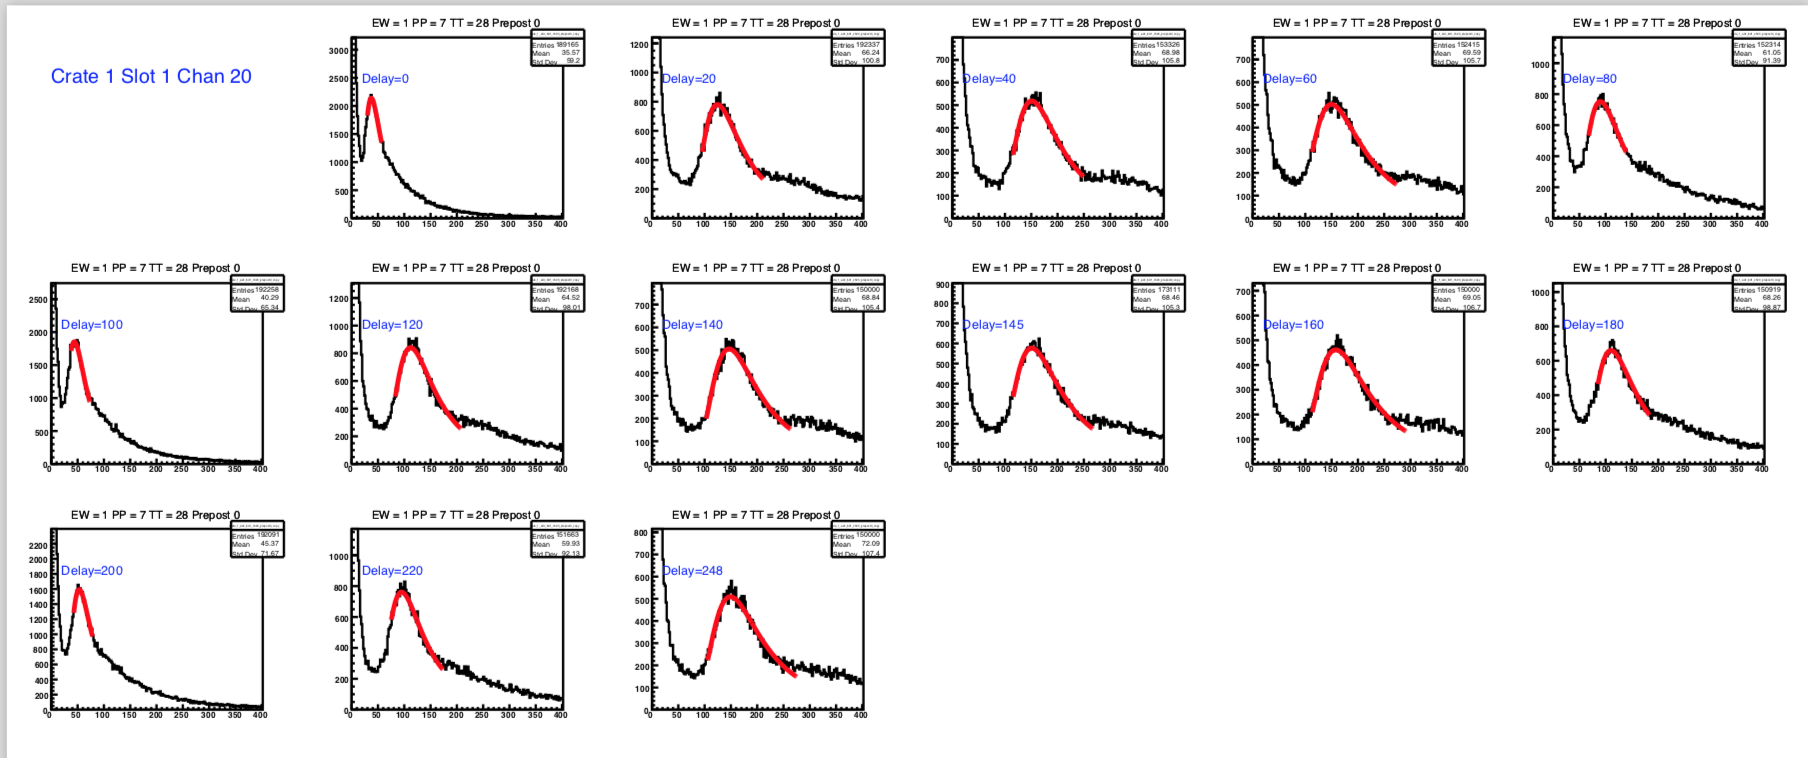
Figure 1
To first approximation (refined below), a goal of the exercise is to integrate as much of the signal as possible, i.e. to maximize the ADC value of the peak position. The plots show that the peak is smallest for delays of ~0 and ~100, and largest for ~140 and ~248. In fact, the latter two delay values give virtually iidentical spectra, reflecting the 108-ns periodicity mentioned above.
Findings
Below see the peak positions versus gate delay for the channels on a QT32B board and a QT32C board. (Note there are only 16 ADC channels on a QT32C board.) These plots are found on pages 746-777.
We observe the following:
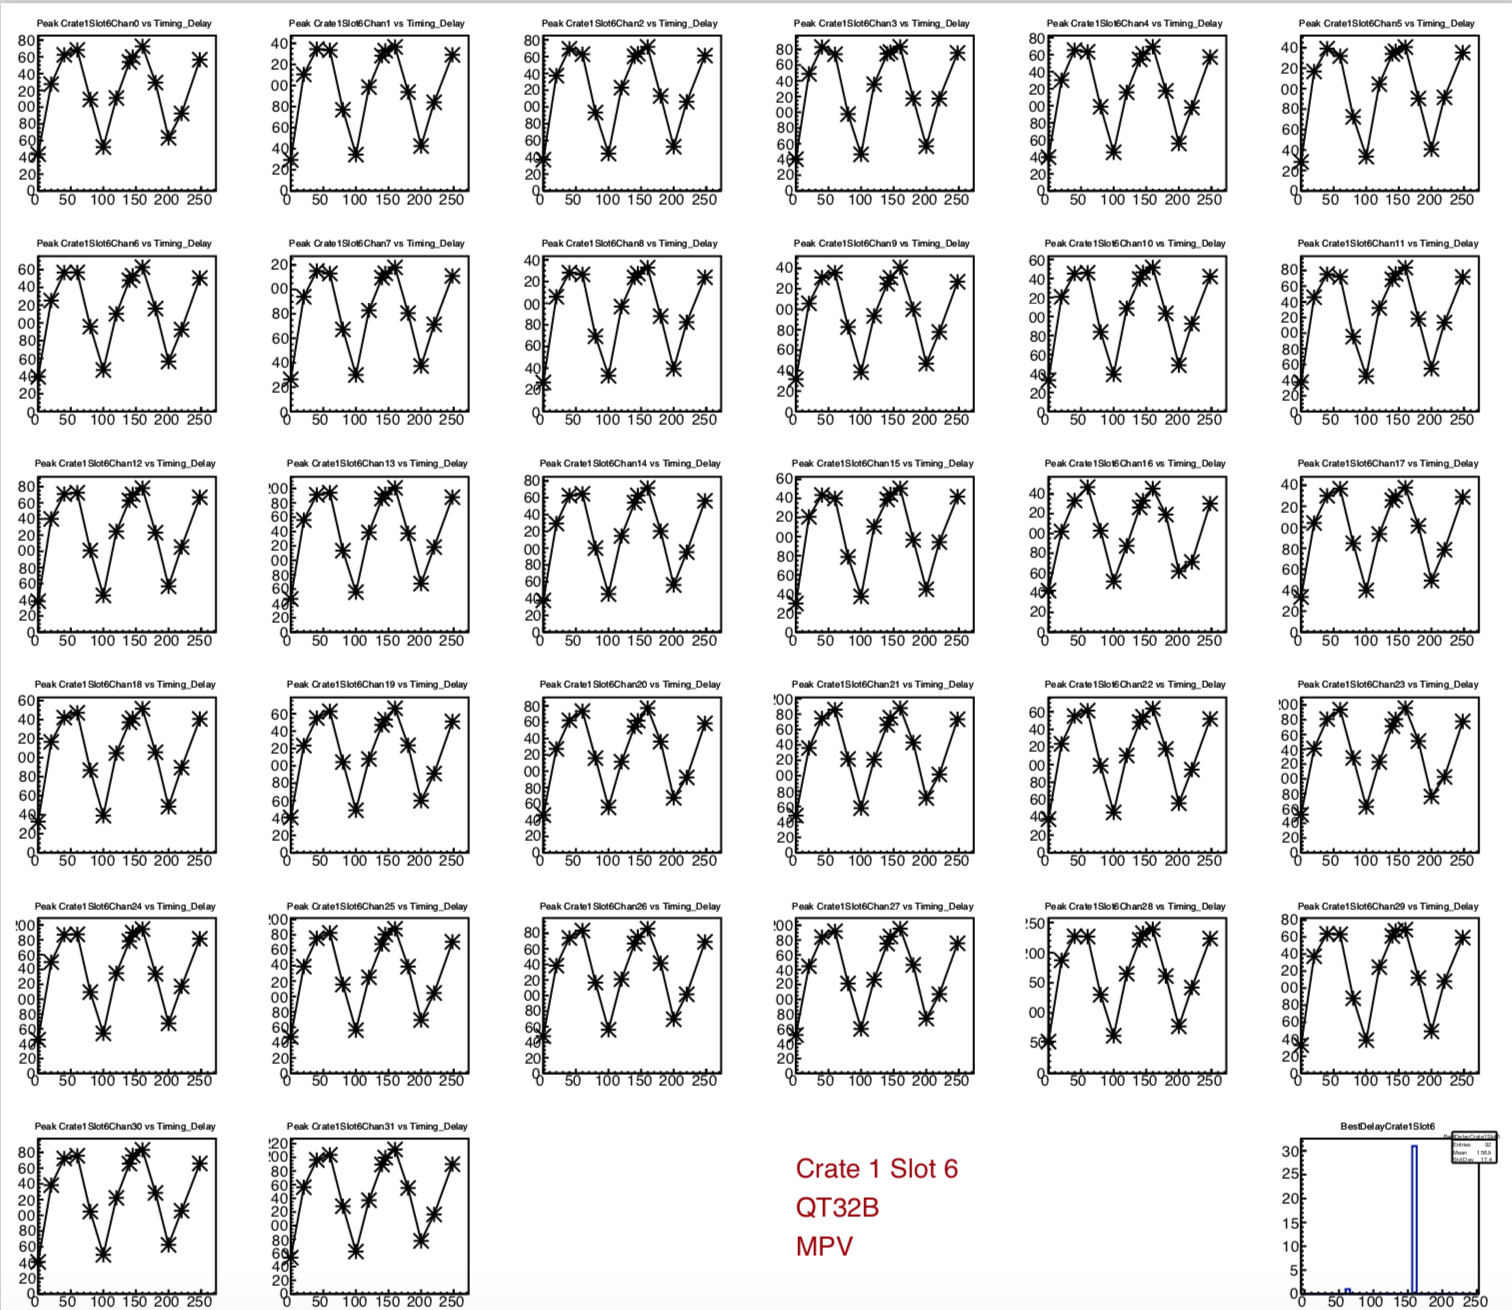
Figure 2: MIP peak positions versus EPD_QT_Gate_Start_delay for 32 channels of the QT32B card in slot 6 of EQ1
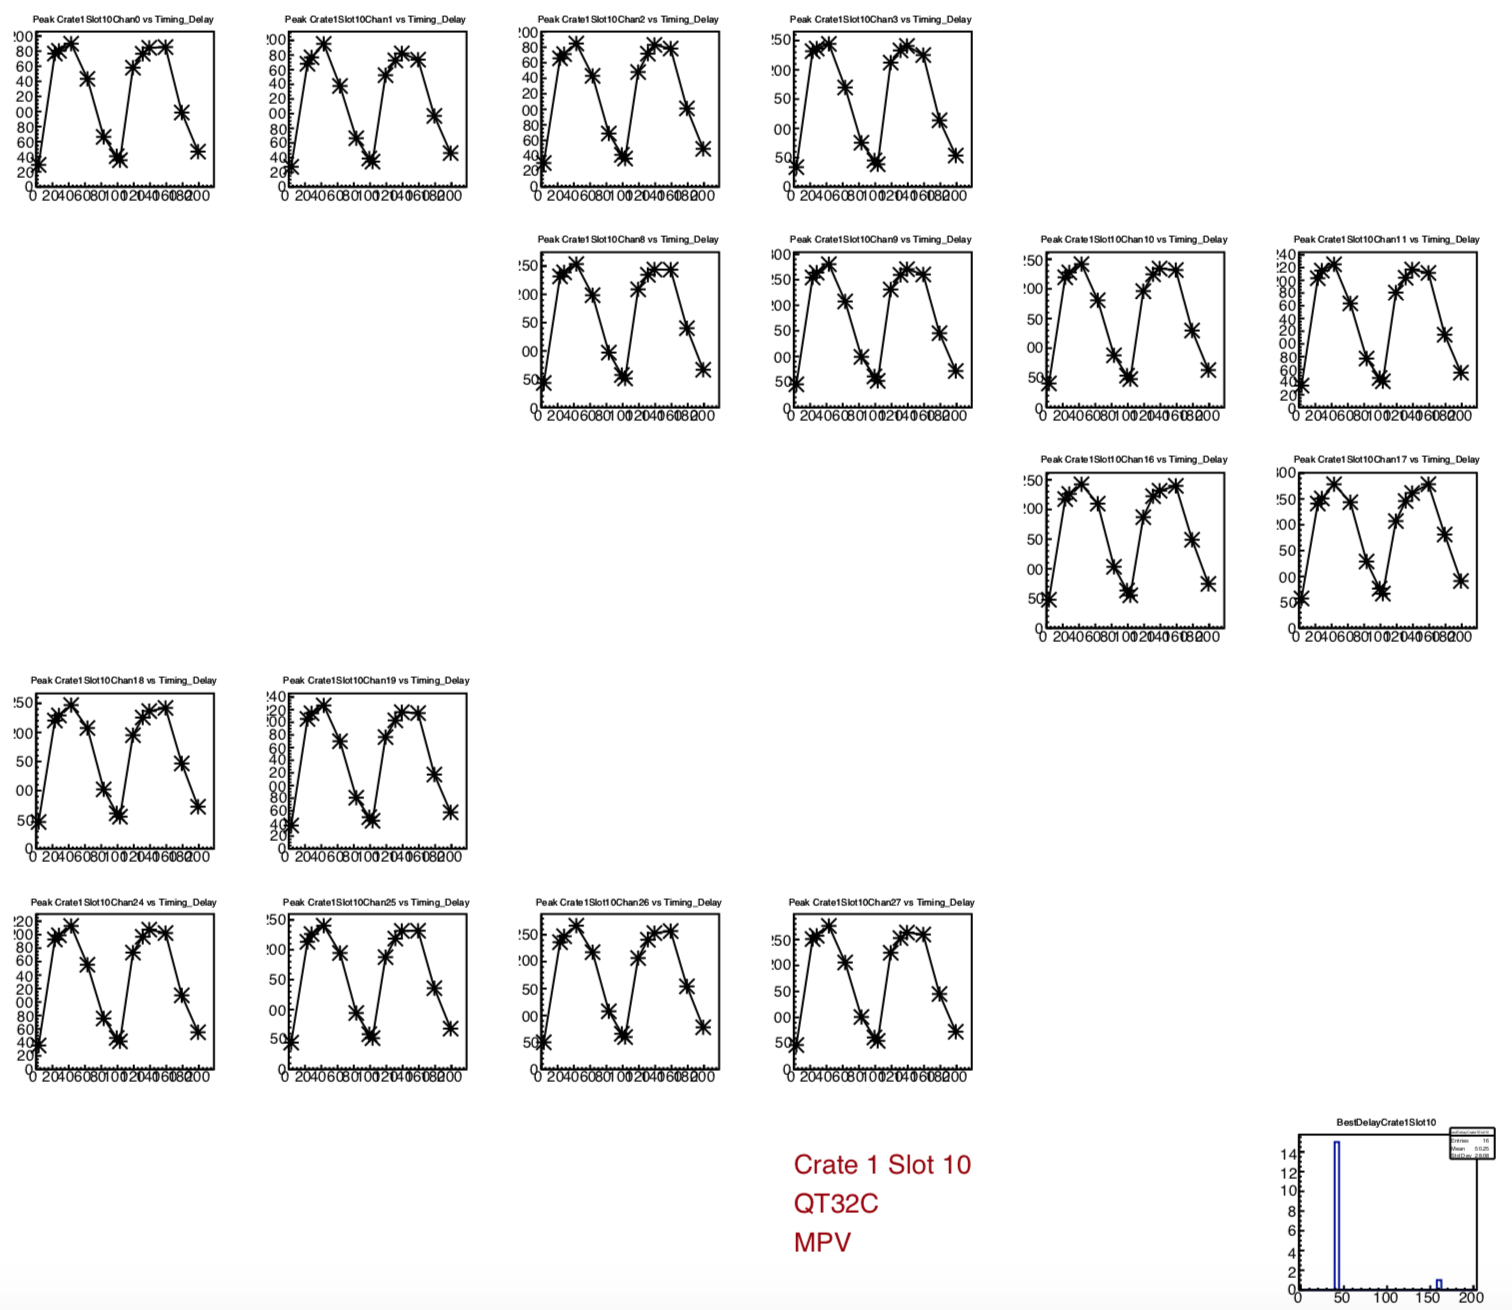
Figure 3: MIP peak positions versus EPD_QTc_Gate_Start_delay for 16 channels of the QT32C card in slot 10 of EQ1
Accounting for periodicity:
Having noted the (expected) periodicity, to make the most of statistics, we shift all delays to fall in the range [0,108]. For the same two boards, the results are shown below. A common curve is seen. These plots are found on pp 779-810 of the pdf file.
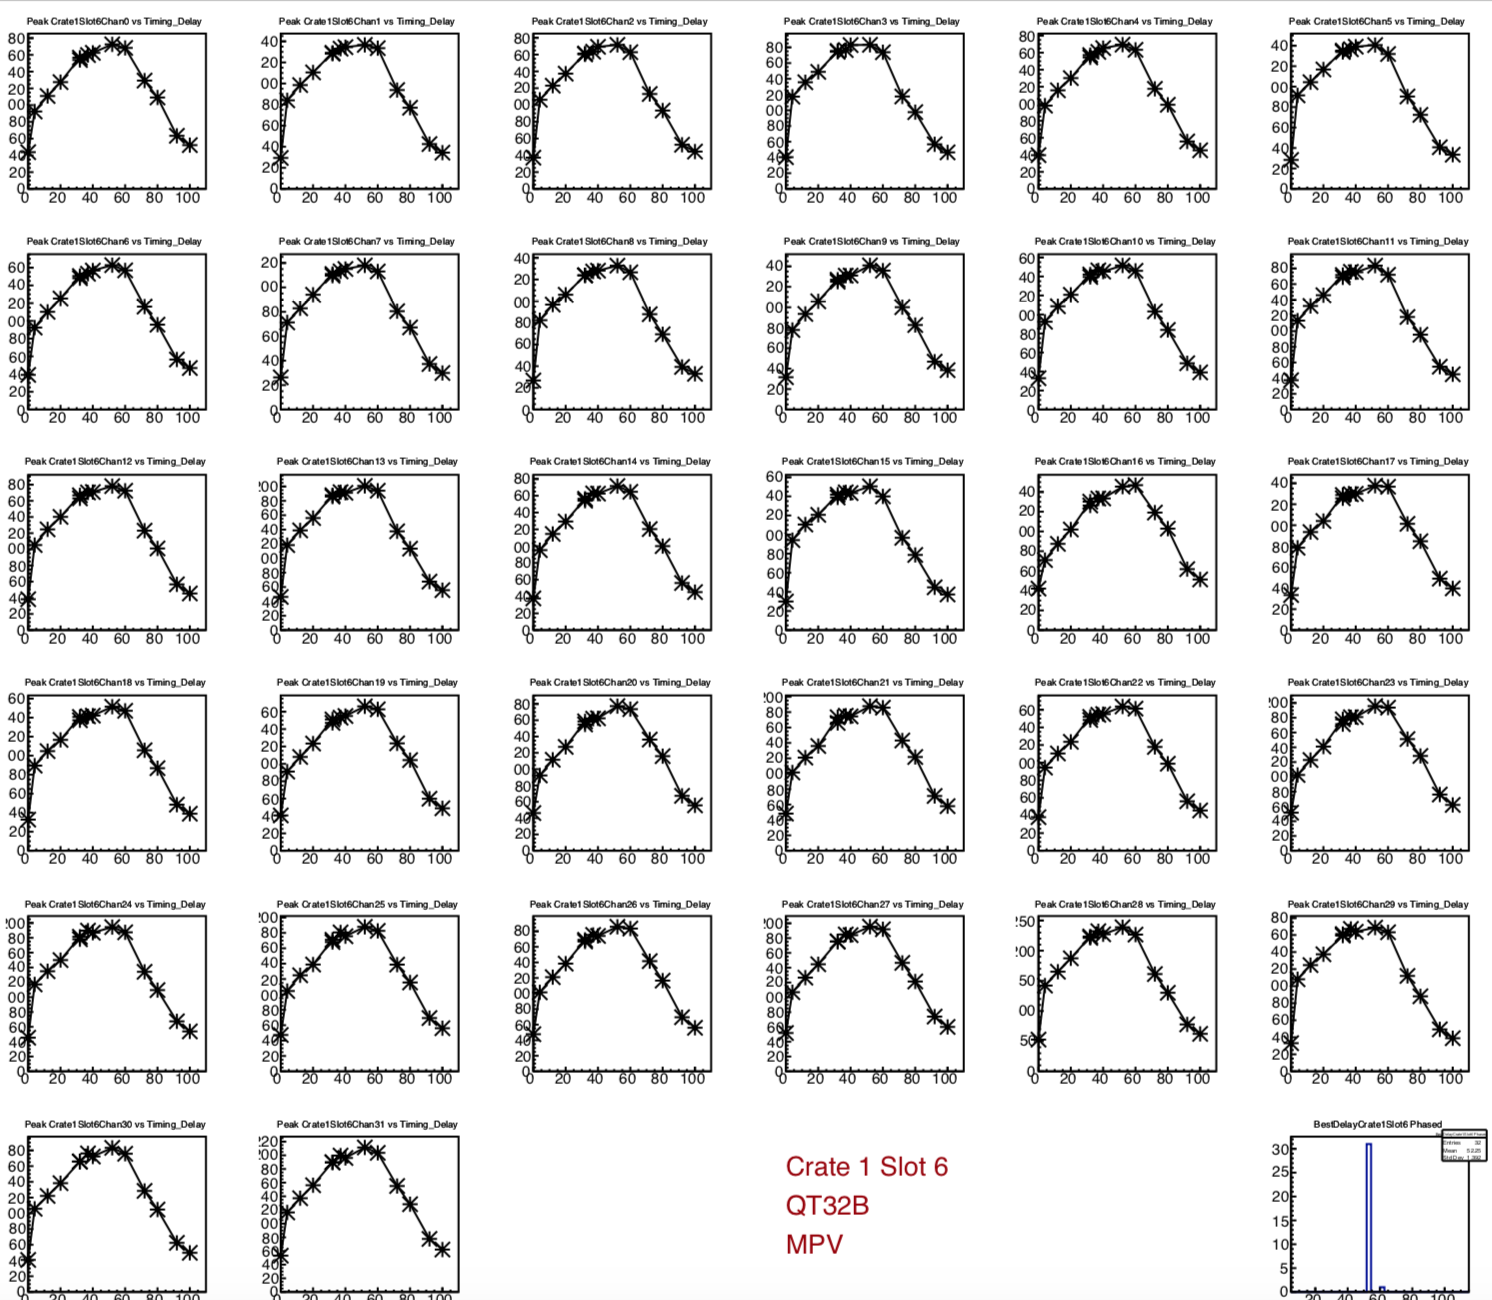
Figure 4: MIP peak positions versus EPD_QT_Gate_Start_delay for 32 channels of the QT32B card in slot 6 of EQ1. Delays above 108 ns have been shifted back, to fall in range [0,108]
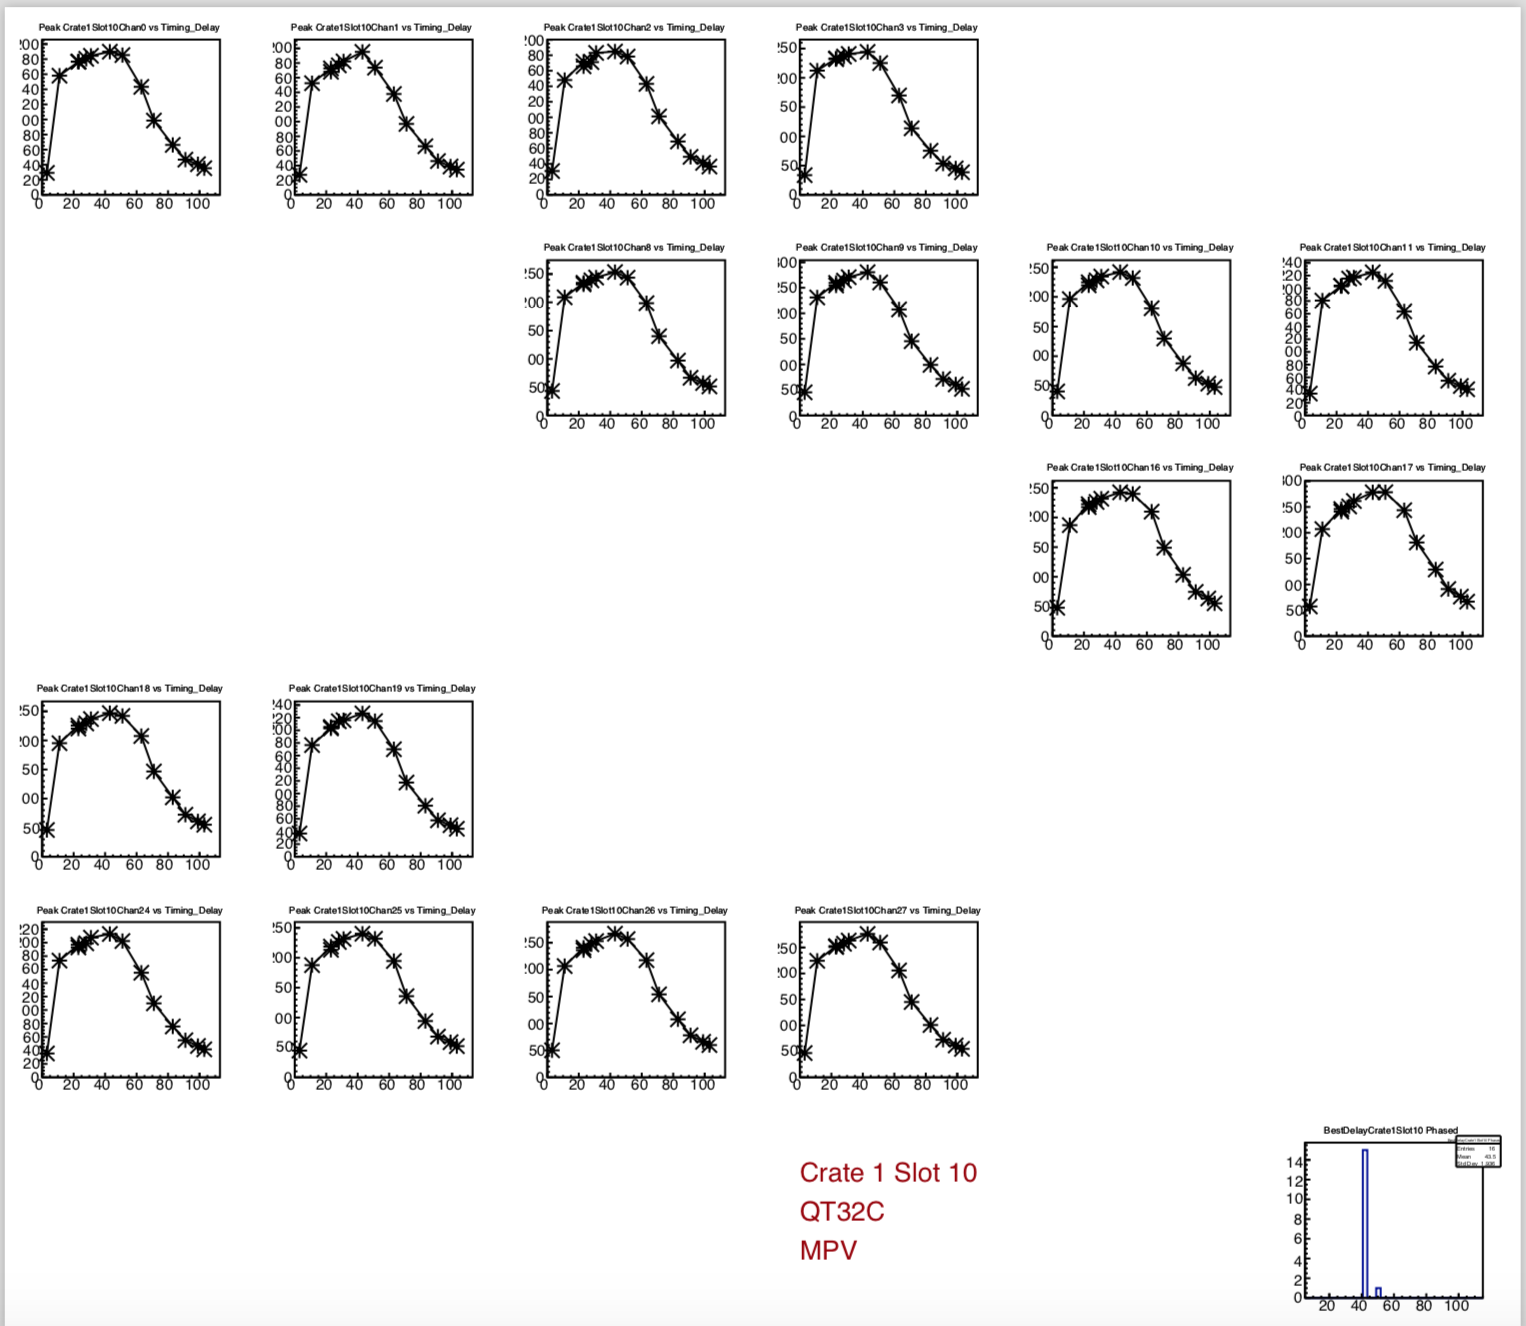
Figure 5: MIP peak positions versus EPD_QTc_Gate_Start_delay for 32 channels of the QT32C card in slot 10 of EQ1. Delays above 108 ns have been shifted back, to fall in range [0,108]
Optimum delays for all channels:
The image below (p811, see also p778) shows one histogram per QT32 board, showing the delays that maximize the ADC value of the MIP peak. There is no obvious difference between the three EQ crates.
It is interesting to note that the values we had begun with were
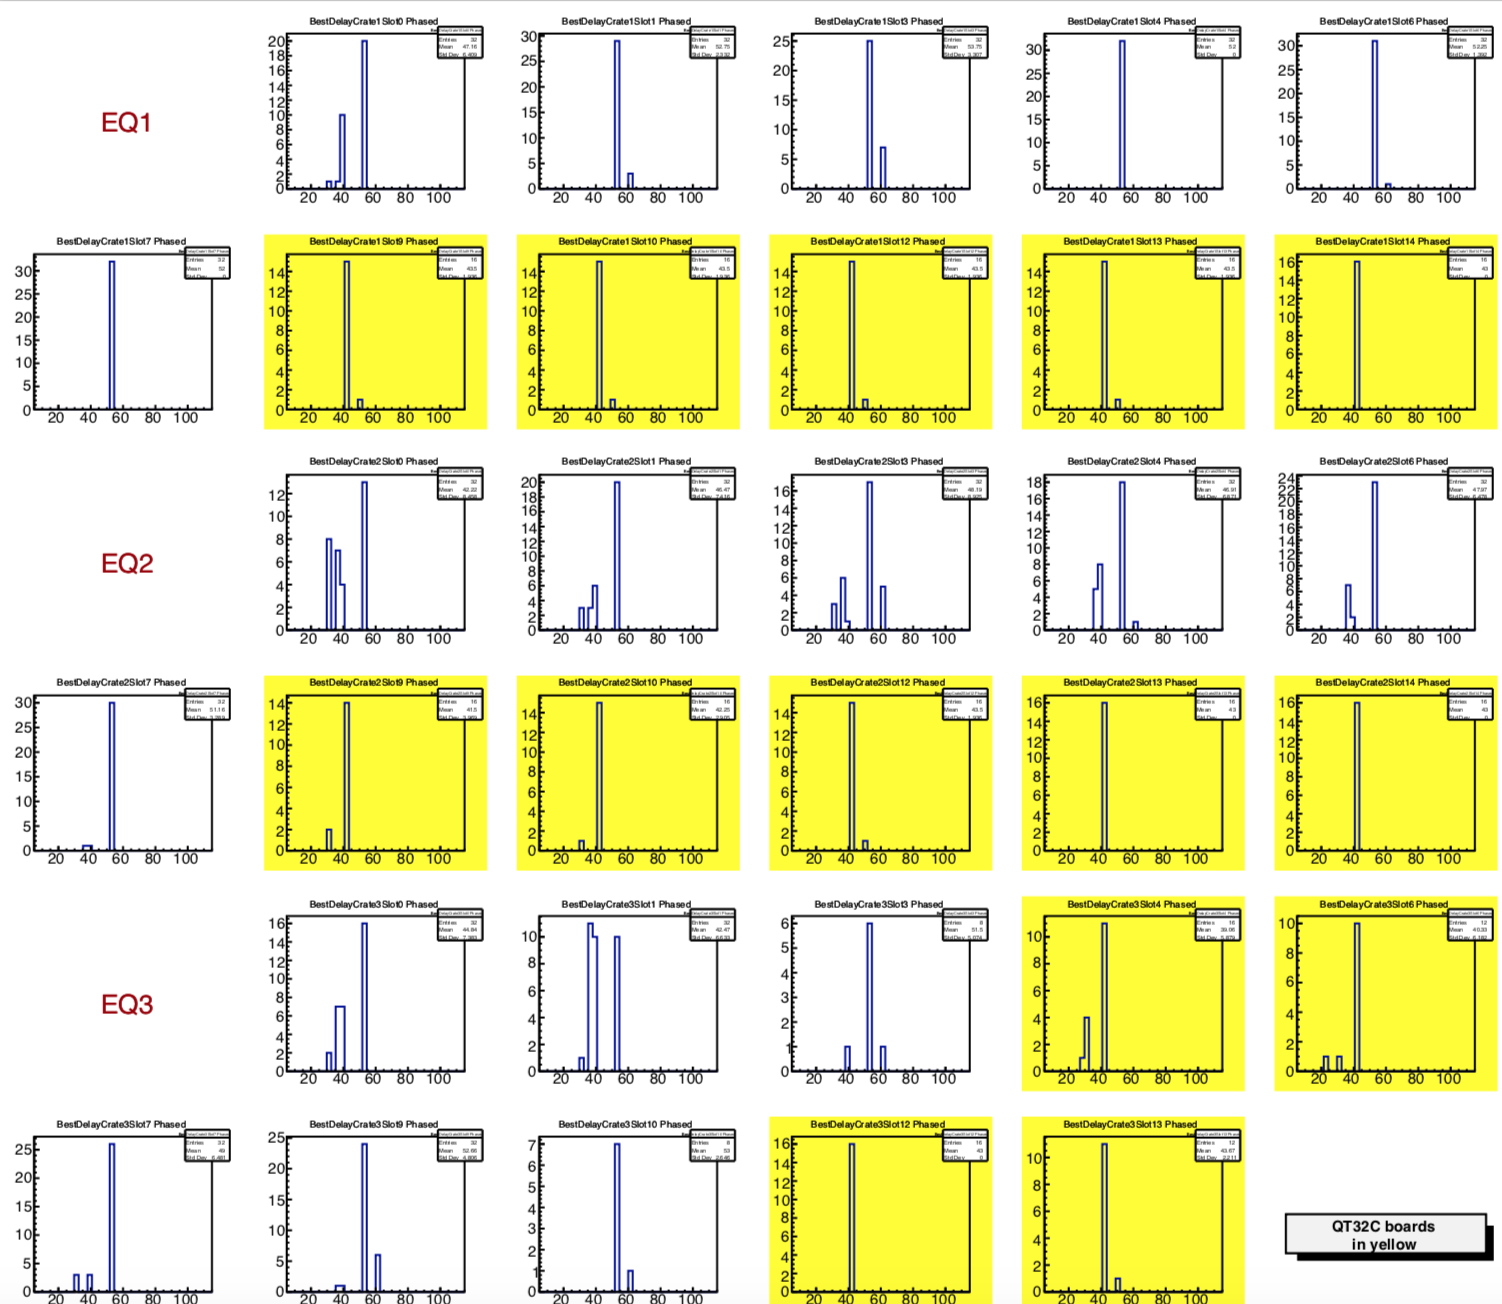
Figure 6: Optimum delays, board-by-board
Gate-delay study finds that maximizing average signal integration (i.e. largest ADC value for MIP peak) is obtained for
- EPD_QT_Start_delay=53 (for QT32Bs)
- EPD_QTc_Gate_Start_delay=43.
Akio has pointed out convincingly that, while we will have a bit smaller MIP peaks on average, in order to capture the earliest hits, we should run with values a little lower than these. This is for purposes of timing with the QT32Cs (see histogram in 4th column for run 50 here), as well as to ensure we capture fluctuations from events with different vertex position.
Therefore, we will run with:
- EPD_QT_Gate_Start_delay=32
- EPD_QT_Gate_Stop_delay=48
- EPD_QTc_Gate_Start_delay=23.
- EPD_QTc_Gate_Stop_delay=39
- EPD_QTc_Gate_TAC_Stop=64
Two files are attached to this page
- TimingScan.C - root macro that runs on ADC distributions created from .dat files.
- Rosi has posted the code and procedure that produces these input histograms. Thanks! They use a naming convention important for proper function of my code
- Note: In principle I would like to "clean up" TimingScan.C, as it is ungraceful. But it is better to post it than wait for perfection. I may come back to update later.
- GateScan.pdf - This is a monster pdf produced by the above macro. It is discussed below.
The first preliminary timing study can be found here: drupal.star.bnl.gov/STAR/blog/lisa/first-epd-timing-scan-2018
All analysis plots are in this 811-page pdf file.
Beginning in this analysis, we refer directly to the value of the "tags" that specify the gate delay, rather than choosing some reference setting as "t=0" and describing shifts relative to that, as we had been doing. The tags are below. We change the Start_delay tags for QT32B & QT32C. The Stop_delays and TAC_Stop had fixed relationship to these Start_delays, as follows
- EPD_QT_Gate_Start_delay
- EPD_QT_Gate_Stop_delay = EPD_QT_Gate_Start_delay+16 (subtract N*108 as necessary to get in range [0,255])
- EPD_QTc_Gate_Start_delay
- EPD_QTc_Gate_Stop_delay = EPD_QTc_Gate_Start_delay+16 (subtract N*108 as necessary to get in range [0,255])
- EPD_QTc_Gate_TAC_Stop = 18 + 2*EPD_QTc_Gate_Start_delay (subtract N*2*108 as necessary to get in range [0,255])
Runs, spectra
We took several runs (~10 minutes each) with ~150k triggers with stable beam the night of 13-14 March. Bias voltage was 58 V for all tiles. (This is probably higher than what will be our average this year.)
Peaks were measured in all 744 tiles and fitted with Landau functions. With these stats, the fitting was straightforward. One tile is shown below, for 14 values of EPD_QT_Gate_Start_delay. Plots like this are found on pages 2-745 of the pdf file.
Figure 1
To first approximation (refined below), a goal of the exercise is to integrate as much of the signal as possible, i.e. to maximize the ADC value of the peak position. The plots show that the peak is smallest for delays of ~0 and ~100, and largest for ~140 and ~248. In fact, the latter two delay values give virtually iidentical spectra, reflecting the 108-ns periodicity mentioned above.
Findings
Below see the peak positions versus gate delay for the channels on a QT32B board and a QT32C board. (Note there are only 16 ADC channels on a QT32C board.) These plots are found on pages 746-777.
We observe the following:
- All channels on a given board give a consistent message.
- very similar patterns
- on lower right pad of each page is a histogram of "optimum delays" for the board. It is always highly peaked.
- The 108-ns periodic structure is clear
- The optimum delays for QT32B and QT32C boards are different (as expected).
Figure 2: MIP peak positions versus EPD_QT_Gate_Start_delay for 32 channels of the QT32B card in slot 6 of EQ1
Figure 3: MIP peak positions versus EPD_QTc_Gate_Start_delay for 16 channels of the QT32C card in slot 10 of EQ1
Accounting for periodicity:
Having noted the (expected) periodicity, to make the most of statistics, we shift all delays to fall in the range [0,108]. For the same two boards, the results are shown below. A common curve is seen. These plots are found on pp 779-810 of the pdf file.
Figure 4: MIP peak positions versus EPD_QT_Gate_Start_delay for 32 channels of the QT32B card in slot 6 of EQ1. Delays above 108 ns have been shifted back, to fall in range [0,108]
Figure 5: MIP peak positions versus EPD_QTc_Gate_Start_delay for 32 channels of the QT32C card in slot 10 of EQ1. Delays above 108 ns have been shifted back, to fall in range [0,108]
Optimum delays for all channels:
The image below (p811, see also p778) shows one histogram per QT32 board, showing the delays that maximize the ADC value of the MIP peak. There is no obvious difference between the three EQ crates.
- For the QT32Bs, a value of EPD_QT_Start_delay=53 would be good
- Clearly, channels on QT32C boards are maximally integrating when EPD_QTc_Gate_Start_delay=43.
It is interesting to note that the values we had begun with were
- EPD_QT_Start_delay=190 (-->82)
- EPD_QTc_Start_delay=73
Figure 6: Optimum delays, board-by-board
»
- lisa's blog
- Login or register to post comments