Extracting dN/deta in the forward region by unfolding
Updated on Wed, 2020-09-02 18:19. Originally created by lisa on 2020-09-02 17:32.
This blog entry is a continuation of several previous ones:
We plan a paper on the charged particle pseudorapidity distribution in sqrt(s)=7.7 to 54 GeV Au+Au collisions. PAs: Mate Csanad, Mike Lisa, Daniel Cebra, Prithwish Tribedy.
Much has been written on the previous pages, so here it is kind of nuts and bolts. The main "division of labor" has been that Mike provides the average number of charged particles that pass through an EPD RING (not eta region), for a given centrality, for a given range in primary vertex position. Mate has been generating unfolding matrices and using RooUnfold to deconvolve the ring spectra into dN/deta. Since about half of the particles that strike the EPD are NOT primary particles, and we want to get the dN/deta of primary particles, this is obviously important!!
Systematic Errors.
Mate is maintaining a page on these at https://drupal.star.bnl.gov/STAR/blog/mcsanad/systematics-and-centrality-dependence-dnchdeta There are several sources.
The unfolding is FAR from trivial, and there are systematic errors associated with the unfolding, including:
The input - the EPD data
Anybody who has worked with the EPD will recognize these techniques... Our goal is to find out the average number of particles that pass through an EPD ring. It is not as trivial as you might at first think. This has been discussed ad nauseam elsewhere.
For each centrality bin and each Vz bin.....
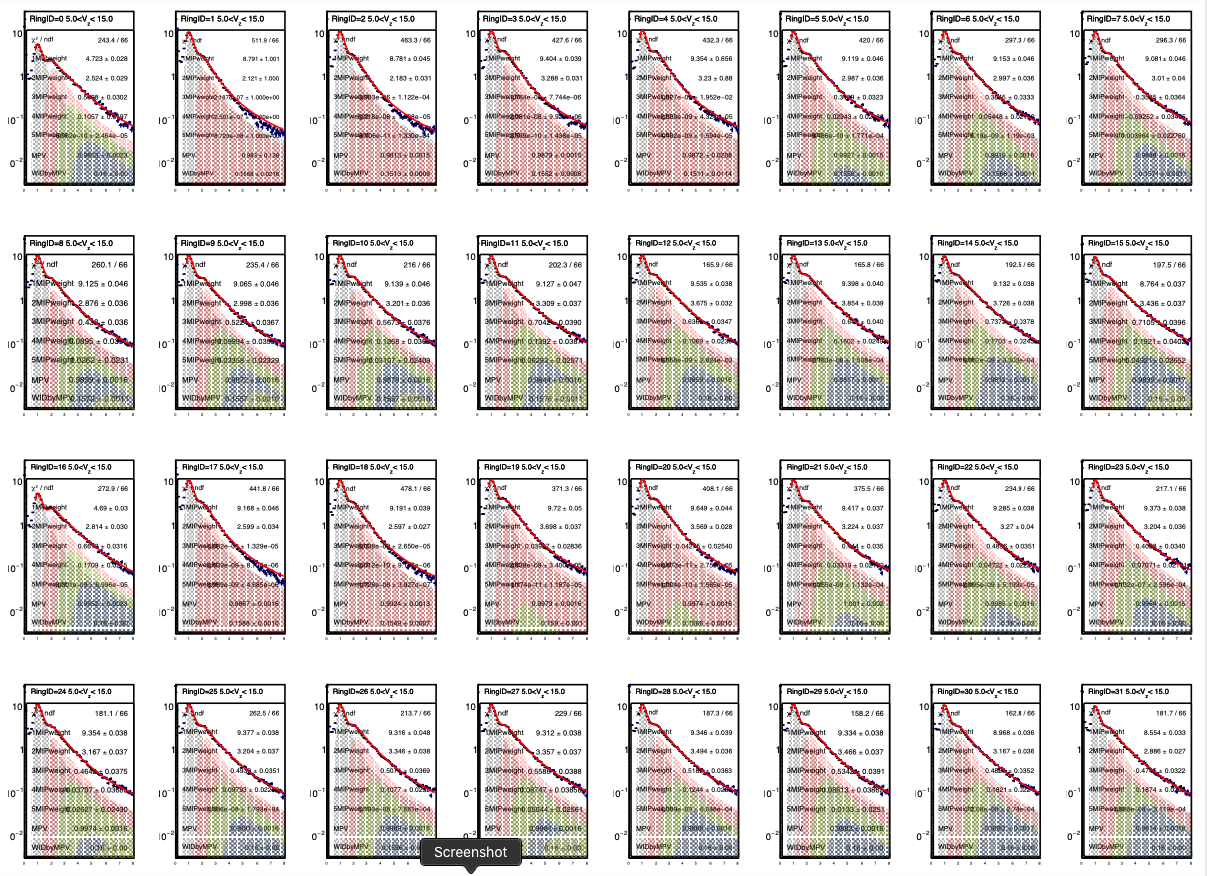
Figure 1: Multiple Landau fits to ADC spectra. (The ADC value has been scaled such that 1.0 is the value of the MPV of the single-particle Landau peak. This scaled ADC value has been unfortunately named (by me) "nMIP".) The spectrum is the small blue points, and the fit, which doesn't go to very low values of nMIP because dark-current noise cuts in there, is shown by the red line. It includes 1-, 2-, 3-, 4-, and 5-particle contributions. The individual contributions are shown as grey (1), red (2), green (3), blue (4) and dark green (5) shaded regions. (There are no visible dark green regions on this particular image.) Weights are in the superimposed text; ignore the signs, those are an unimportant detail and we use absolute values. These spectra are the sum of all 24 tiles in the ring (or 12 tiles, if it is ring 1). Therefore, the weights are the single-tile probability times 24 (or 12). Top two rows are for EPD East, from rings 1-16. Bottom two rows are for EPD West, from rings 1-16.
This image is for 10-20% Au+Au collisions at 27 GeV, for +5 cm < Vz < +15 cm.
For fun, I decided to look at the distribution of M0, M1, M2, ... ring-by ring. This is shown below. The red curves are Poisson distributions corresponding to the average values from step 3 in the procedure above. They are not fits to the data, just simply unadjusted, unscaled curves. To me it is astounding the level of agreement. It is NOT necessary that they agree. After all, presumably there ARE correlations in the data, and Poisson implies random. It just goes to show how much statistical phasespace dominates these things.
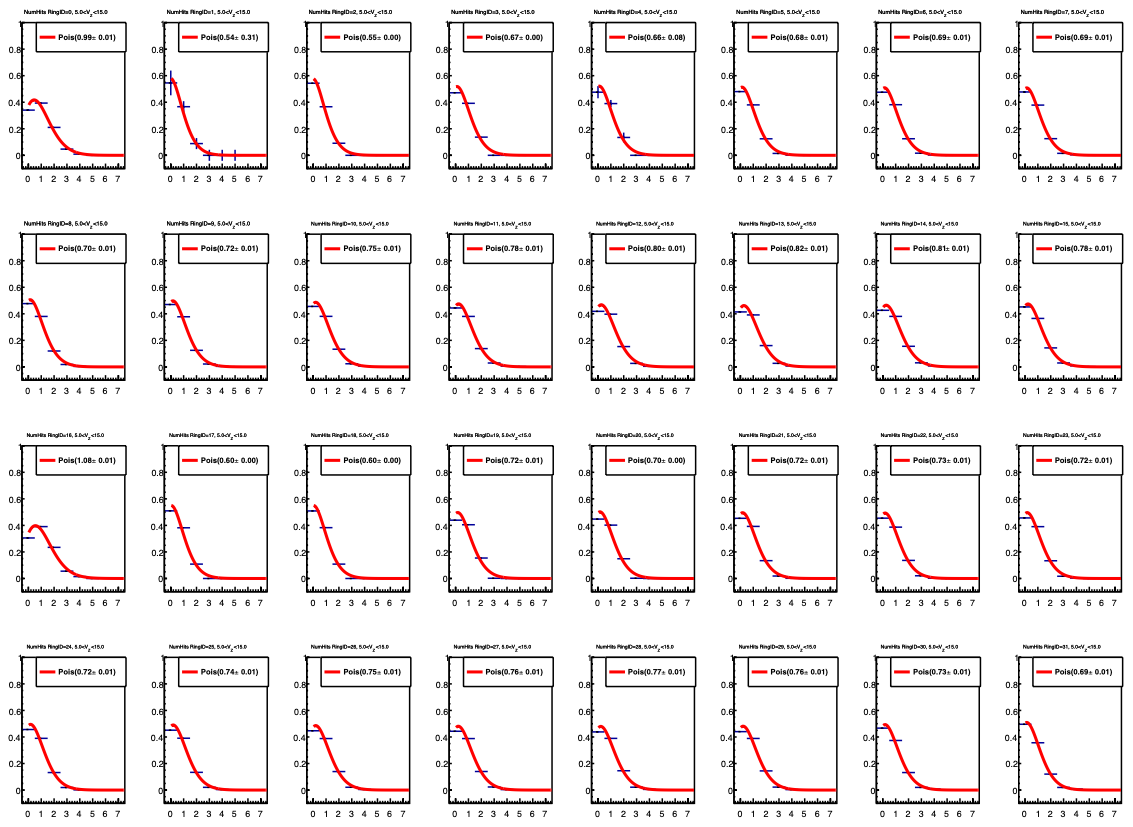
Figure 2: Blue points correspond to the weights indicated in the panels from figure 1 above, divided by the number of tiles in the ring (12 for ring 1; 24 for the others). The point at N=0 is unity minus the sum of MN for N>0. Red curve is a poisson distribution, unscaled and NOT a fit to the data. The single parameter that goes into a poisson, the average, is given by the formula in step 3 above.
This image is for 10-20% Au+Au collisions at 27 GeV, for +5 cm < Vz < +15 cm.
Finally, this is what I give to Mate:
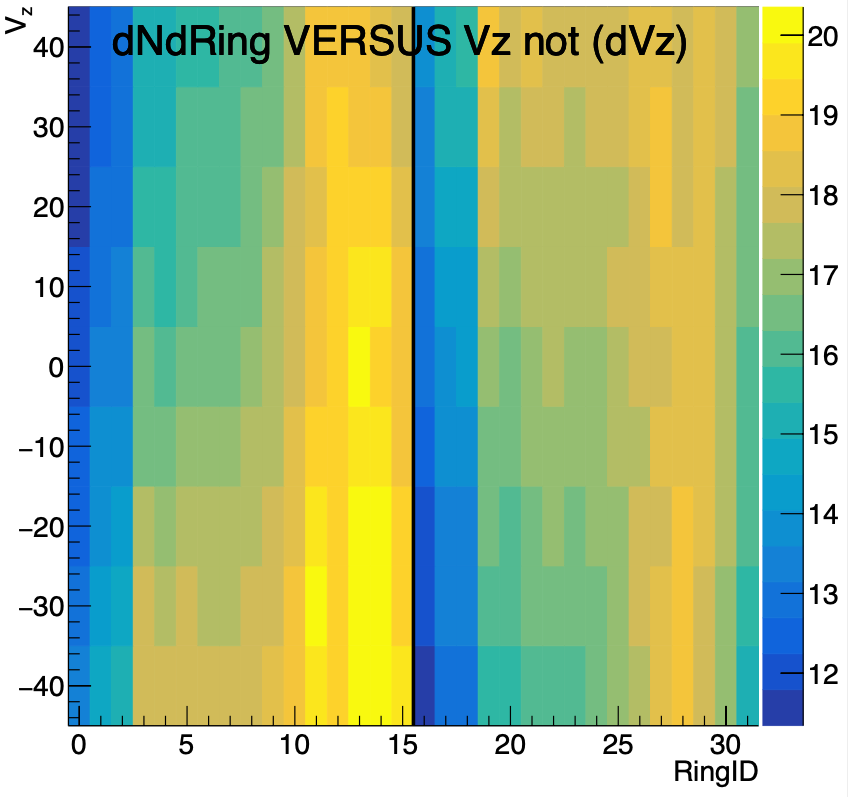
Figure 3: The average number of particles (obtained through procedure above) passing through a ring in a given event (color) plotted as a function of Ring number (x-axis) and primary vertex position (y-axis). The ring numbering system used here is RingID=0-15 means EPD East rings 1-16; RingID=16-31 means EPD West rings 1-16. For the record, Mate uses a different convention, and I translate before sending him this data.
- Probably the most relevant is "Towards a forward dN/deta paper": https://drupal.star.bnl.gov/STAR/blog/lisa/towards-forward-dndeta-paper
We plan a paper on the charged particle pseudorapidity distribution in sqrt(s)=7.7 to 54 GeV Au+Au collisions. PAs: Mate Csanad, Mike Lisa, Daniel Cebra, Prithwish Tribedy.
Much has been written on the previous pages, so here it is kind of nuts and bolts. The main "division of labor" has been that Mike provides the average number of charged particles that pass through an EPD RING (not eta region), for a given centrality, for a given range in primary vertex position. Mate has been generating unfolding matrices and using RooUnfold to deconvolve the ring spectra into dN/deta. Since about half of the particles that strike the EPD are NOT primary particles, and we want to get the dN/deta of primary particles, this is obviously important!!
Systematic Errors.
Mate is maintaining a page on these at https://drupal.star.bnl.gov/STAR/blog/mcsanad/systematics-and-centrality-dependence-dnchdeta There are several sources.
The unfolding is FAR from trivial, and there are systematic errors associated with the unfolding, including:
- assumptions of the pT distribution used (we use Hijing as default, and then vary around that)
- assumptions of neutral particle fraction
- method used. RooUnfold has several methods (Baysian etc) and ways to account for "missed hits." We compare the results using different methods
- if we look at collisions where -15 cm < Vz < -5 cm and compare them to those with +35 cm < Vz < +45 cm, the data will be different and the unfolding matrix will be different, but the TRUTH ("true dN/deta") won't be different. So the difference between cuts like these give us a measure of a systematic resolution from this cause
- irresolution on the primary vertex distribution
- uncertainty of the centrality
The input - the EPD data
Anybody who has worked with the EPD will recognize these techniques... Our goal is to find out the average number of particles that pass through an EPD ring. It is not as trivial as you might at first think. This has been discussed ad nauseam elsewhere.
For each centrality bin and each Vz bin.....
- make a distribution of dN/dnMIP for each of the 32 EPD rings (16 each on East and West)
- fit this distribution with a multiple-Landau function. The output of that fit is the probability of having 1-particle, 2-particles, 3-particles... N-particles pass through a tile in a given event
- calling the n-particle probability Mn , and recognizing that M0 = 1.0-M1-M2-M3-...Minfinity, the average number of particles passing through a tile in a ring is given by <N>=M1+2M2+3M3+4M4+...+iMi+... This is what I give to Mate, together with statistical error (since the M's have errors from the fits)
Figure 1: Multiple Landau fits to ADC spectra. (The ADC value has been scaled such that 1.0 is the value of the MPV of the single-particle Landau peak. This scaled ADC value has been unfortunately named (by me) "nMIP".) The spectrum is the small blue points, and the fit, which doesn't go to very low values of nMIP because dark-current noise cuts in there, is shown by the red line. It includes 1-, 2-, 3-, 4-, and 5-particle contributions. The individual contributions are shown as grey (1), red (2), green (3), blue (4) and dark green (5) shaded regions. (There are no visible dark green regions on this particular image.) Weights are in the superimposed text; ignore the signs, those are an unimportant detail and we use absolute values. These spectra are the sum of all 24 tiles in the ring (or 12 tiles, if it is ring 1). Therefore, the weights are the single-tile probability times 24 (or 12). Top two rows are for EPD East, from rings 1-16. Bottom two rows are for EPD West, from rings 1-16.
This image is for 10-20% Au+Au collisions at 27 GeV, for +5 cm < Vz < +15 cm.
For fun, I decided to look at the distribution of M0, M1, M2, ... ring-by ring. This is shown below. The red curves are Poisson distributions corresponding to the average values from step 3 in the procedure above. They are not fits to the data, just simply unadjusted, unscaled curves. To me it is astounding the level of agreement. It is NOT necessary that they agree. After all, presumably there ARE correlations in the data, and Poisson implies random. It just goes to show how much statistical phasespace dominates these things.
Figure 2: Blue points correspond to the weights indicated in the panels from figure 1 above, divided by the number of tiles in the ring (12 for ring 1; 24 for the others). The point at N=0 is unity minus the sum of MN for N>0. Red curve is a poisson distribution, unscaled and NOT a fit to the data. The single parameter that goes into a poisson, the average, is given by the formula in step 3 above.
This image is for 10-20% Au+Au collisions at 27 GeV, for +5 cm < Vz < +15 cm.
Finally, this is what I give to Mate:
Figure 3: The average number of particles (obtained through procedure above) passing through a ring in a given event (color) plotted as a function of Ring number (x-axis) and primary vertex position (y-axis). The ring numbering system used here is RingID=0-15 means EPD East rings 1-16; RingID=16-31 means EPD West rings 1-16. For the record, Mate uses a different convention, and I translate before sending him this data.
»
- lisa's blog
- Login or register to post comments