Systematics and centrality dependence of dNch/deta
Updated on Thu, 2020-09-03 01:47. Originally created by mcsanad on 2020-09-02 07:49.
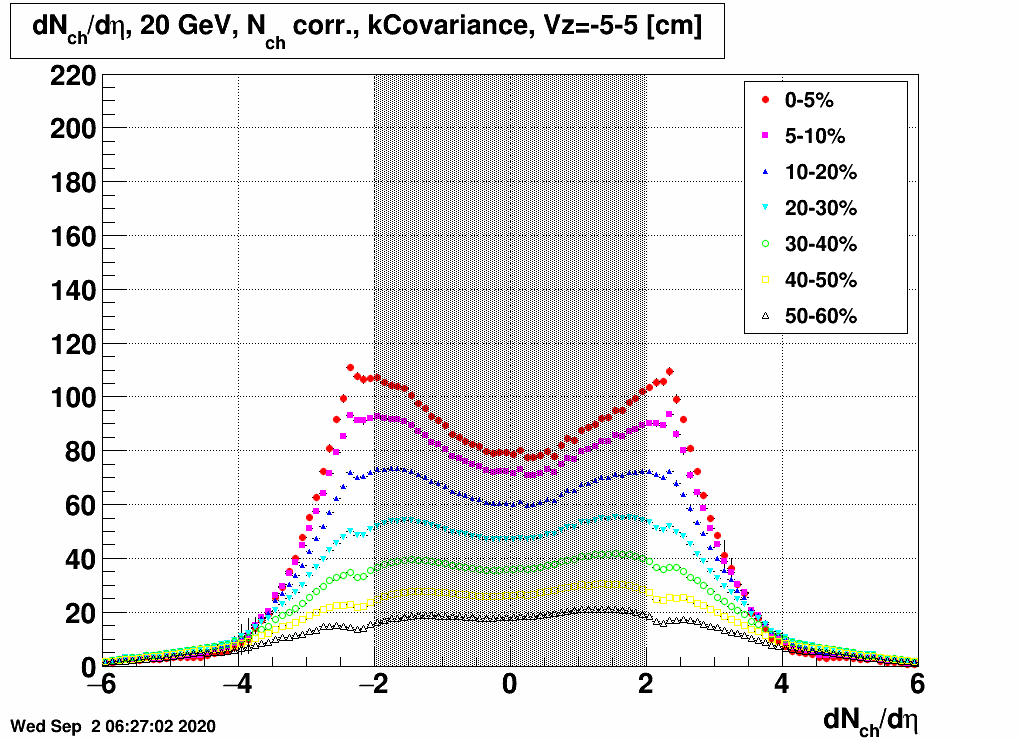
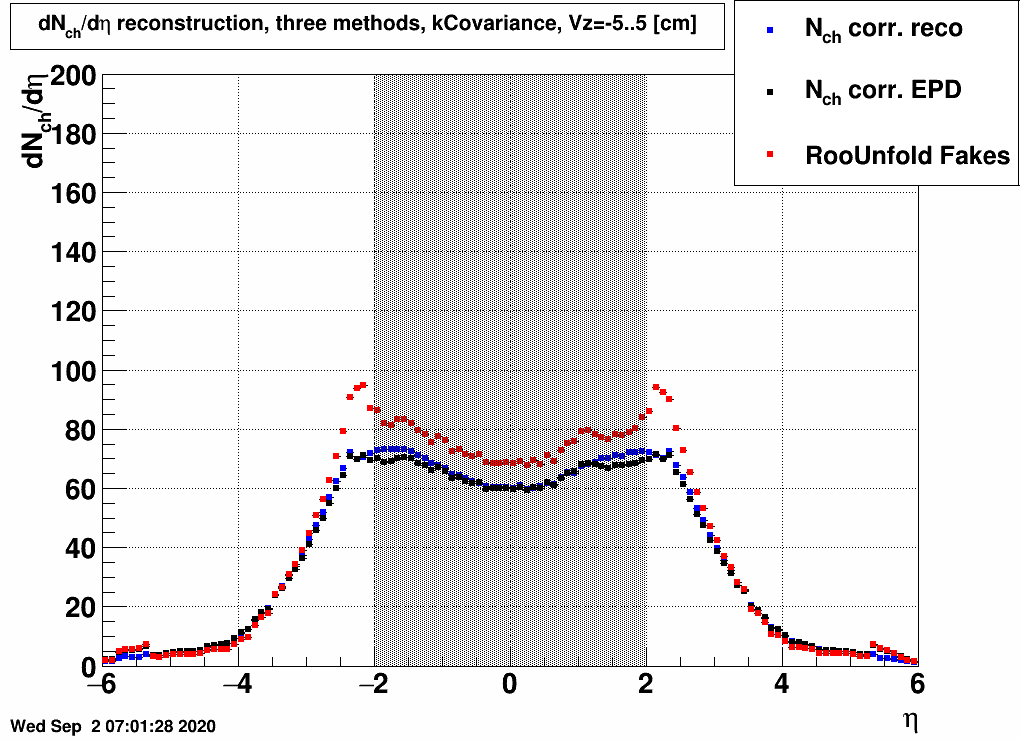
There is a grey band here to show that the midrapidity range is not to be considered, as it is outside EPD acceptance. Probably also the edge of the acceptance, 2.0-2.5 is a region where results are very uncertain, so the reader should keep this in mind for the rest of this blogpost.
Apparently in the EPD acceptance there is little dependence, except for the |eta|<2.5 range. This means that systematic uncertainties "blow up" when going towards the edge of the acceptance.
One shall note that two of the methods (where a charged/total factor is used before or after unfolding) yield very similar results, and RooUnfold's Fake() method yields also something similar, except for the edge of the acceptance.
There is apparently very little effect inside the EPD acceptance, but a huge effect in the |η|<2 region.
There is again little variation in the EPD range, except for the edge of the acceptance, and mainly for the charged particle fraction; somewhat for the refMult selection; and even there there is barely any change with varying Vz selection.
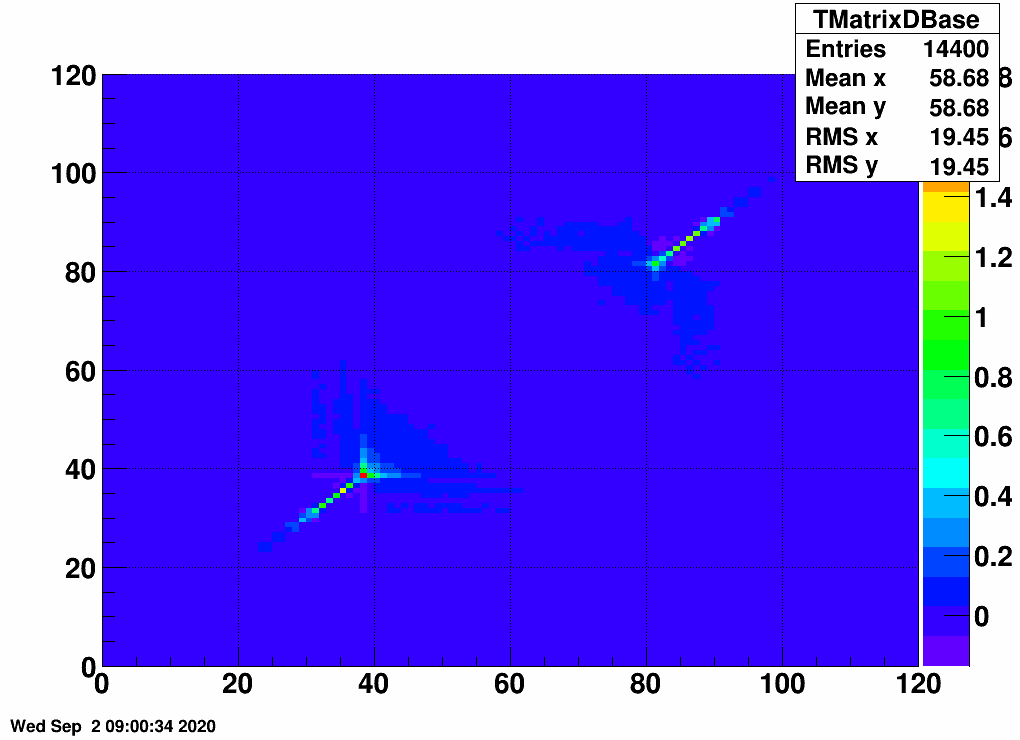
Clearly the statistical error bars are increased, and they may be comparable to the local fluctuation of the data points, although somewhat higher. This may mean that the uncertainties are correlated, as given by the covariance matrix. An example covariance matrix is visible here: which shows the correlation of the uncertainties:
Systematics and centrality dependence of dNch/dη
These previous blogposts dealt with extracting dN/dη from EPD data via unfolding:- Extracting dNch/dη from EPD data - July 29, 2020
- Unfolding EPD data with various response matrices - May 18, 2020
- What particles cause hits in the EPD? - May 13, 2020
- Testing the unfolding procedure with various input dN/deta distributions - May 5, 2020
- Unfolding dN/deta with RooUnfold - May 1, 2020
| FIG. 1: Centrality dependent dNch/dη from 20 GeV EPD data | FIG. 2: Centrality dependent dNch/dη from 27 GeV EPD data |
 |
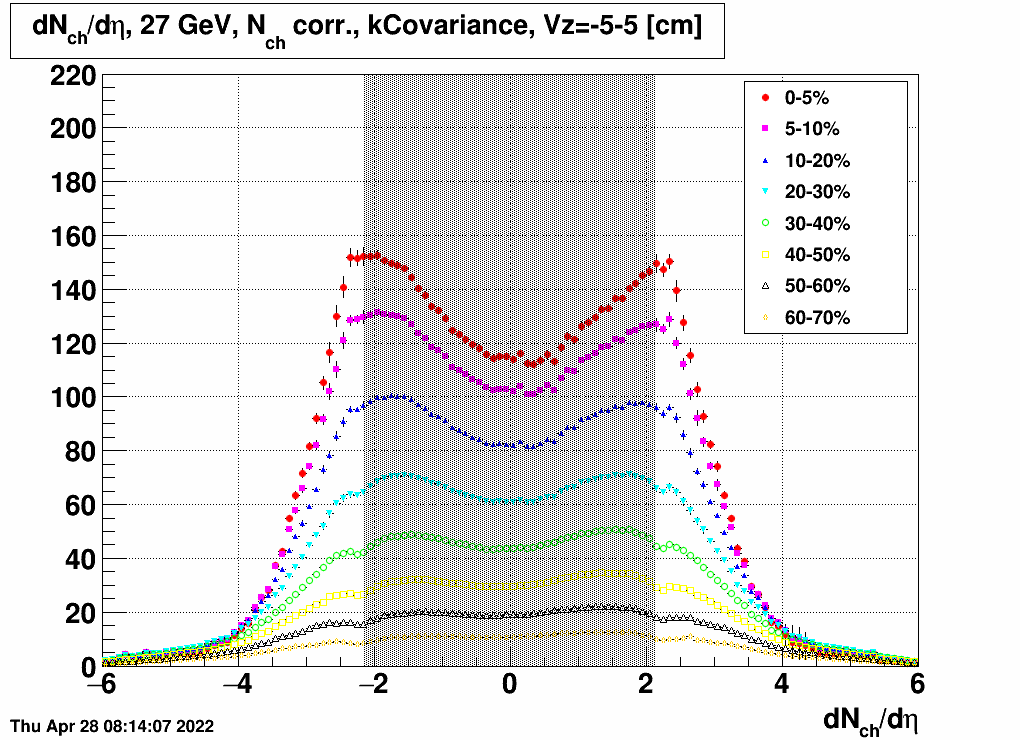 |
There is a grey band here to show that the midrapidity range is not to be considered, as it is outside EPD acceptance. Probably also the edge of the acceptance, 2.0-2.5 is a region where results are very uncertain, so the reader should keep this in mind for the rest of this blogpost.
Dependence on Vz selection
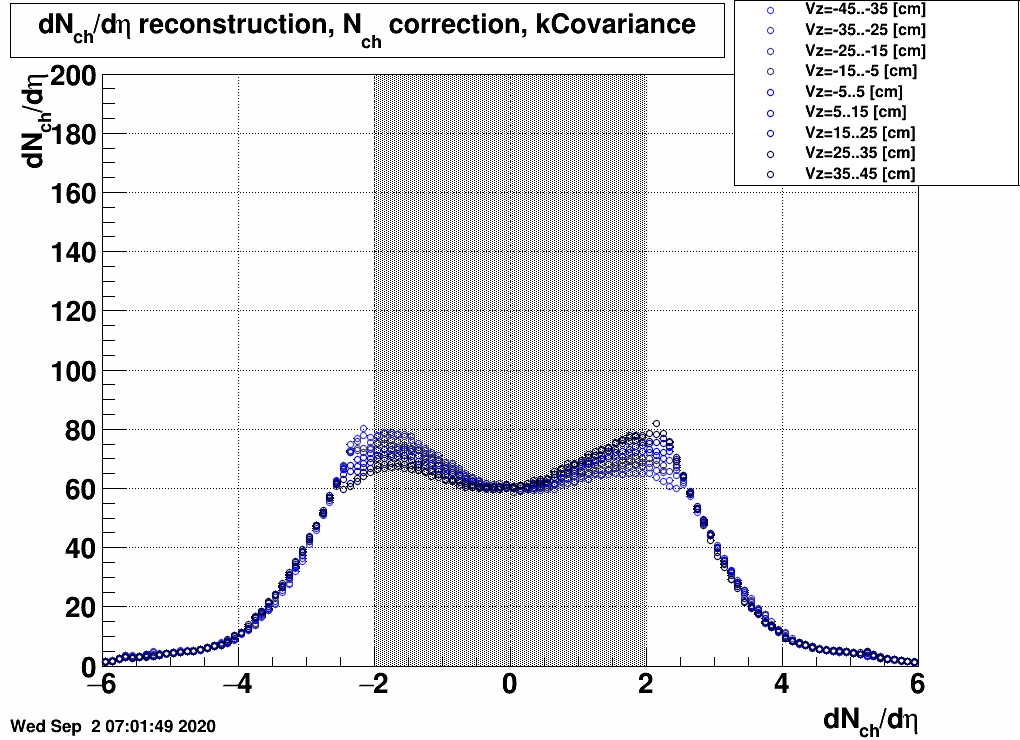
Since the tile hit by a particle with a given pseudorapidity depends on the collision vertex, it is important to check how much the reconstructed dN/dη distributions depend on the Vz selection.| FIG. 3: Vz bin dependence of dNch/dη at 20 GeV, 10-20% centrality |
FIG. 4: Vz bin dependence of dNch/dη at 27 GeV, 10-20% centrality |
 |
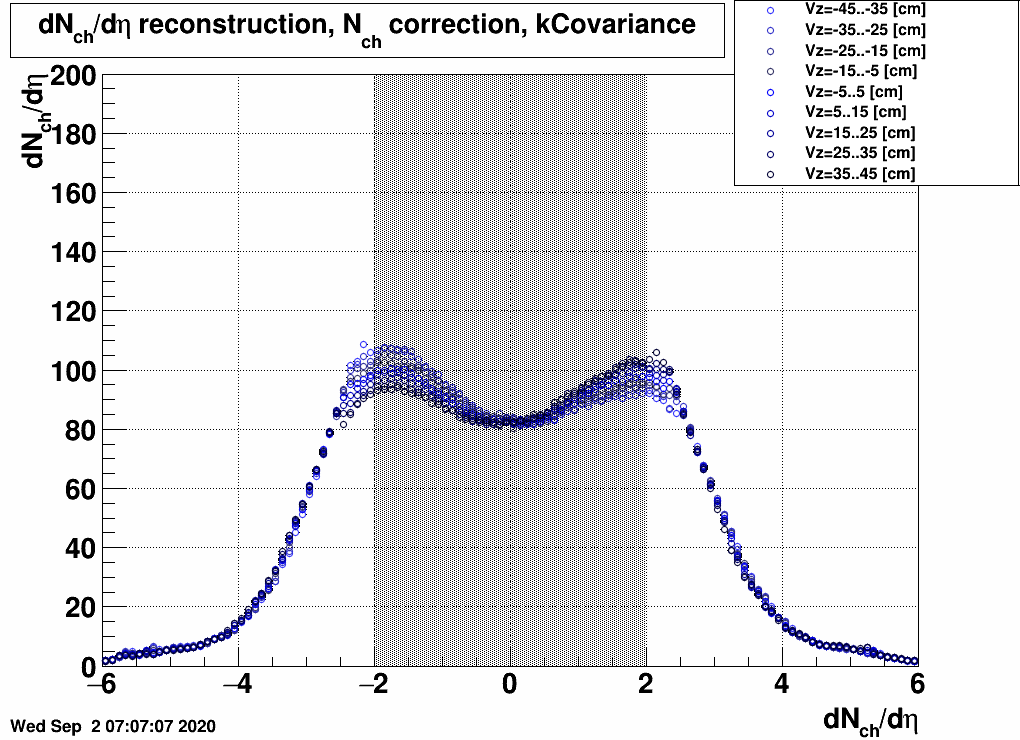 |
Apparently in the EPD acceptance there is little dependence, except for the |eta|<2.5 range. This means that systematic uncertainties "blow up" when going towards the edge of the acceptance.
Dependence on unfolding method
Clearly the unfolding/reconstruction method of charged particle distributions depends on how this is done. Three possible methods were discussed in an earlier blogpost, and the dependence of the results on this choice is also given here:| FIG. 5: Unfolding method dependence of dNch/dη at 20 GeV, 10-20% centrality | FIG. 6: Unfolding method dependence of dNch/dη at 27 GeV, 10-20% centrality |
 |
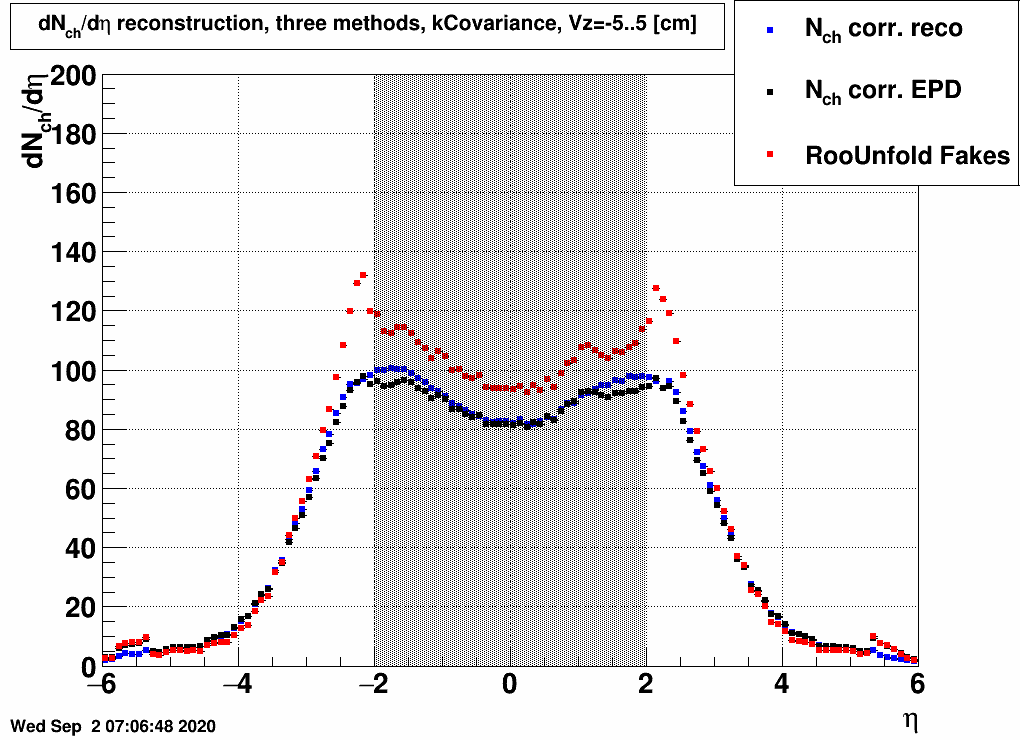 |
One shall note that two of the methods (where a charged/total factor is used before or after unfolding) yield very similar results, and RooUnfold's Fake() method yields also something similar, except for the edge of the acceptance.
Dependence on the input pseudorapidity distribution
The input dN/dη may have a large effect on the unfolded result. This was tested in two previous blogposts (this and this), but let me nevertheless show it again (for a slightly different EPD distribution, hence the overall scale is different, but anyway the relative change is the main point here).| FIG. 7: Input MC dN/dη dependence of unfolded dNch/dη at 27 GeV |
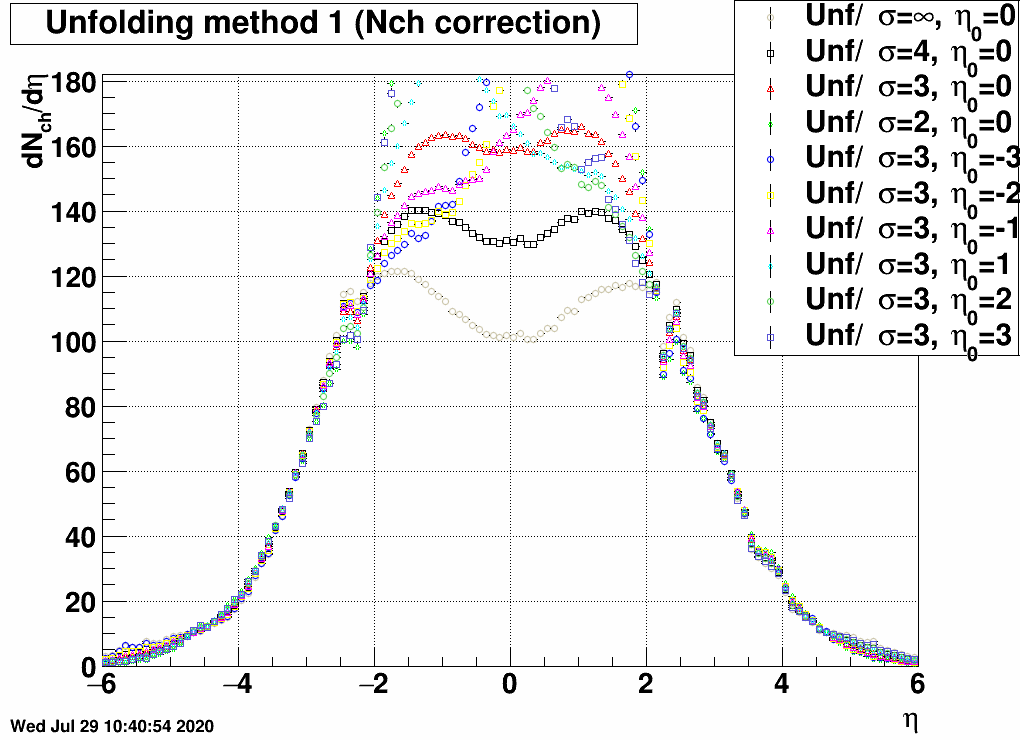 |
There is apparently very little effect inside the EPD acceptance, but a huge effect in the |η|<2 region.
Other systematic checks
There are some other settings the effect of which needs to be investigated. Four were tested:- refMult selection (+- 5%)
- Vz selection (+- 5 cm)
- fraction of neutral particles in the simulation (+-15% charged particles)
- pT slope in the simulation (increased/decreased from default, to reduce high/low pT particle content gradually by up to 40%)
| FIG. 8: A few other systematic effects on dNch/dη at 27 GeV |
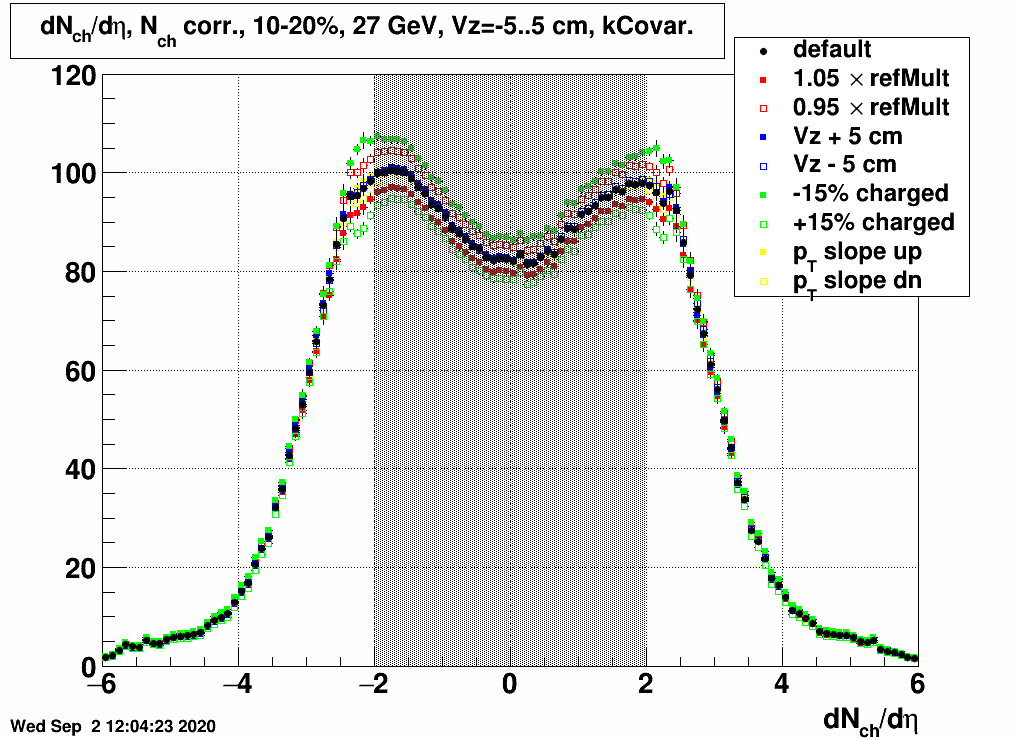 |
There is again little variation in the EPD range, except for the edge of the acceptance, and mainly for the charged particle fraction; somewhat for the refMult selection; and even there there is barely any change with varying Vz selection.
Checking the statistical uncertainties
The above plots contained very small error bars, and those were coming mainly from the unfolding. In the below plot we tested a case where the EPD data were only from a few thousand events (4500 after selections).| FIG. 9: Testing statistical uncertainties of unfolded dNch/dη at 27 GeV |
 |
Clearly the statistical error bars are increased, and they may be comparable to the local fluctuation of the data points, although somewhat higher. This may mean that the uncertainties are correlated, as given by the covariance matrix. An example covariance matrix is visible here: which shows the correlation of the uncertainties:
| FIG. 10: Covariance matrix of statistical uncertainties (of unfolded dNch/dη at 27 GeV) |
 |
»
- mcsanad's blog
- Login or register to post comments