Setting bias voltages for 2018 run (Bias scan)
Updated on Thu, 2018-05-10 05:08. Originally created by lisa on 2018-03-15 21:44.
Note: The numbers that I give below are Vset, not the true Vbias seen by the SiPM. The relationship between the two is, I believe, Vbias=Vset-0.9 V. Gerard will hopefully correct me if I'm wrong.
For visualization and for trigger algorithms, it is convenient if the MIP peaks in the tiles all occur at the same ADC value. We can achieve this by adjusting the bias voltage on the SiPMs.
Since the QT32Cs have higher effective gain than the QT32Bs, we equalize the gains of QT32B/C channels separately. I wanted to stay around 56 V, like last year, so found the average peak position at around 56 V, and then adjust voltage on each SiPM so the peak falls there. At the end, the intention is that the MIP peaks appear at ADC=160 for tiles 1-9 (QT32C) and at ADC=115 for tiles 10-31 (QT32B).
To determine the values:
All images here are taken from the big pdf file.
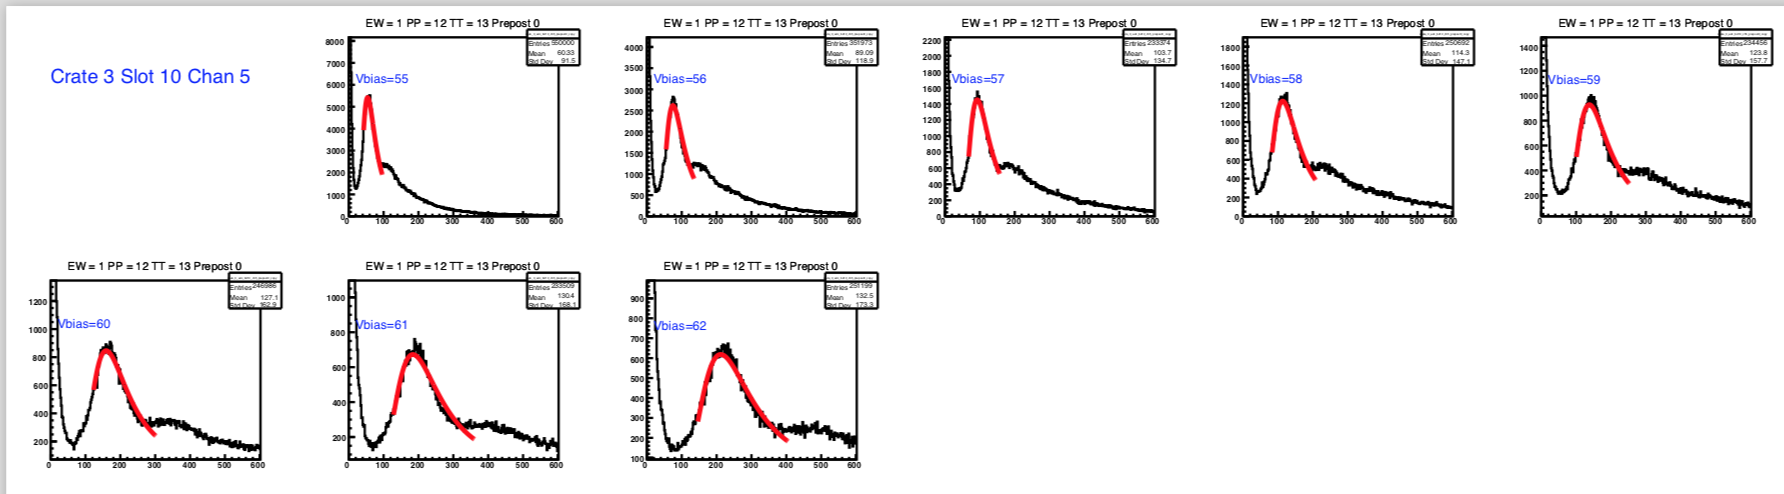
The ADC distribution for PP12TT13 on the West side, for Vbias=55,56,57...62 V. Red curves indicate Landau fits.
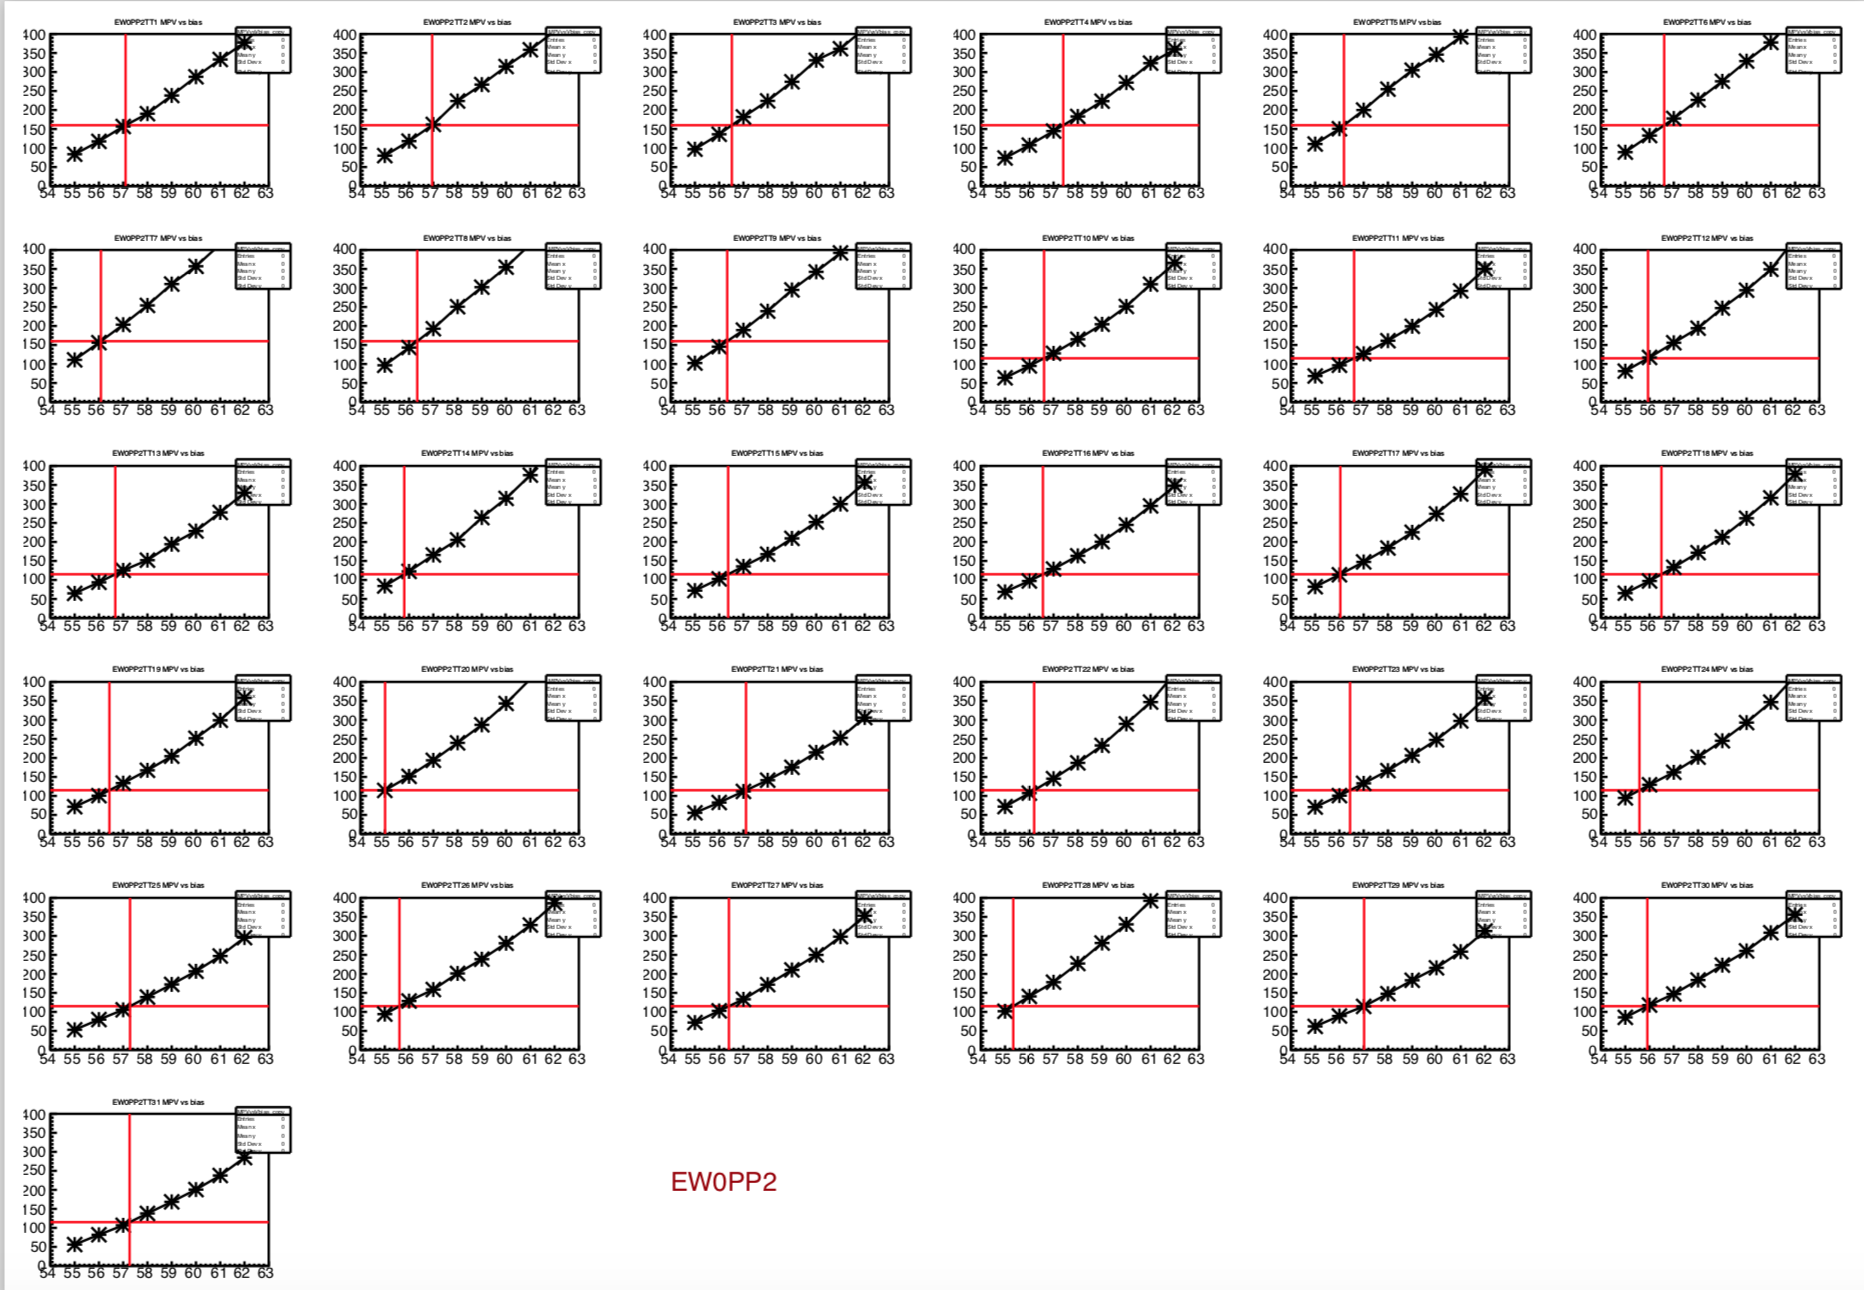
Landau peak position (MPV) is plotted as a function of Vbias, for the 31 tiles at position 02 on the East side. Horizontal lines indicate the "target" value, which is 160 for QT32Cs (tiles 1-9) and 115 for QT32B (tiles 10-31). The desired Vbias for a tile is where the horizontal line crosses the curve. The found Vbias is shown by the vertical line.
.png)
Vbias distribution for SiPMs read out through QT32Bs. The corresponding distribution for tiles read out through QT32Cs is similar.
Note: The numbers that I give below are Vset, not the true Vbias seen by the SiPM. The relationship between the two is, I believe, Vbias=Vset-0.9 V. Gerard will hopefully correct me if I'm wrong.
- update 5 April 2018 - Gerard reminds of the formula Vbias = (Vset+Vcomp)*(1 +/- ~2%) + 0.9 V, where we have Vcomp ~ 1.0-1.2 V
For visualization and for trigger algorithms, it is convenient if the MIP peaks in the tiles all occur at the same ADC value. We can achieve this by adjusting the bias voltage on the SiPMs.
Since the QT32Cs have higher effective gain than the QT32Bs, we equalize the gains of QT32B/C channels separately. I wanted to stay around 56 V, like last year, so found the average peak position at around 56 V, and then adjust voltage on each SiPM so the peak falls there. At the end, the intention is that the MIP peaks appear at ADC=160 for tiles 1-9 (QT32C) and at ADC=115 for tiles 10-31 (QT32B).
To determine the values:
- Using our final gate settings and under stable beam settings, we took a series of 8 runs of about 150k triggers. Vbias was the same for all SiPMs in a run, and we varied Vbias from 55 to 62 V, in one-volt steps. So, 8 runs. Run numbers and settings can be found on page 1 of the big pdf. Justin & Joey took this data in the wee hours of 15 March.
- Rosi has developed a procedure to produce the ADC histograms from the .dad files. She has posted the details here. This is exactly the same macro used to make the histos used in the timing scan analysis.
- Then this macro (in vanilla root) is run on the histograms. The macro is not elegant, I'm afraid, and I'm tempted to not post until it's pretty. But better to post now and update later.
- the peaks are fit with Landau
- the MPV is plotted versus bias voltage
- if the relationship is monotonically increasing (as expected), interpolation is used, to find the Vbias that will produce the desired peak position
- if the result is nonmonotonic (rare, and always the result of a fit gone wrong) or if the indicated Vbias seems to be beyond the range of voltages measured, a flag is thrown and a human has to edit that line of the output file
- A file is produced (get it here) that can be uploaded to the TUFF through the GUI
- You also get a 835-page pdf file, suitable for binding, with all fits, interpolations, WID/MPV, Vbias distributions, etc. Get yours here.
All images here are taken from the big pdf file.
The ADC distribution for PP12TT13 on the West side, for Vbias=55,56,57...62 V. Red curves indicate Landau fits.
Landau peak position (MPV) is plotted as a function of Vbias, for the 31 tiles at position 02 on the East side. Horizontal lines indicate the "target" value, which is 160 for QT32Cs (tiles 1-9) and 115 for QT32B (tiles 10-31). The desired Vbias for a tile is where the horizontal line crosses the curve. The found Vbias is shown by the vertical line.
Vbias distribution for SiPMs read out through QT32Bs. The corresponding distribution for tiles read out through QT32Cs is similar.
»
- lisa's blog
- Login or register to post comments