Uniformity (and nonuniformity) ring-by-ring
Updated on Wed, 2018-05-09 22:03. Originally created by lisa on 2018-05-09 09:20.
There have been several studies of the uniformity of the EPD response. Now that we really get into the fine details, I came up with another representation that I think is best. Those who complain about looking at "postage stamps" may want to go do something else. The fact is, you're either gonna look at the data, or you are not. Looking at "average ADC" on a polar plot (like QA plots) or even Landau fit parameters is crude, good for catching large errors. But that's all.
Please look at the pdf file attached to this page. I recommend to download it and "flip" through it page-by-page, rather than scrolling continuously on your browser.
There is one page for each ring. With 16 rings (composed of 12 or 24 tiles all at the same radius) on each side, there are 32 pages to look at. In each panel, I plot the average ADC distribution for that ring, as a thick grey histogram. (The thickness only approximately represents the spread of the data, and is meant as a reference only.) The ADC distribution for a given tile is plotted on top of this average.
The root macro used for this study is here: drupal.star.bnl.gov/STAR/system/files/ExamineAdcDists.C_0.txt
Some points:
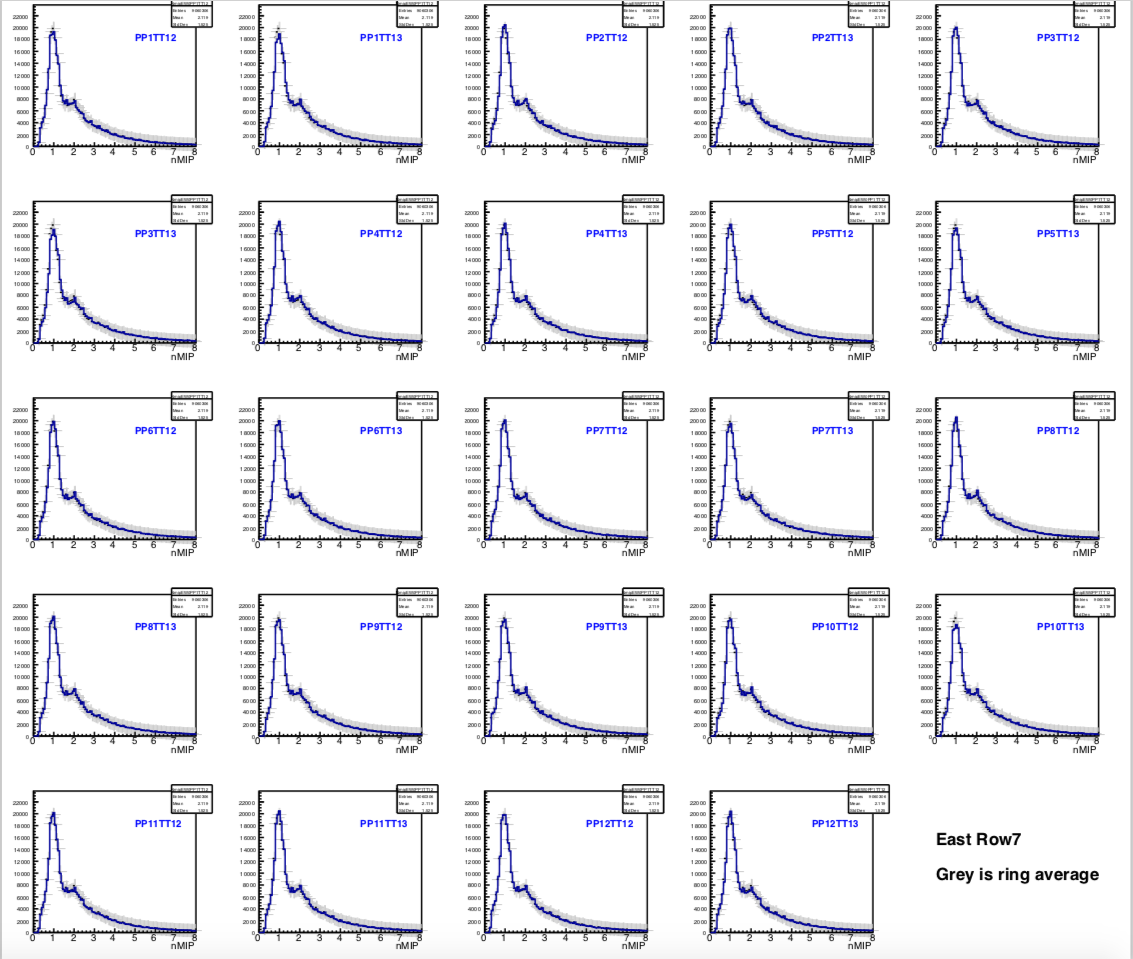
Figure 1. Ring 7 (aka row 7) of the East-side EPD consists of tiles TT12-13, 24 tiles in all. The ADC distribution of each individual tile is plotted on top of a grey histogram, which is the same in each panel. The grey histogram is the average of all the tiles in the ring. Not only the average and the normalization, but every detail of the ADC distribution is the same, tile-to-tile. (Note that aliasing generates small "peaks" at regular intervals. This is a trivial effect of binning; ignore.)
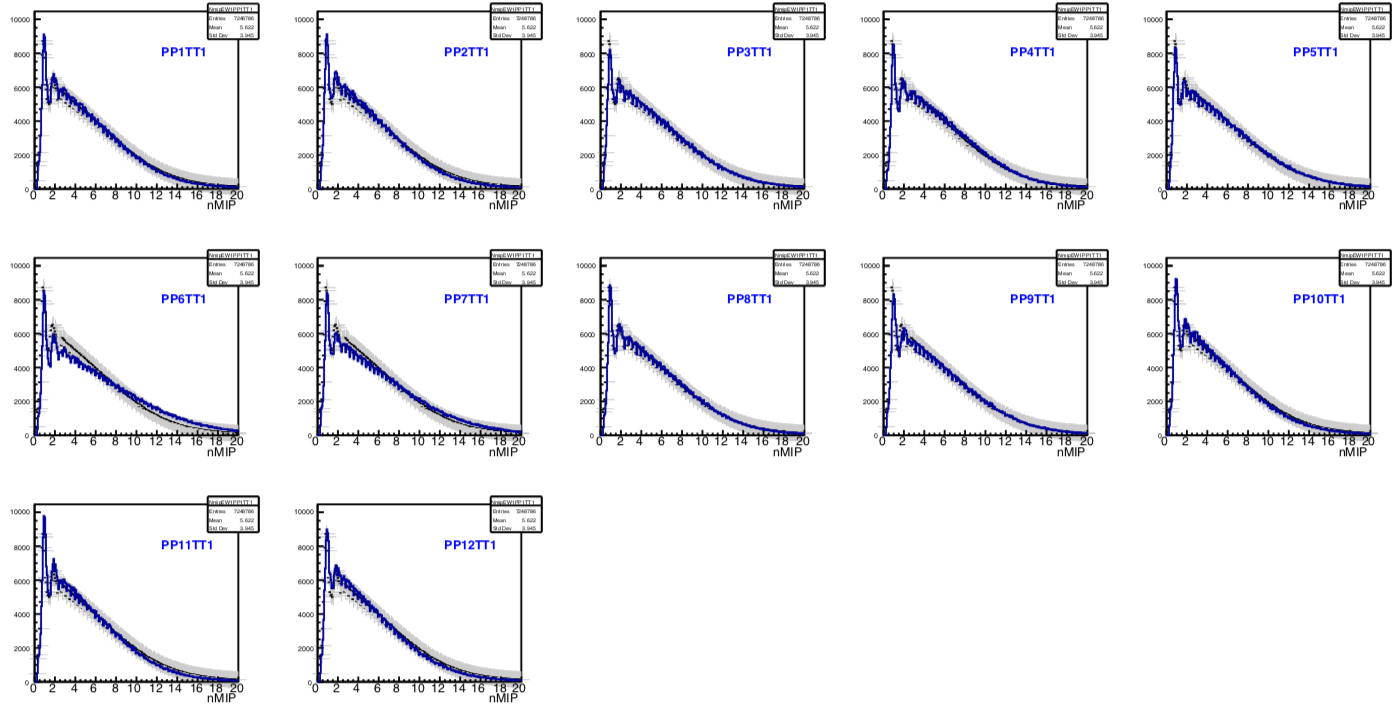
Figure 2. West ring 1 is composed only of TT01 from the twelve supersectors. Note the extended x-axis range. PP06 and PP07 (which sit at "5:30 and 6:30" on the faces of an analog clock, respectively) clearly show reduced nMIP=1 and enhanced nMIP>1 yield. I believe this is due to the fixed-target mount, as discussed above.
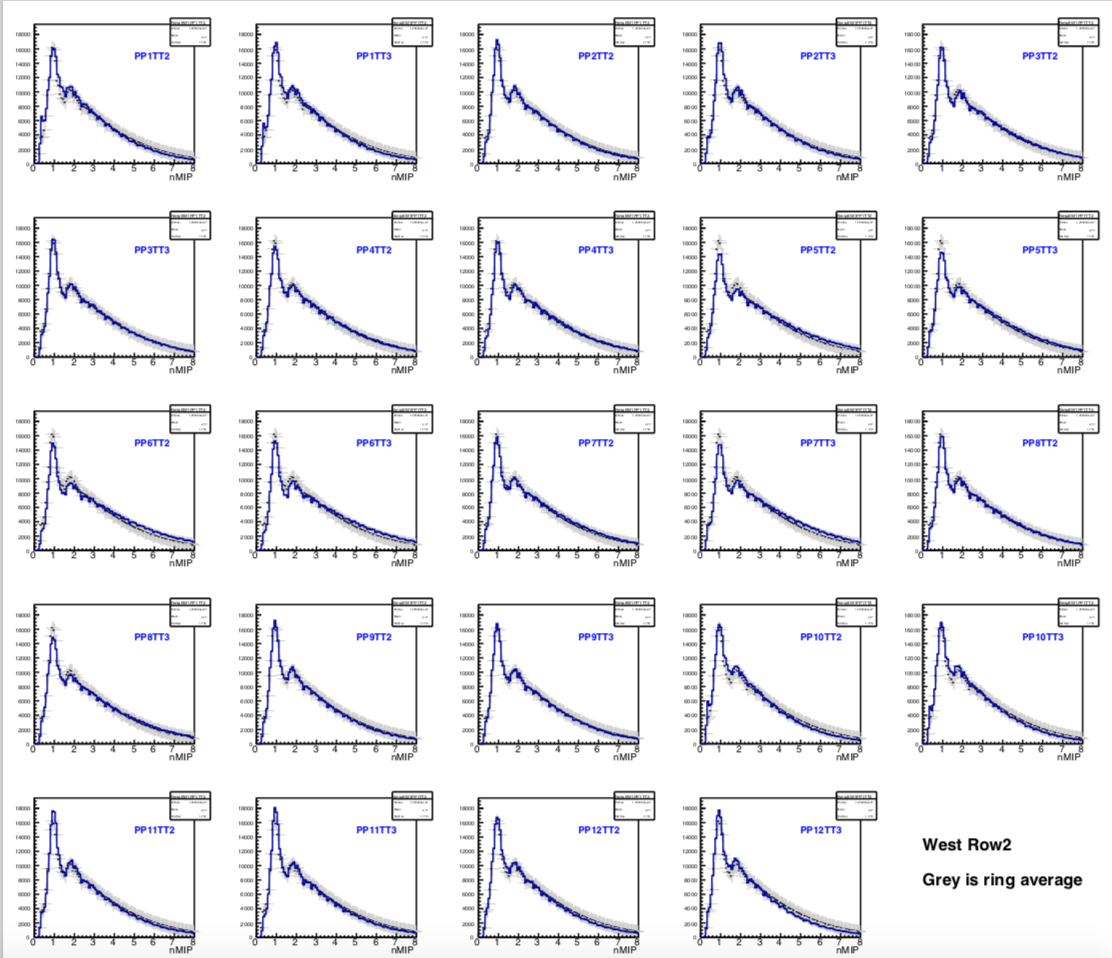
Figure 03 - West Ring 02, composed of TT02 and TT03. As in figure 2 (but to a lesser extent) tiles in PP06 and PP07 show excess yield in the high-nMIP region. Again, I attribute this to scattering in the fixed-target frame.
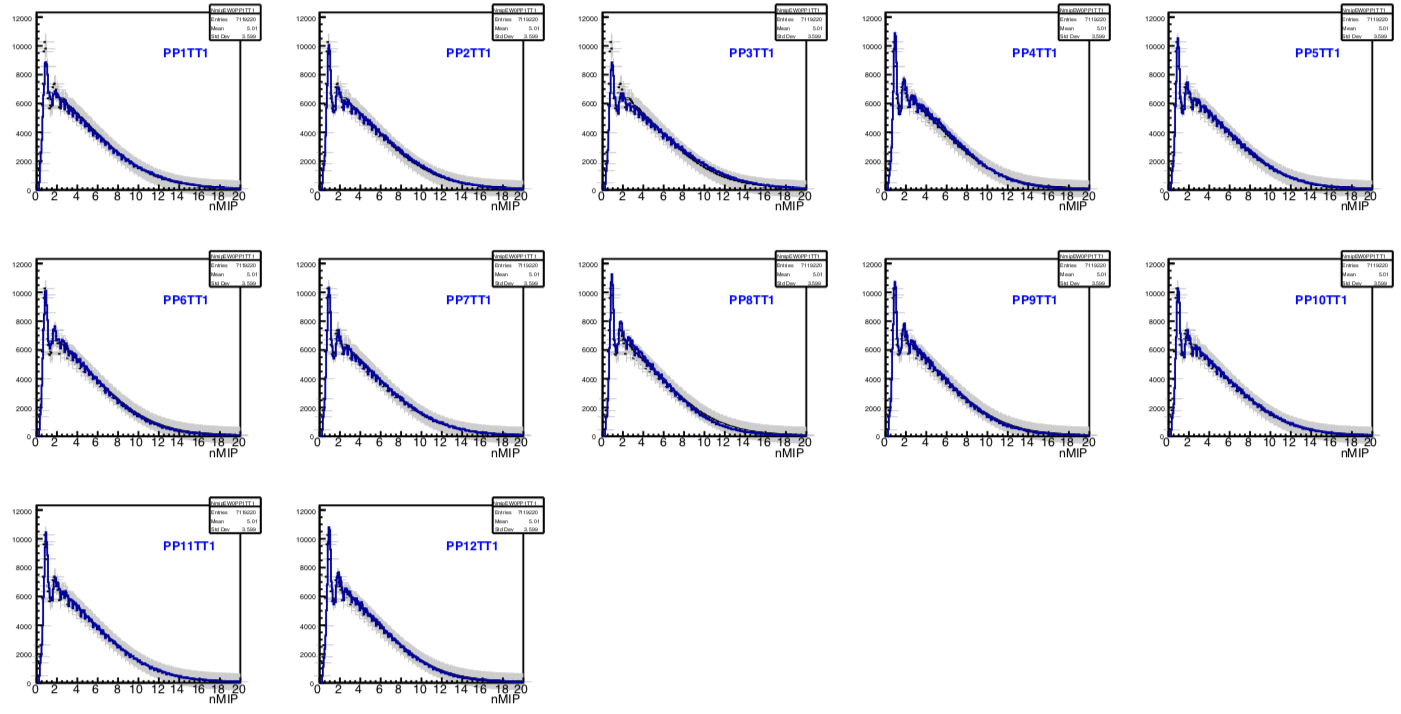
Figure 4 - East ring 01. A slight increase in the high-nMIP tail is observed at positions PP01 and PP03. But not really PP02???
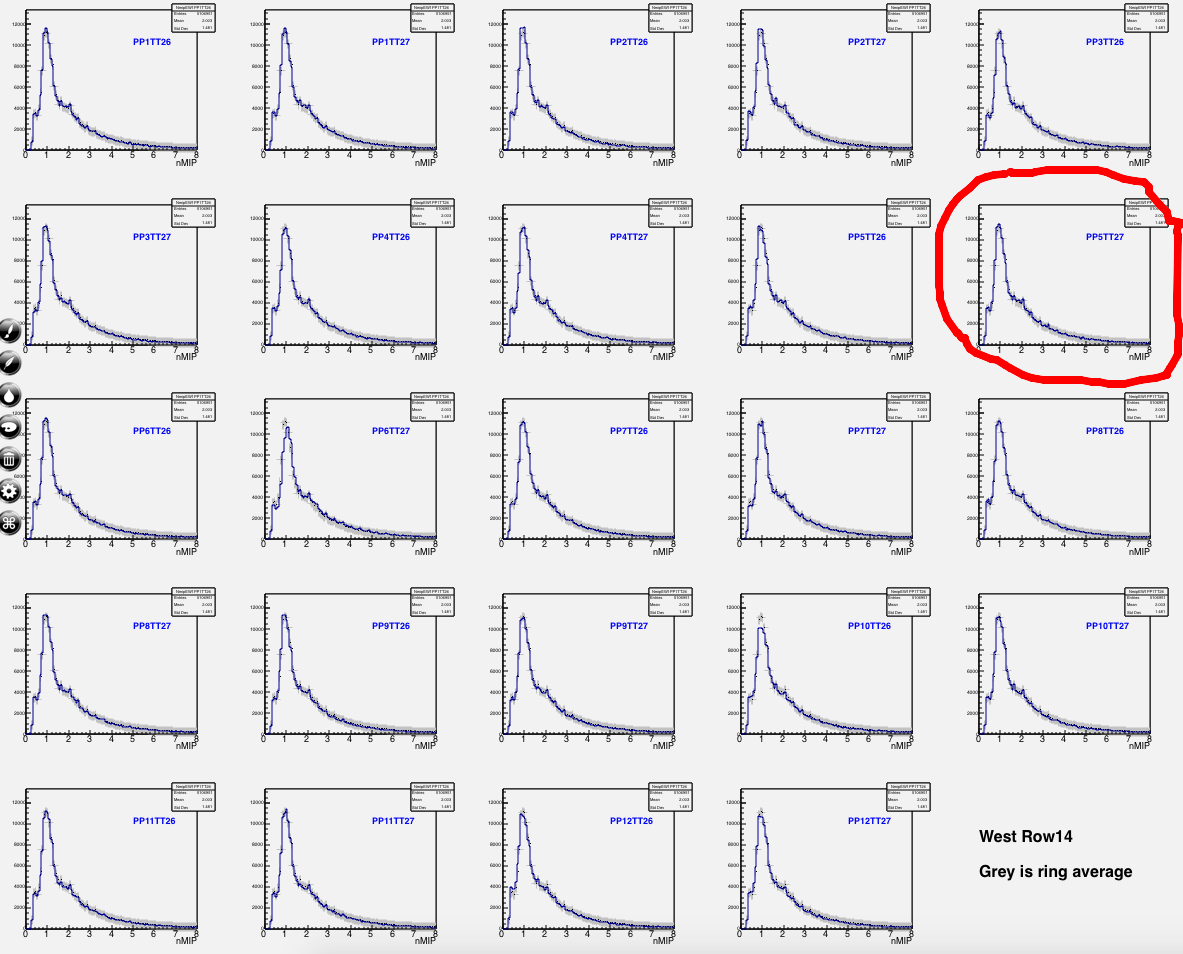
Figure 5 - West PP05TT27, which has shown high dark current and instability in IV scans, looks just like one would expect.
Please look at the pdf file attached to this page. I recommend to download it and "flip" through it page-by-page, rather than scrolling continuously on your browser.
There is one page for each ring. With 16 rings (composed of 12 or 24 tiles all at the same radius) on each side, there are 32 pages to look at. In each panel, I plot the average ADC distribution for that ring, as a thick grey histogram. (The thickness only approximately represents the spread of the data, and is meant as a reference only.) The ADC distribution for a given tile is plotted on top of this average.
The root macro used for this study is here: drupal.star.bnl.gov/STAR/system/files/ExamineAdcDists.C_0.txt
Some points:
- As observed in other studies, the overall uniformity-- in detail (not just averages, etc)-- is stunning. Figure 1 below shows a typical ring.
- Careful study shows that the ADC spectra change gently as one goes from one ring to the next, but the change is noticeably larger between rings 5 and 6. In particular, the number of Nmip>1 events jumps when looking at ring 5 (containing TT08 and TT09). I note that the BBC sits like 2 inches immediately behind EPD rings 1-5, so I have the question: could we be seeing "back-scatter" contributions from the BBC, in EPD rings 1-5? Hopefully Mate/Roland/Prashanth can say something about this, from the simulation side.
- Examining the innermost rings in some detail, one does sees systematic non-uniformity:
- On the West side, the tiles around 6 o'clock have a suppressed one-nMIP peak, and excess large-nMIP tail. Figures 2 and 3 below show this. Recalling that the supersector positions follow approximately the numbering on an analog clock, this explains the very large anisotropy seen in the raw first-order EP distributions (see figure 1 of this page), where the West-side event-plane points preferentially "down." This was also first observed in this early study where the excess is attributed to the fixed-target holder.
- On the East side, the tiles in positions PP01 and PP03 show an excess of nMIP>1 tail, though the effect is much less than the West-side effect discussed above. See figure 4 below. The origin of this excess is not known-- is there some material in the "up" direction on the East side?? In any event, this is probably the source of the anisotropy of the East-side raw first-order EP distribution shown in figure 1 of this page. As seen on that page, the anisotropy is much less than on the West side.
- It is also mysterious why to see an excess in PP01 and PP03, but not PP02.... See figure 4.
Figure 1. Ring 7 (aka row 7) of the East-side EPD consists of tiles TT12-13, 24 tiles in all. The ADC distribution of each individual tile is plotted on top of a grey histogram, which is the same in each panel. The grey histogram is the average of all the tiles in the ring. Not only the average and the normalization, but every detail of the ADC distribution is the same, tile-to-tile. (Note that aliasing generates small "peaks" at regular intervals. This is a trivial effect of binning; ignore.)
Figure 2. West ring 1 is composed only of TT01 from the twelve supersectors. Note the extended x-axis range. PP06 and PP07 (which sit at "5:30 and 6:30" on the faces of an analog clock, respectively) clearly show reduced nMIP=1 and enhanced nMIP>1 yield. I believe this is due to the fixed-target mount, as discussed above.
Figure 03 - West Ring 02, composed of TT02 and TT03. As in figure 2 (but to a lesser extent) tiles in PP06 and PP07 show excess yield in the high-nMIP region. Again, I attribute this to scattering in the fixed-target frame.
Figure 4 - East ring 01. A slight increase in the high-nMIP tail is observed at positions PP01 and PP03. But not really PP02???
Figure 5 - West PP05TT27, which has shown high dark current and instability in IV scans, looks just like one would expect.
»
- lisa's blog
- Login or register to post comments