EP resolution with the EPD and BBC
Updated on Tue, 2018-05-08 14:28. Originally created by lisa on 2018-05-08 13:50.
Here I collect some studies of EP resolution and flatness, using the isobar data.
There have been previous studies by me, Joey, and Isaac. ShinIchi Esumi has also posted a nice study with similar results.
The EP resolution for n=1 gets as high as 0.27 and for n=2 it gets to about 0.37. The picture is less clear for n=3 (as is the very definition of "the" third-order plane, I would say.....)
Standard method:
I calculate the Q-vector, treating all "rings" and eta regions equally, as:
This done, the EP angle is \Psin = atan2(Qy,n,Qx,n) / n
In each of the following plots, 3.5M minbias isobar collisions were used. Centrality cuts were set by Isaac when he made his poster. See plot at the top of this page: drupal.star.bnl.gov/STAR/blog/iupsal/qm2018-epd-poster-abstract
The only real cut is on primary vertex:
The middle panels correspond to the 10-40% most central collisions as well. On the left is East EPD and on the right is West EPD. Red line shows EP distribution before "shifting" procedure is applied. Blue is EP distribution after "shifting." (I shift up to order 20, here.) The shifting constants are obtained in a prior run through the data and are done per centrality class and per wheel.
I am NOT calculating/using different shifting constants as a function of day or as a function of Vz. These could certainly help.
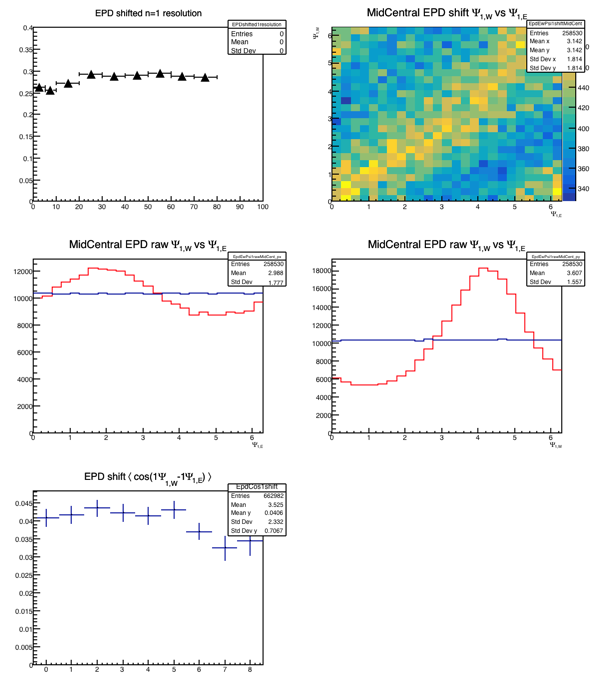
Figure 1 - n=1 EP. (For n=1, the EP on the East side is explicitly rotated by pi. That is, we are looking for the "rapidity-odd" 1st order plane. This is the standard, even if it's not explicitly stated.)
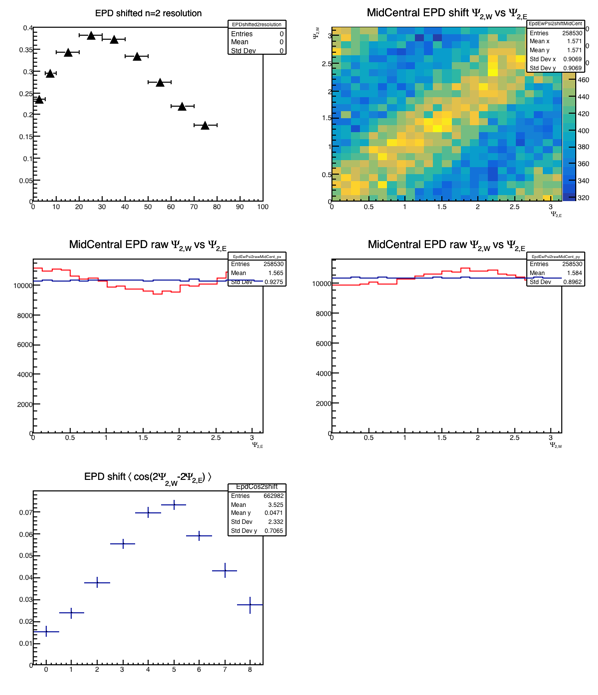
Figure 2 - n=2 EP
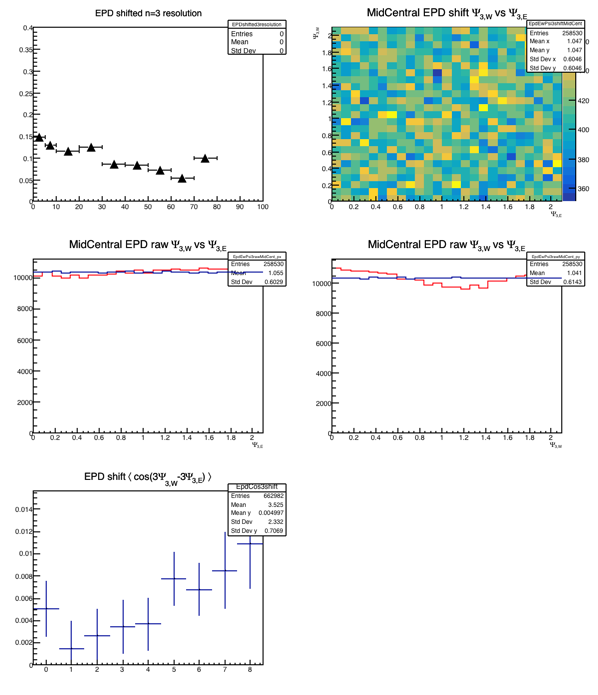
Figure 3 - n=3 EP
There have been previous studies by me, Joey, and Isaac. ShinIchi Esumi has also posted a nice study with similar results.
The EP resolution for n=1 gets as high as 0.27 and for n=2 it gets to about 0.37. The picture is less clear for n=3 (as is the very definition of "the" third-order plane, I would say.....)
Standard method:
I calculate the Q-vector, treating all "rings" and eta regions equally, as:
Qx,n = Sum{ wi * cos(n*phii)}
Qy,n = Sum{ wi * sin(n*phii)}
where the Sum is over tiles (with subscript i) and the tile's weight in an event is based on its nMIP (calibrated ADC) value, subject to a threshold and a MAX value (details):
I use threshold=0.3 to remove "dark/out-of-time" signal and MAX=3 to suppress irresolution due to Landau fluctuations.wi = 0 if nMIP < threshold
wi = MAX if nMIP > MAX
wi = nMIP otherwise
This done, the EP angle is \Psin = atan2(Qy,n,Qx,n) / n
In each of the following plots, 3.5M minbias isobar collisions were used. Centrality cuts were set by Isaac when he made his poster. See plot at the top of this page: drupal.star.bnl.gov/STAR/blog/iupsal/qm2018-epd-poster-abstract
The only real cut is on primary vertex:
- |Vz| < 50 cm
- Vperp < 1 cm
- VPD and TPC vertex must agree to within 6 cm. (Thanks Rosi for this clean-up cut)
The middle panels correspond to the 10-40% most central collisions as well. On the left is East EPD and on the right is West EPD. Red line shows EP distribution before "shifting" procedure is applied. Blue is EP distribution after "shifting." (I shift up to order 20, here.) The shifting constants are obtained in a prior run through the data and are done per centrality class and per wheel.
I am NOT calculating/using different shifting constants as a function of day or as a function of Vz. These could certainly help.
Figure 1 - n=1 EP. (For n=1, the EP on the East side is explicitly rotated by pi. That is, we are looking for the "rapidity-odd" 1st order plane. This is the standard, even if it's not explicitly stated.)
Figure 2 - n=2 EP
Figure 3 - n=3 EP
»
- lisa's blog
- Login or register to post comments