Max nmip and the correlation between the total nmip on the West and East side of EPD
Updated on Thu, 2018-05-03 17:00. Originally created by lxy1122 on 2018-05-03 13:11.
.png)
Mike improved the resolution of the event plane by putting a maximum constraint on the weight(nmip) when calculating the Q-vectors: drupal.star.bnl.gov/STAR/blog/lisa/event-plane-detector-sees-event-plane-and-other-quantities
'mips' represents the 'minimum ionizing particles' and 'nmip' is the calibrated ADC.The nmip distribution on each tile is a Landau distribution and the 'tail' can run to 70 or even higher. In this study, I set a maximum value for the nmip on each tile, i.e. nmip remains its value if it is smaller than or equal to the maximum value and nmip equals max if it is larger than the maximum value. Then I drew the 2D histogram where the Y axis is the total nmip on the West side and the X axis is the total nmip on the East side. The same histograms were plotted setting the maximum value to 1, 2, 3, 4, 6, 8, 10 as well as without any maximum value on the nmip. Afterwards, I calculated the Pearson correlation coefficient for each plot and see how setting a maximum value for the nmip will influence the correlation between the total nmip on the west and east side. Around 300 events from Round 096 and 098 were used.
nmip on the West side vs nmip on the East side
max=1 max=2
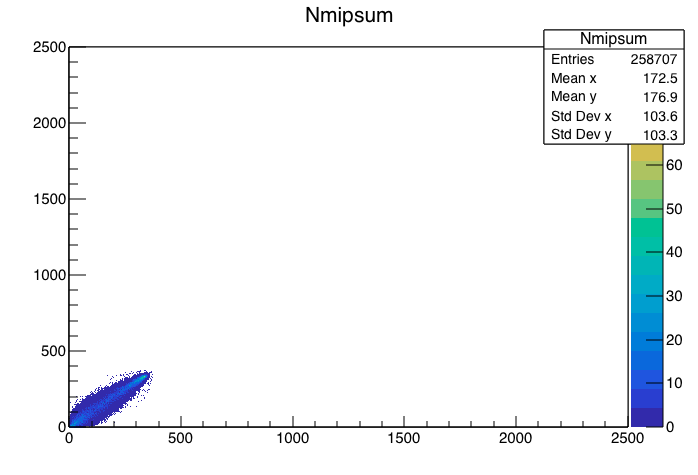
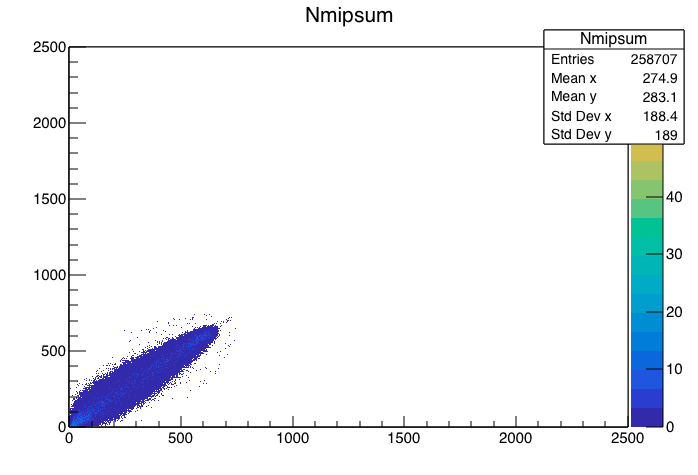
max=3 max=4
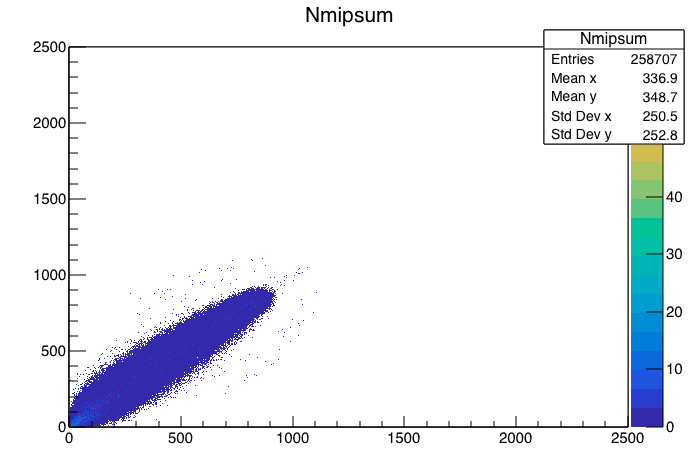
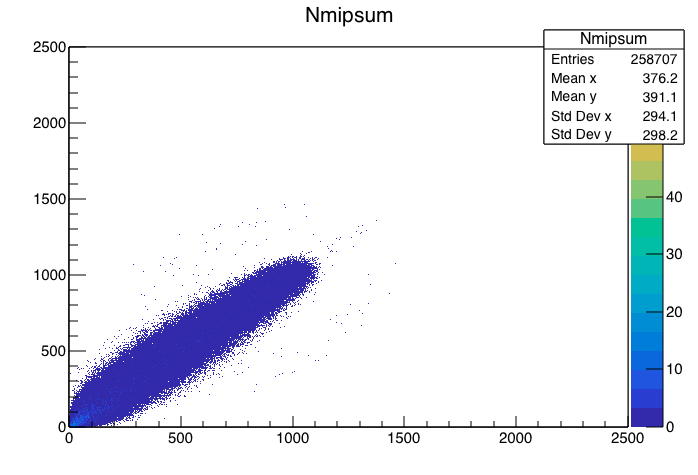
max=6 max=8
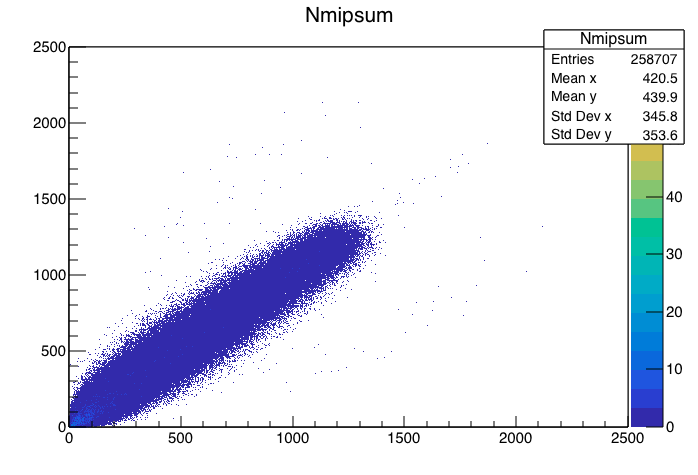
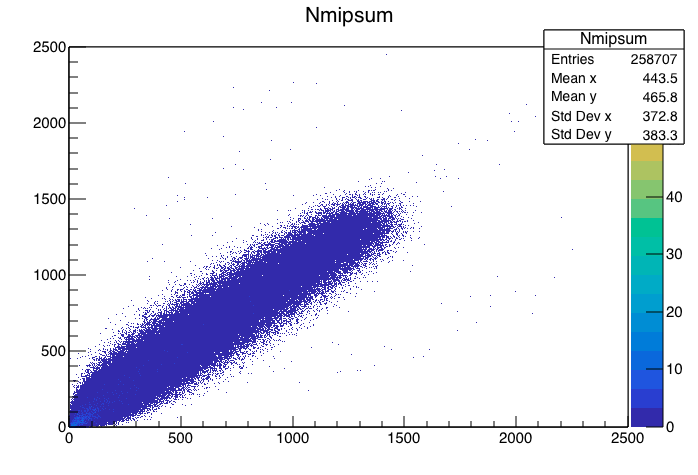
max=10 no maximum value
.png)
.png)
The Pearson coefficient is


max=3 max=4


max=6 max=8


max=10 no maximum value
.png)
.png)
The Pearson coefficient is
.png)
When r is closer to one, it means X and Y are more correlated.
This table shows the Pearson correlation coefficient(r) vs the maximum value on the nmip. What is not shown on the table is when there is no max nmip, r = 0.952984289.
.png)
As shown on the above table, the difference that the maximum nmip made on the correlation between the total nmip on the west and east side are very small, setting the max nmip to 2 did slightly increase the correlation though.
»
- lxy1122's blog
- Login or register to post comments
