Testing the unfolding procedure with various input dN/deta distributions
Testing the unfolded rapidity distributions
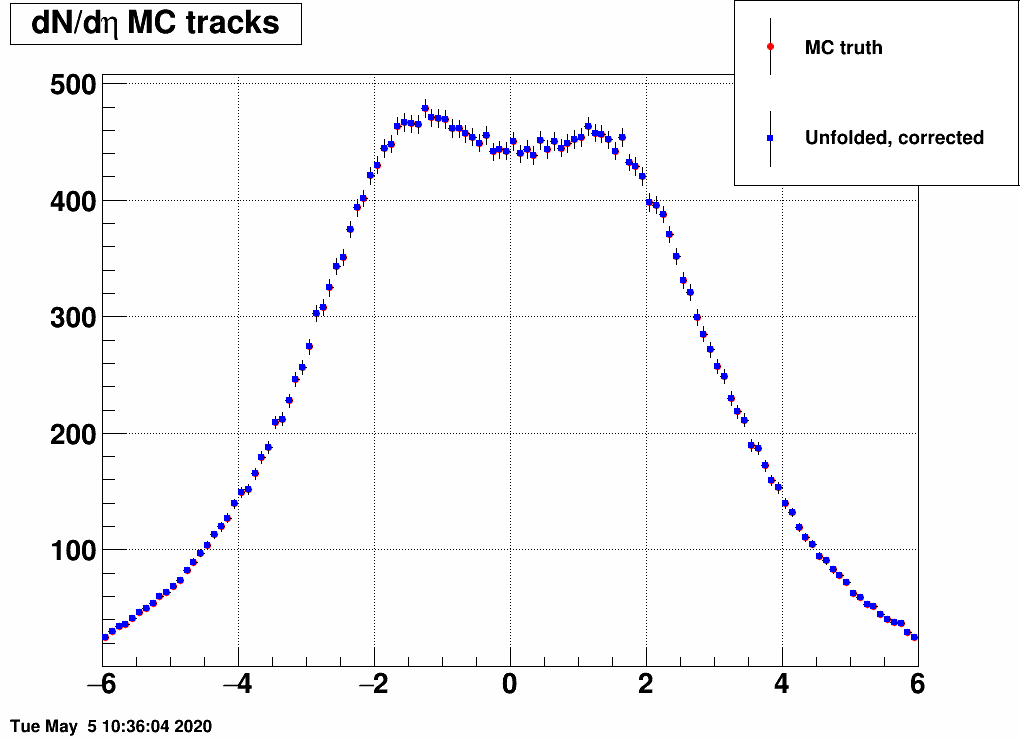
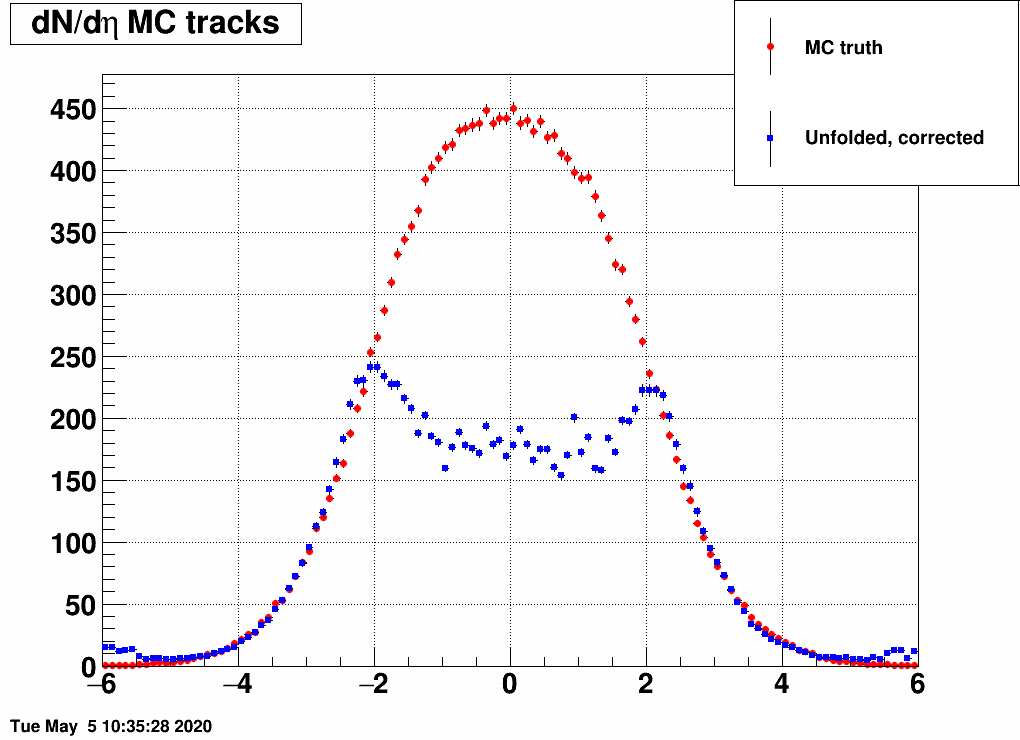
As noted in the previous blogpost, dN/deta is "too well" reproduced by the unfodling algorithm, especially if one feeds the same EPD distribution to it as what was used to generate the response matrix. Here is a comparision, where the MC truth dN/deta and the unfolded dN/deta overlap point by point:
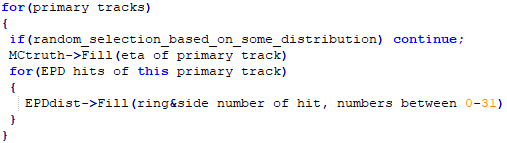
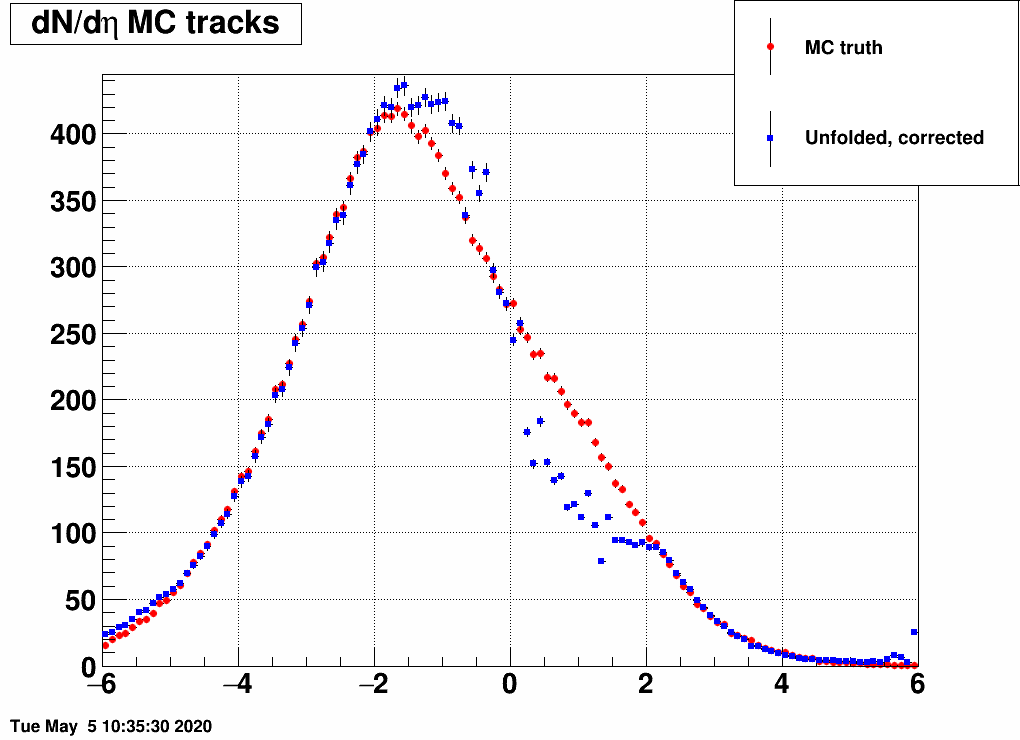
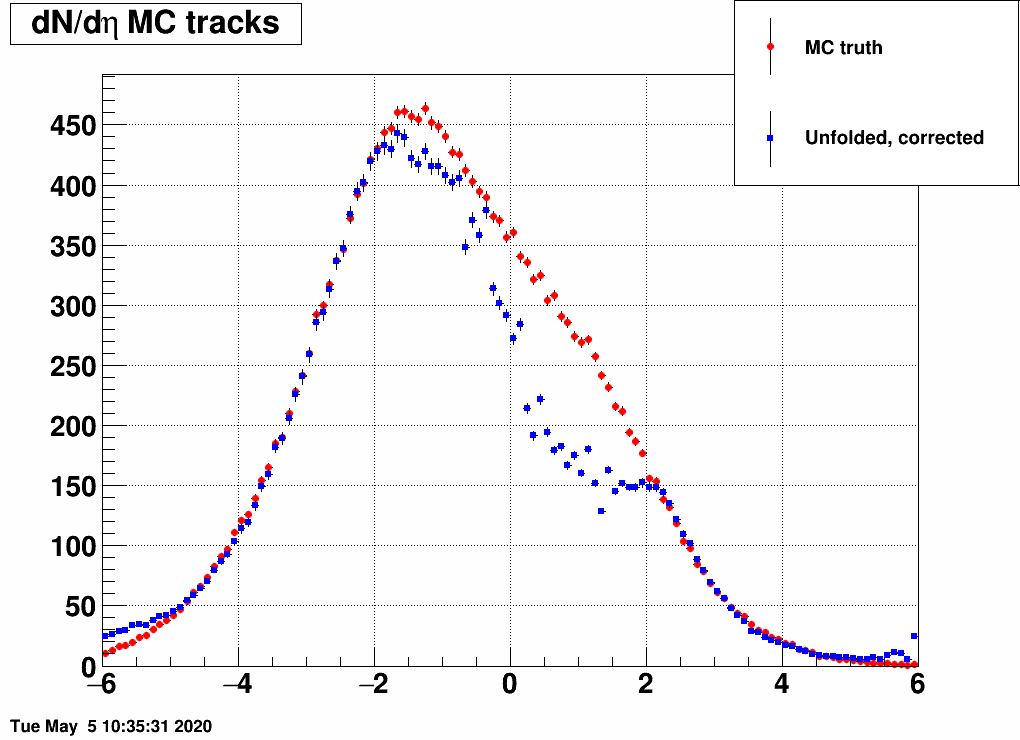
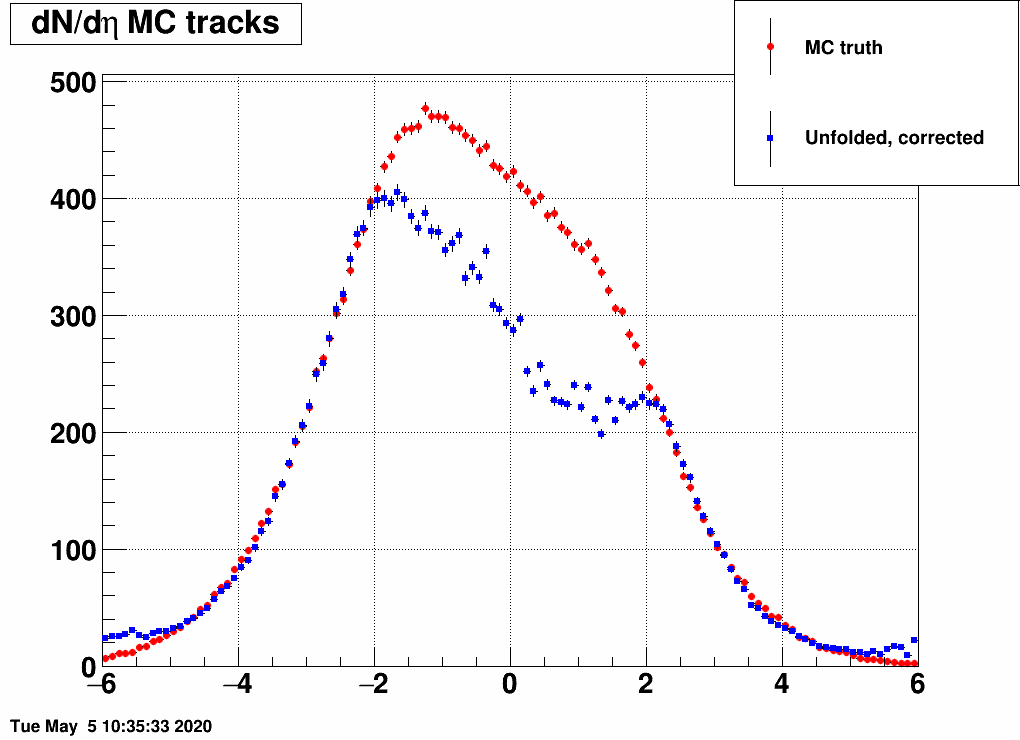
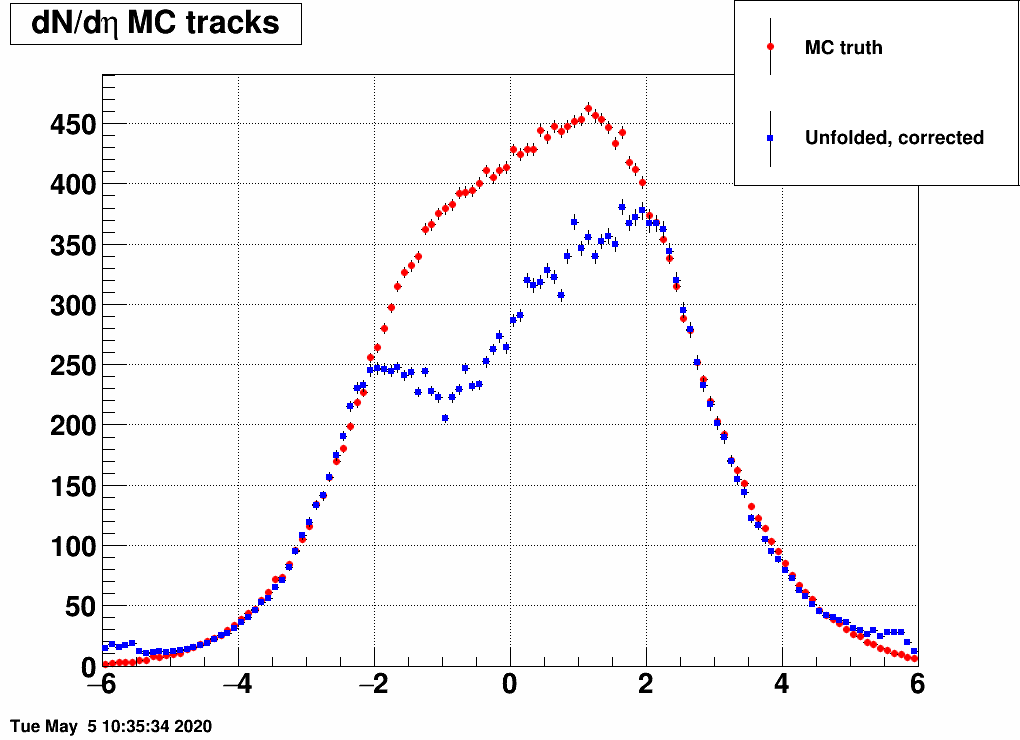
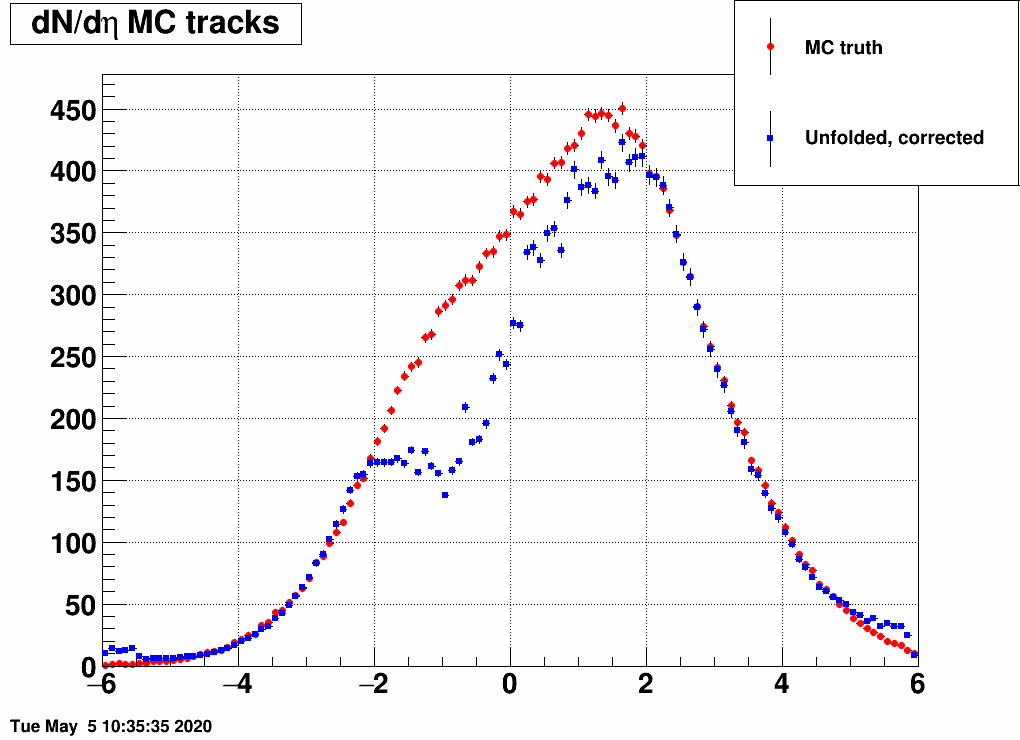
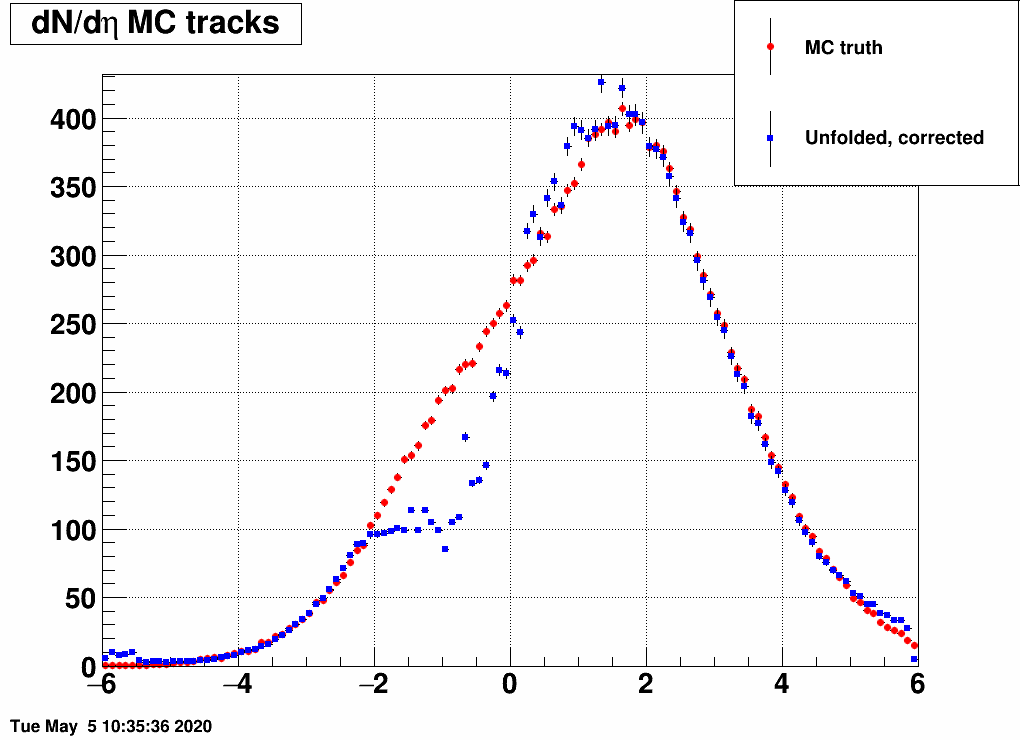
Now I did a test where I artificially distorted the input MC truth, by randomly keeping or discarding MC tracks based on their pseudorapidity. The logic was the following:
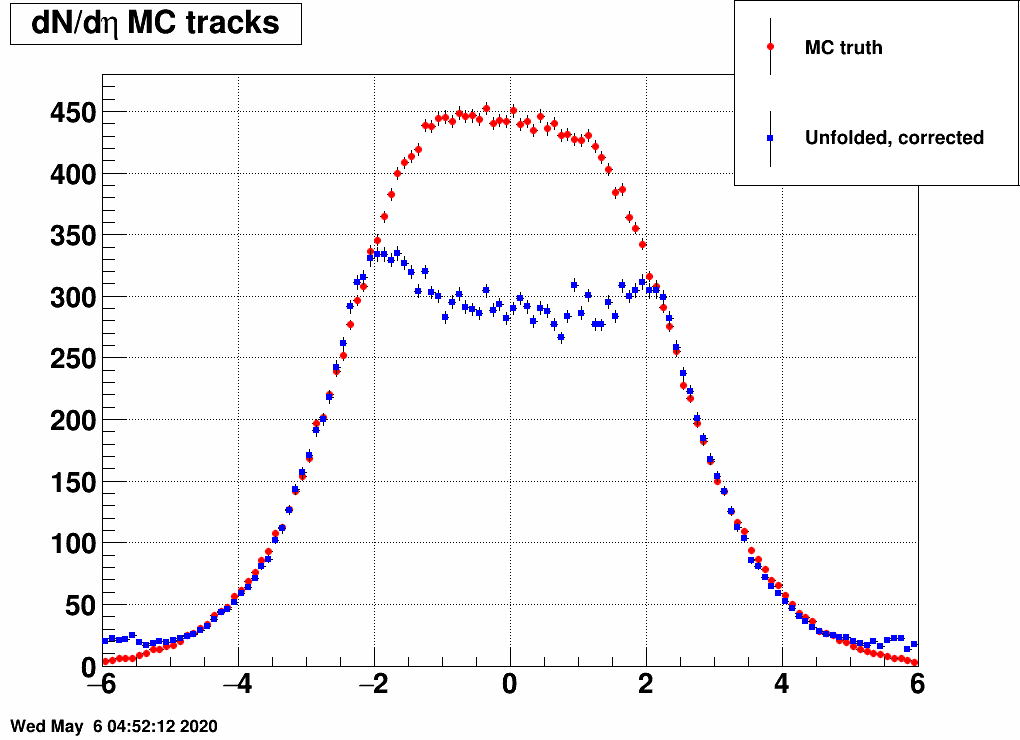
and the distribution was a Gaussian, with the mean and the sigma being variable. Below are a lot of plots from such checks, where always the red is the input MC truth and the blue is the unfolded dN/deta:
Reducing the width (sigma=10000,4,3,2,1)
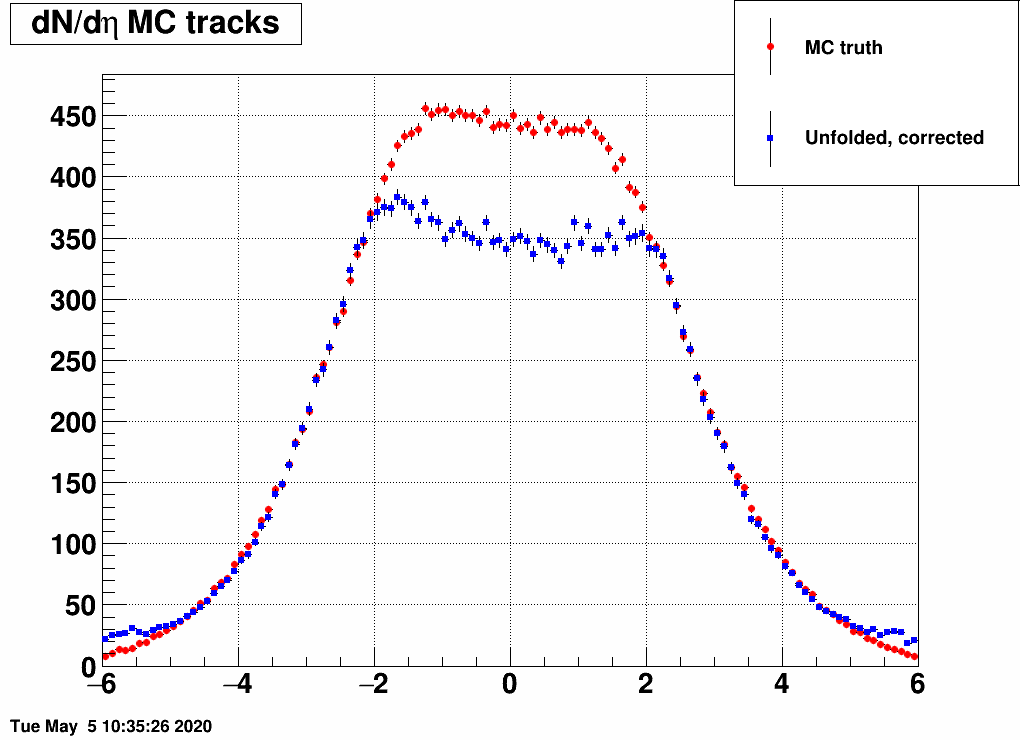
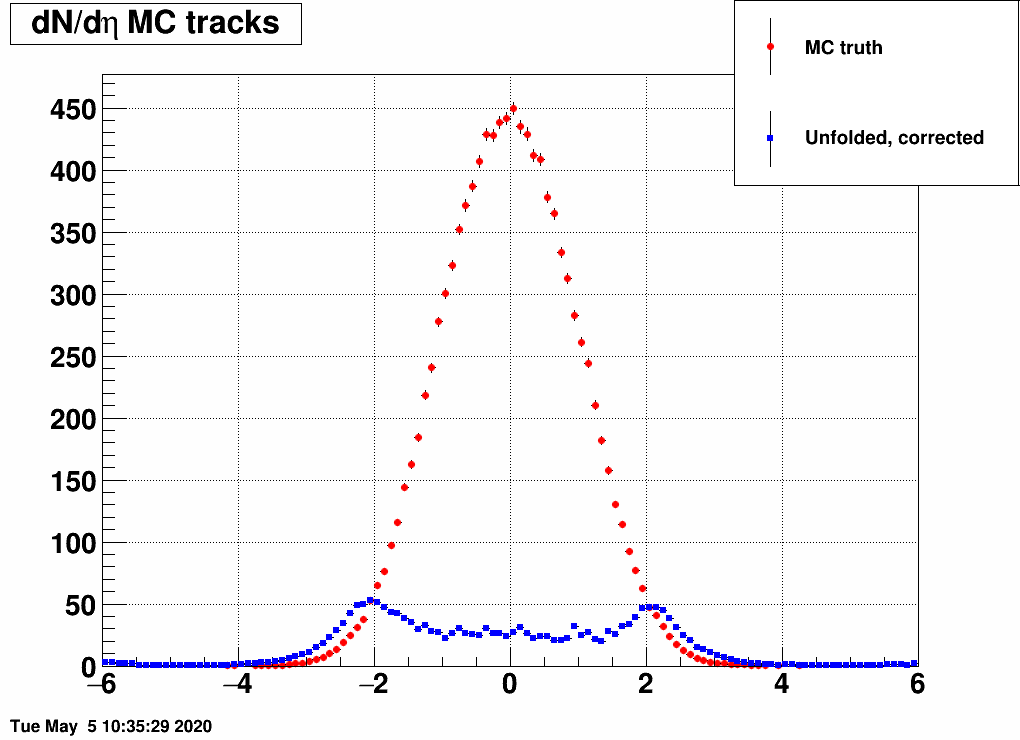
(the first plot with sigma=10000 is there just as a test, there basically no modification of dN/deta was done)
Shifting the center (mean=-3,-2,-1,1,2,3) and reducing the width (sigma=3)
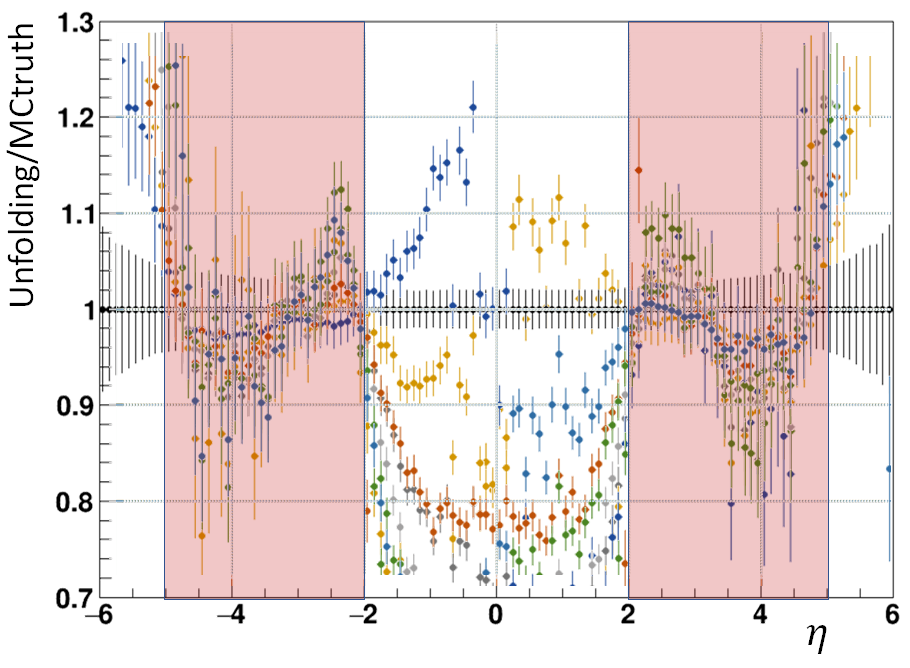
Ratio of unfolded result over input MC truth
All the above cases were used to produce a compilation of unfolding over MC truth results. Notably in the 2<|eta|<5 region, the ratio is approximately compatible with 1 within current uncertainties of the simulation (note that only 5 colors were used for the 11 cases, so this plot is basically just to give an idea of how good the reproduction is)
Observations
- Regions [-5,-2] and [2,5] is well reproduced in all of the cases, except when the input dN/deta is very narrow (width of 1 unit of eta)
- The less hits in the outer regions, the worse the central region [-2,2] is reproduced
- The calcualted statistical uncertainties are definitely not the full uncertainties.
Uncertainty calculation
Clearly there above shown uncertainties are not correct, as the reproduction fails by a much larger amount. Hence different things were tried:
- Calculate the uncertainties with one of the following methods:
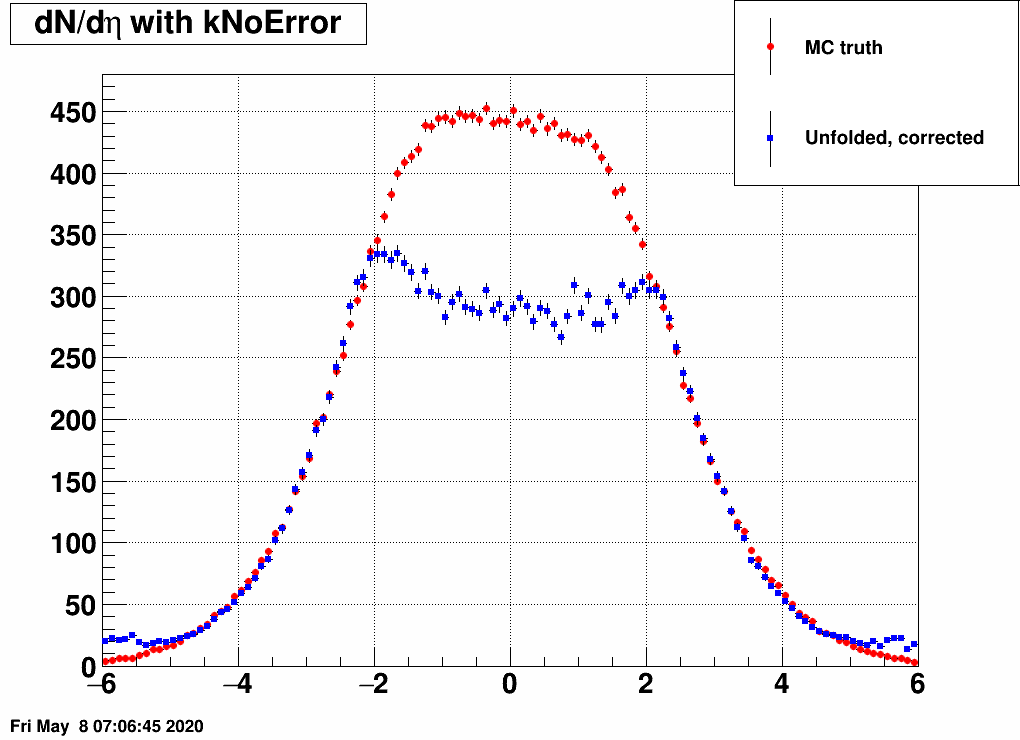
- RooUnfold::ErrorTreatment::kNoError
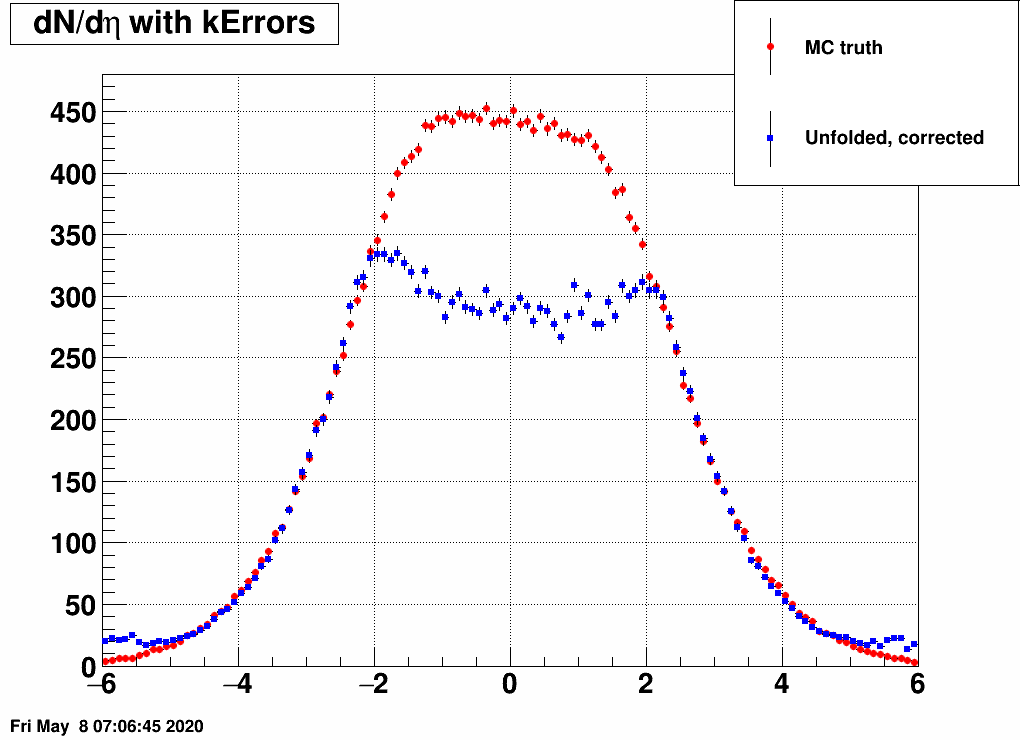
- RooUnfold::ErrorTreatment::kErrors
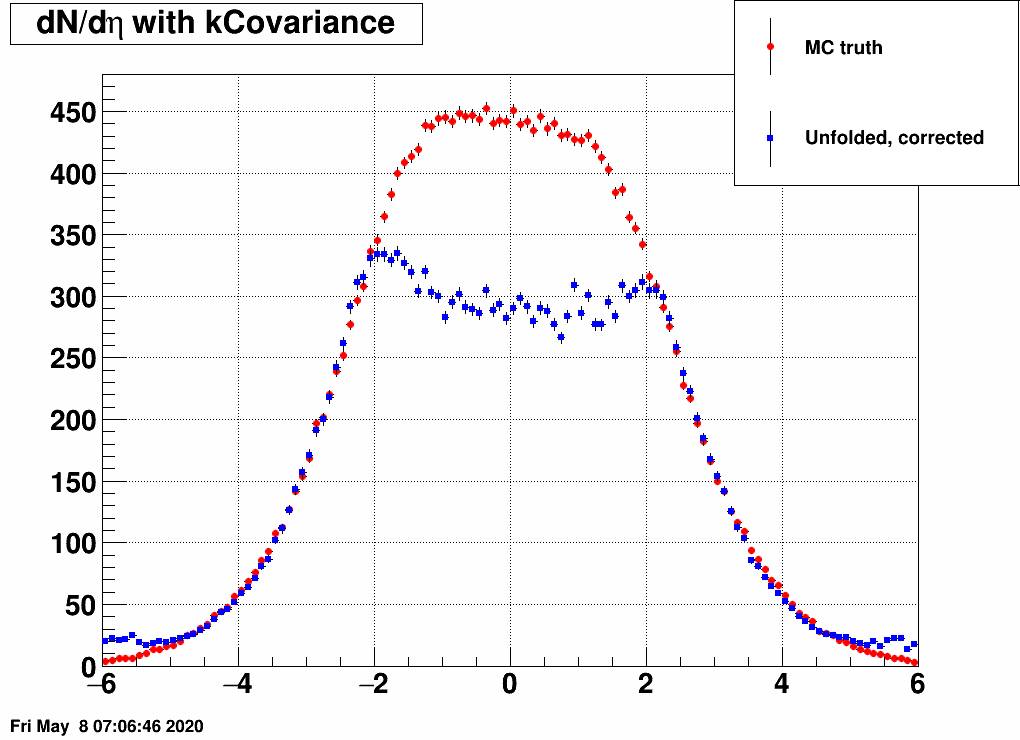
- RooUnfold::ErrorTreatment::kCovariance
- RooUnfold::ErrorTreatment::kCovToy
- Check the reconstructed (unfolded histogram):
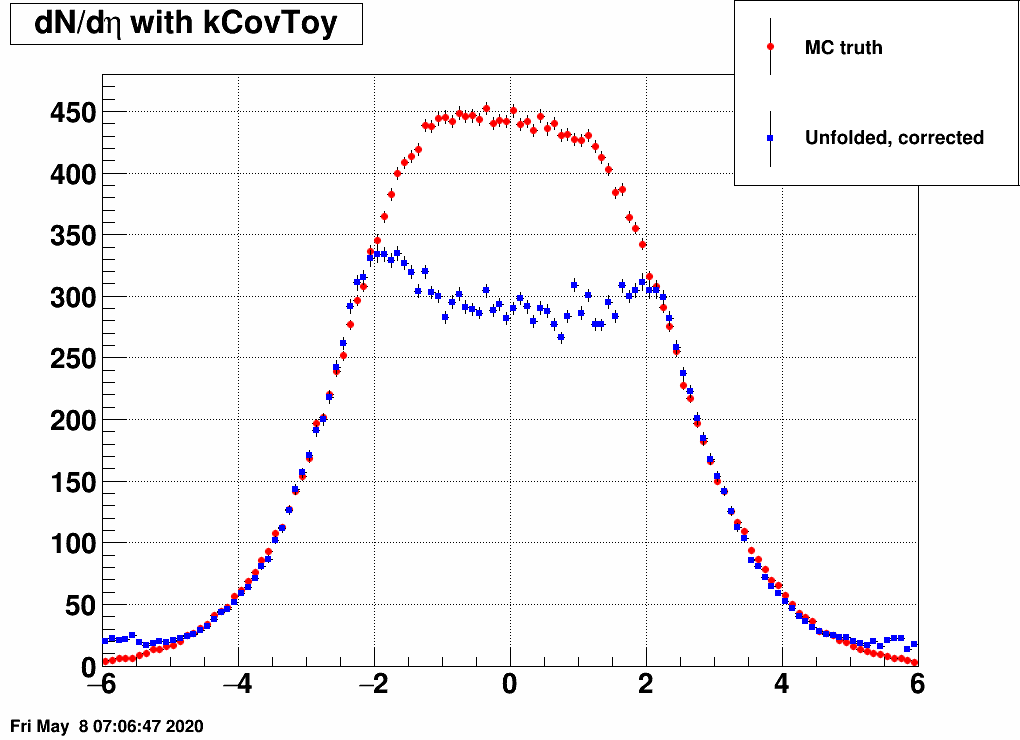
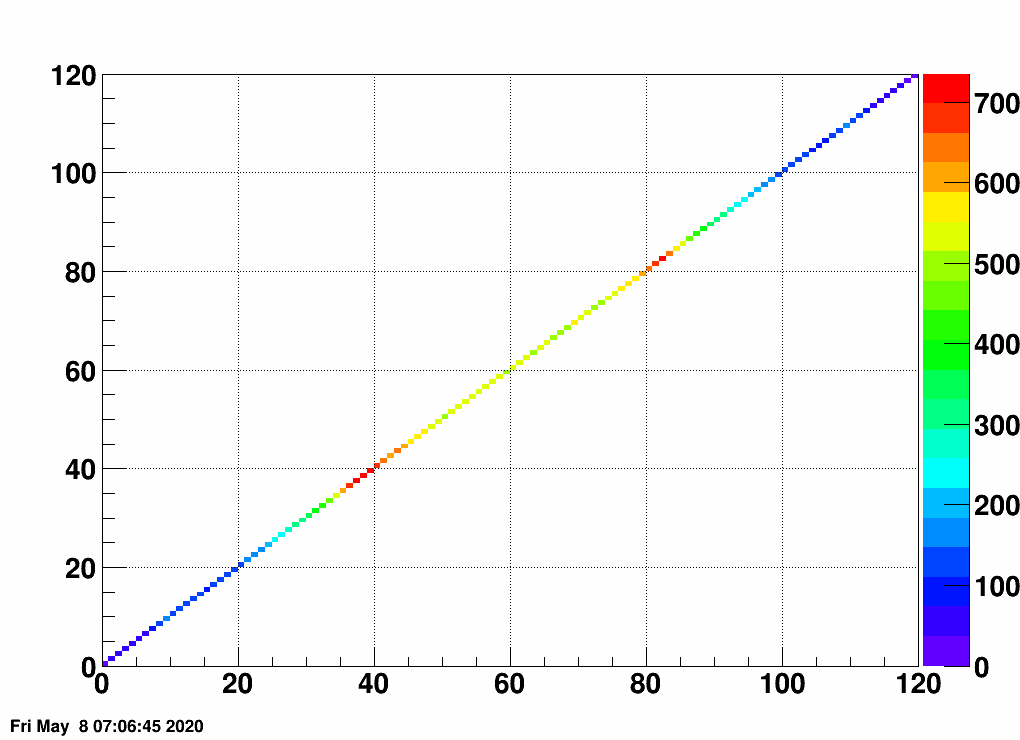
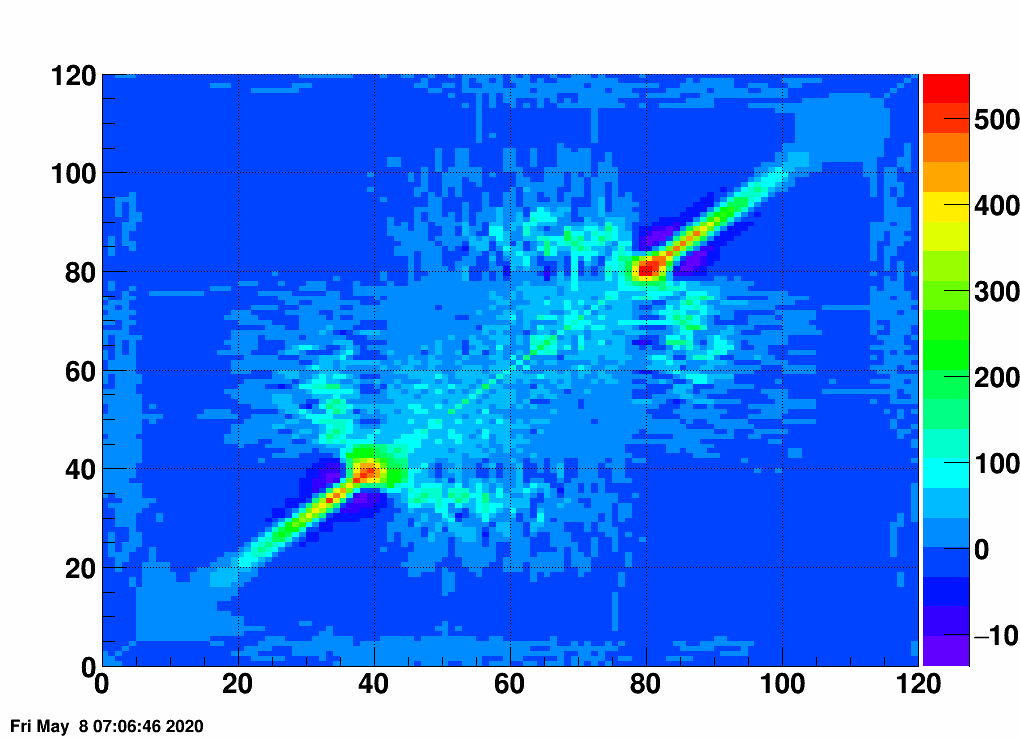
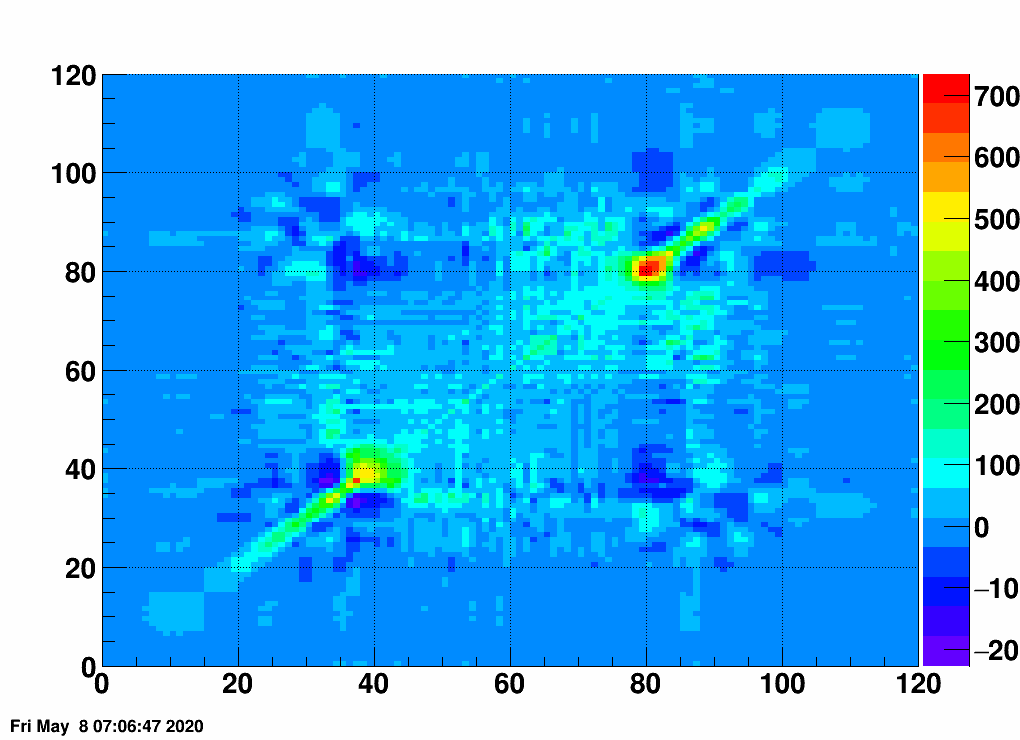
- Check the error matrix (lots are in the following order: kNoError, kErrors, kCovariance, kCovToy)

- Calculate the uncertainties based on the error matrix:
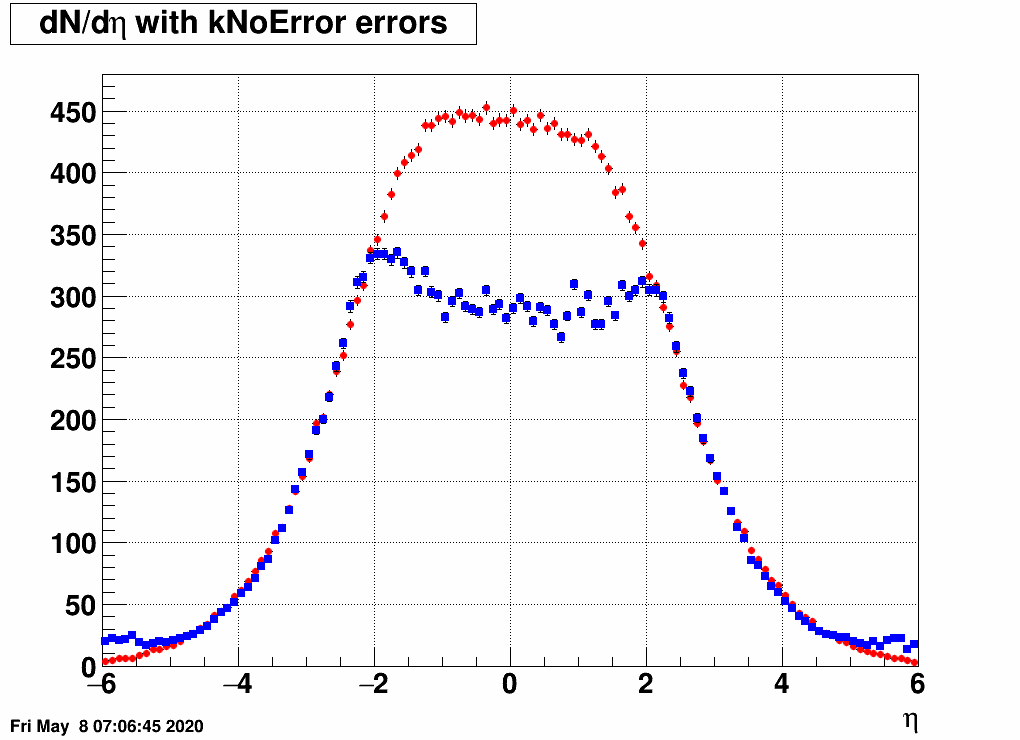
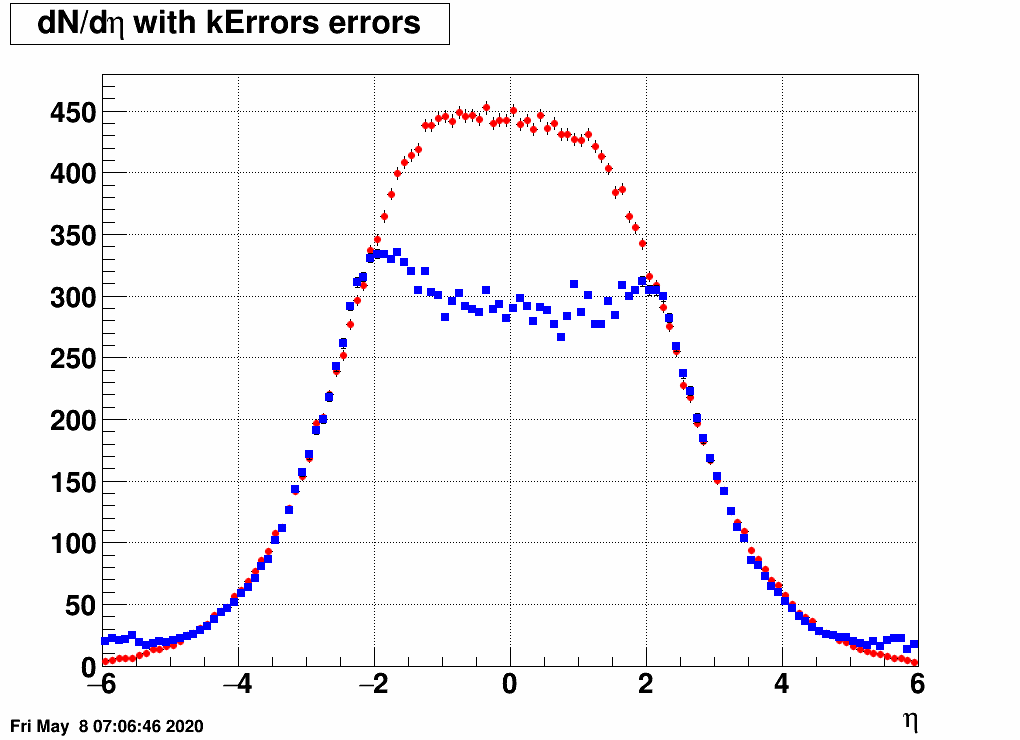
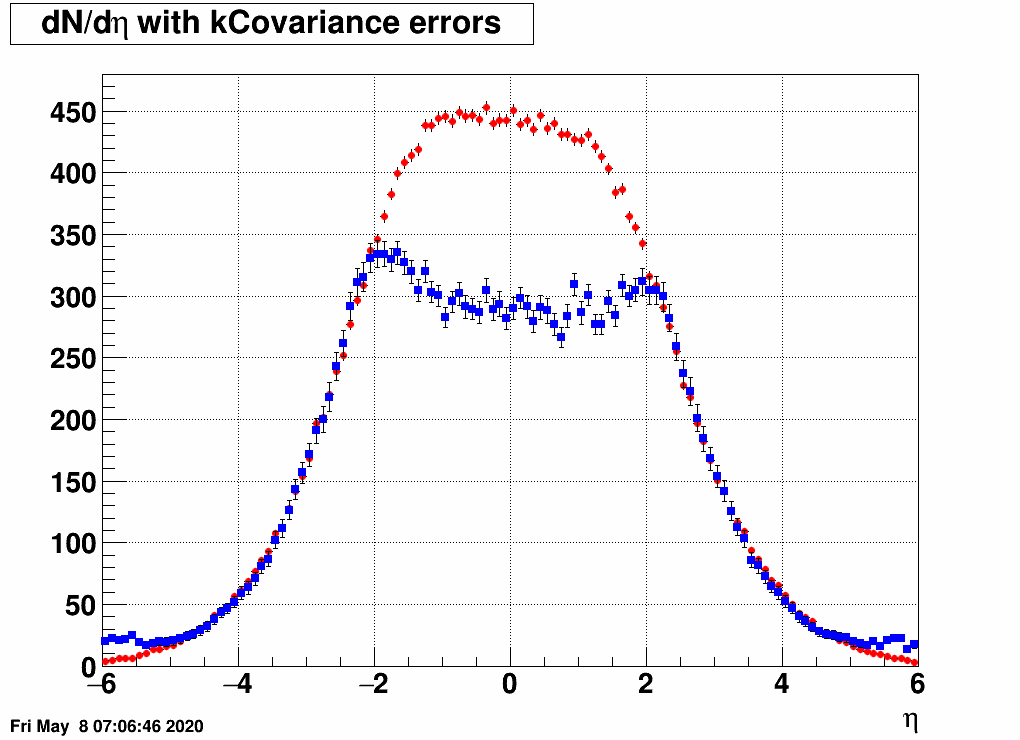
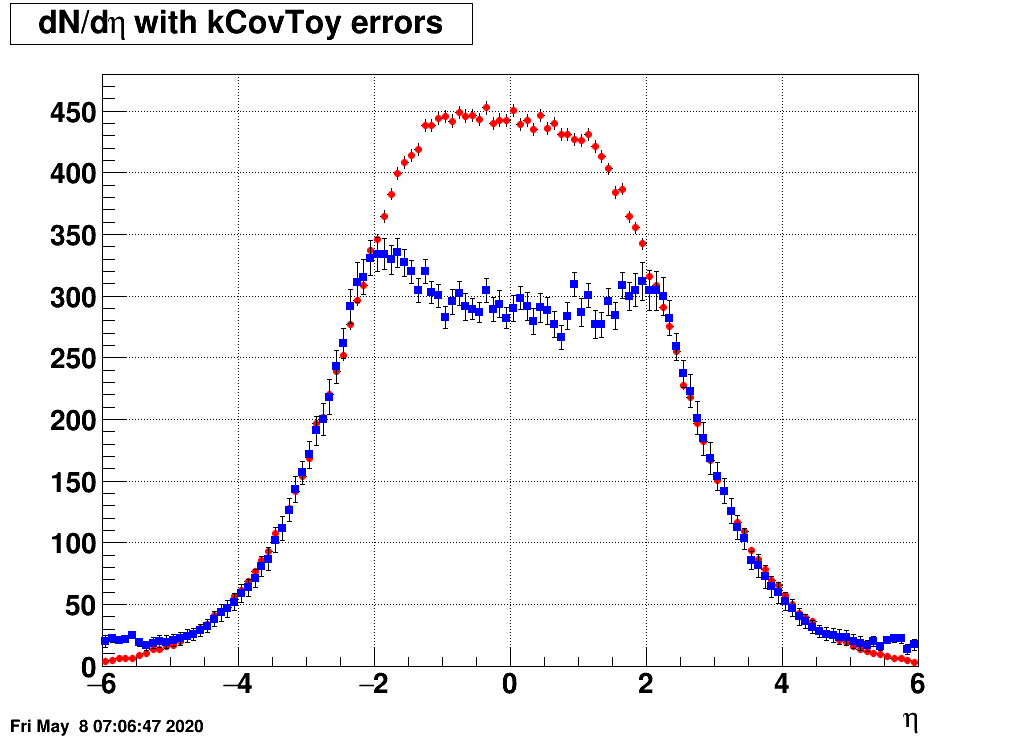
Observation: while the uncertainties depend on the method (and on taking the covariance matrix into account), they still do not account for the large difference.
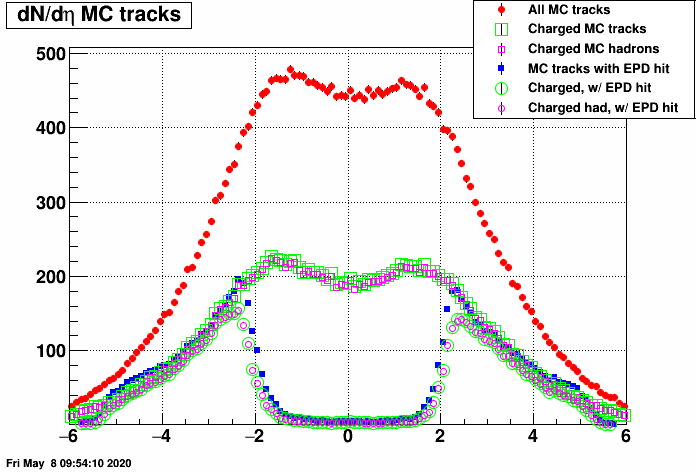
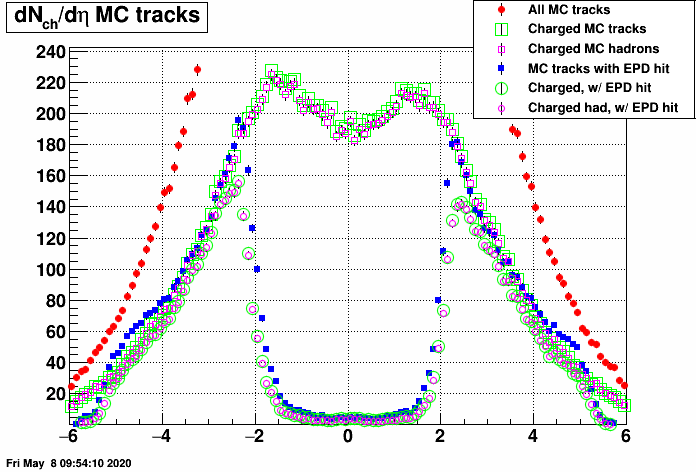
I suspect that this has something to do with midrapidity tracks leaving no hits in the EPD at all, these shall be accounted for somehow. As a first step, I checked the dN/deta distribution of MC tracks with EPD hits (and that of all MC tracks). Here are the resulting plots (in two vertical zoom versions):
- mcsanad's blog
- Login or register to post comments