Unfolding EPD data with various response matrices
IDEA
In a previous blogpost, I checked what happens if one tries to unfold a simulated EPD dataset (ring-by-ring hit info) that is created by some distorted dN/dη distribution. The result was that the 2<|η|<5 region was unfolded well, even if the EPD dataset came from a different dataset than the one on which the response was trained. In simple words, I used one response matrix on various EPD datasets. Now let us try to do the opposite: unfold one EPD dataset with various response matrices!
The response matrices were trained on distorted HIJING data, where a Gaussian distortion with a center η0 and a width σ was applied on the pseudorapidity distribution, with the following logic:
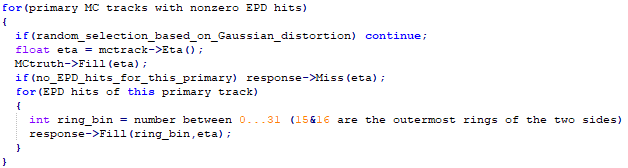
where the η0 and σ values were the following:
| η0 | σ | |
| #1 | 0 | 10000 |
| #2 | 0 | 4 |
| #3 | 0 | 3 |
| #4 | 0 | 2 |
| #5 | 0 | 1 |
| #6 | –3 | 3 |
| #7 | –2 | 3 |
| #8 | –1 | 3 |
| #9 | +3 | 3 |
| #10 | +2 | 3 |
| #11 | +1 | 3 |
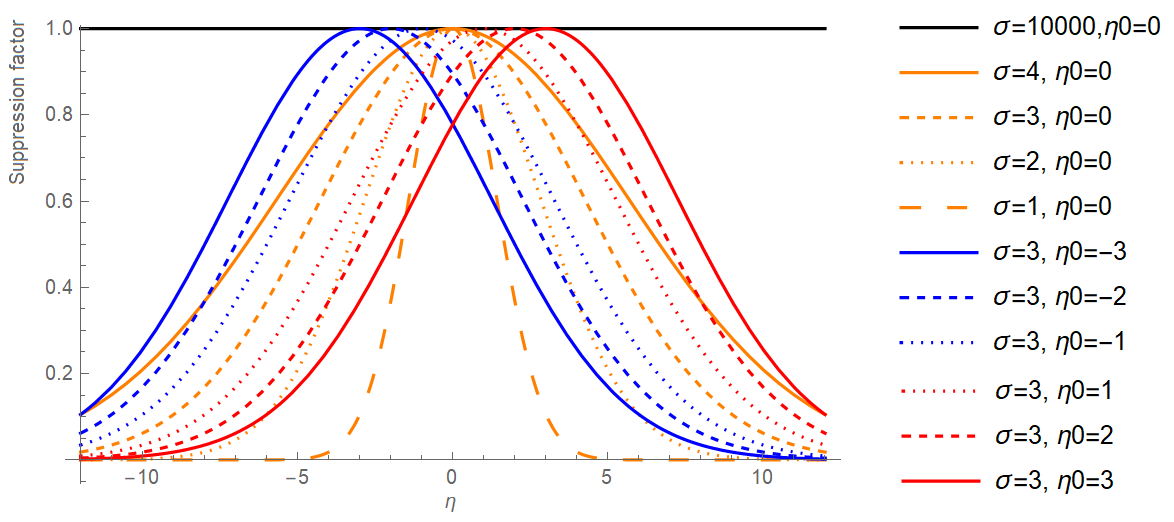
Here the one with a width of 10000 essentially means "no distortion", the others are more and more distorted as σ gets smaller. And there are 6 versions where there is also a shift. Here is an illustration:
| FIG 1: SUPPRESSION FACTOR |
 |
Then the response matrices from the above distorted samples were used to unfold another EPD dataset.
RESULTS
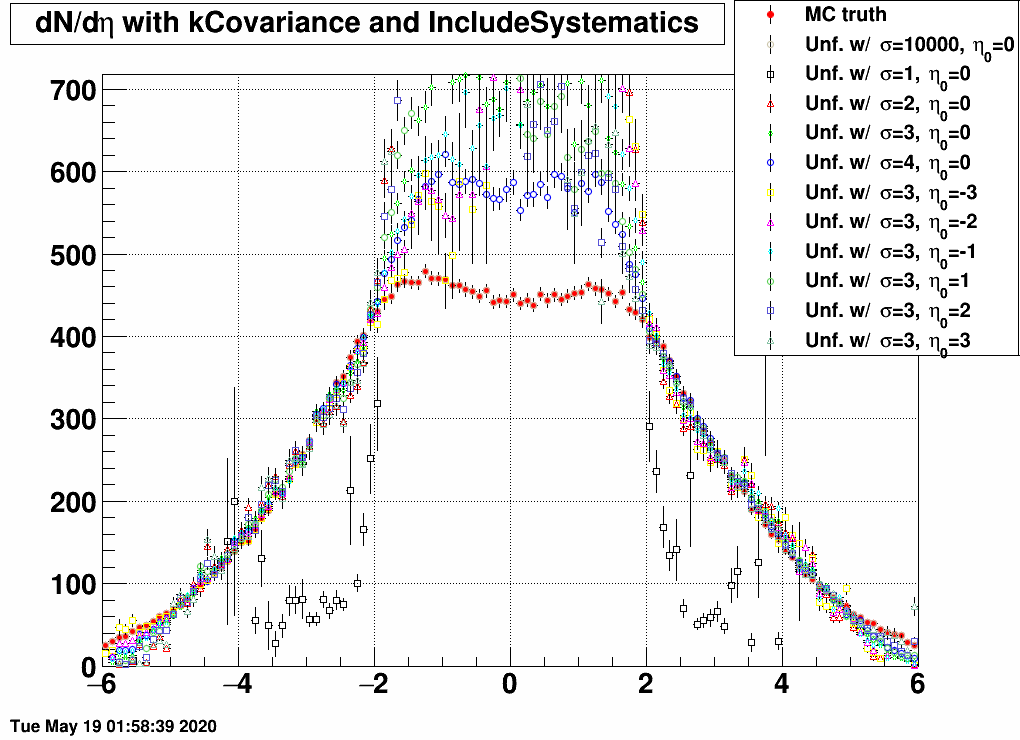
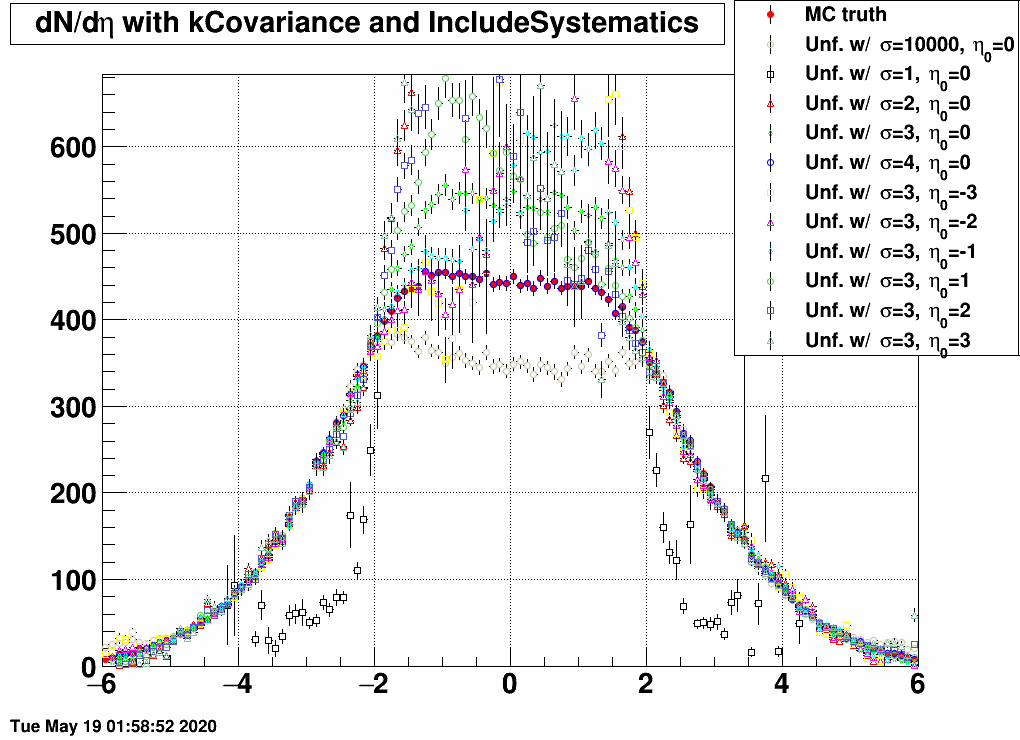
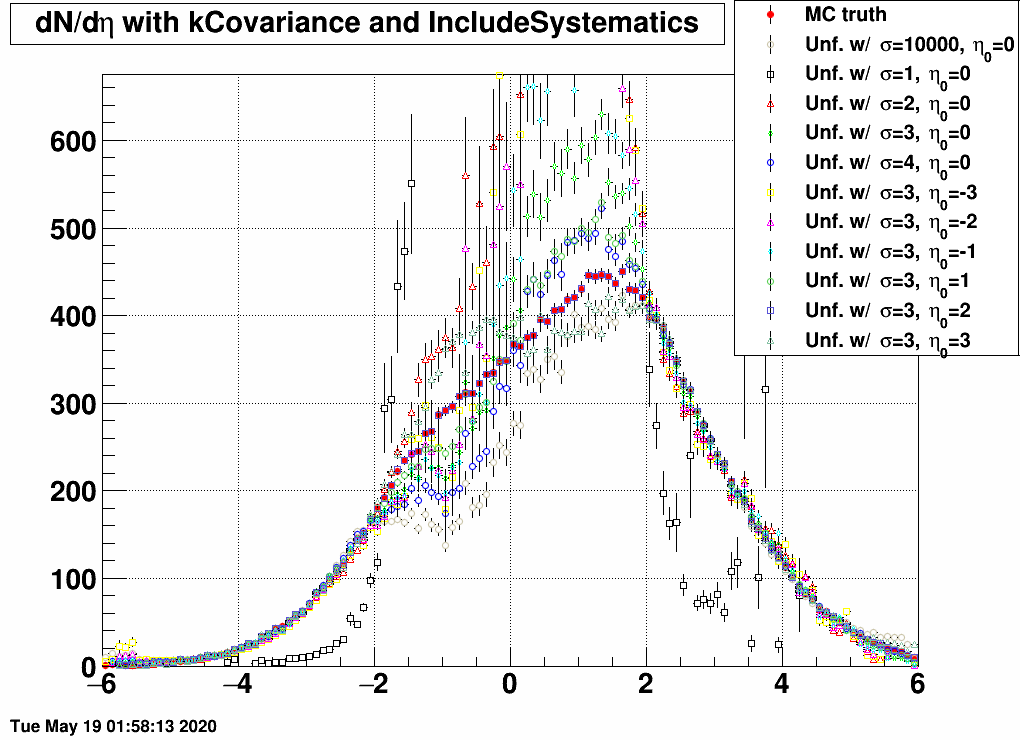
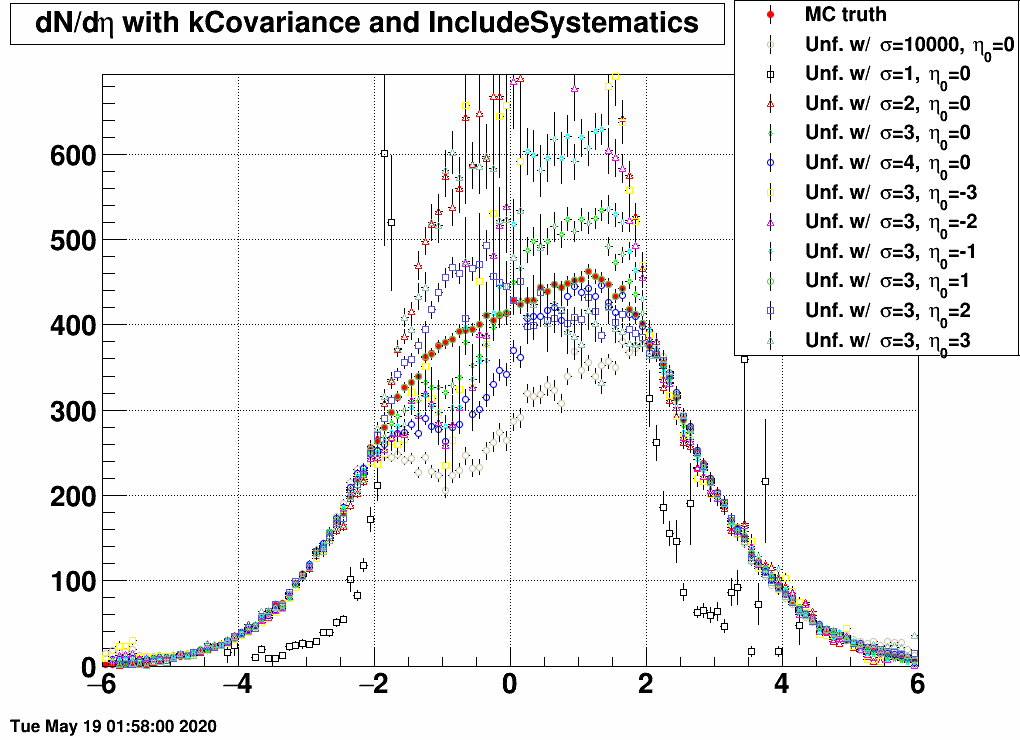
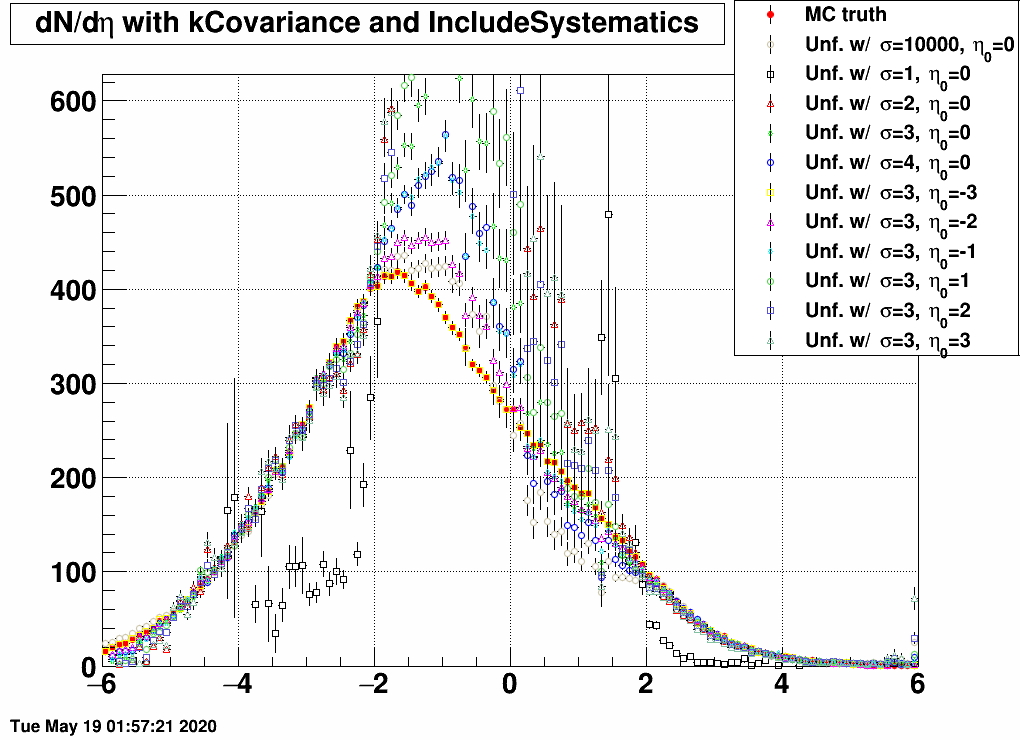
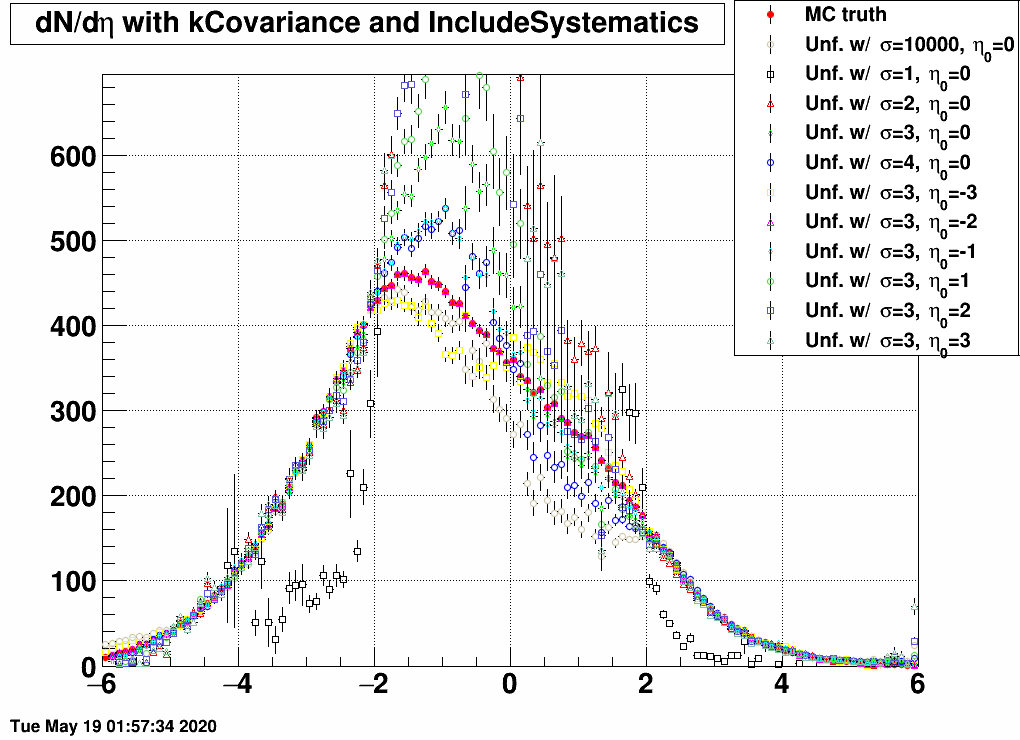
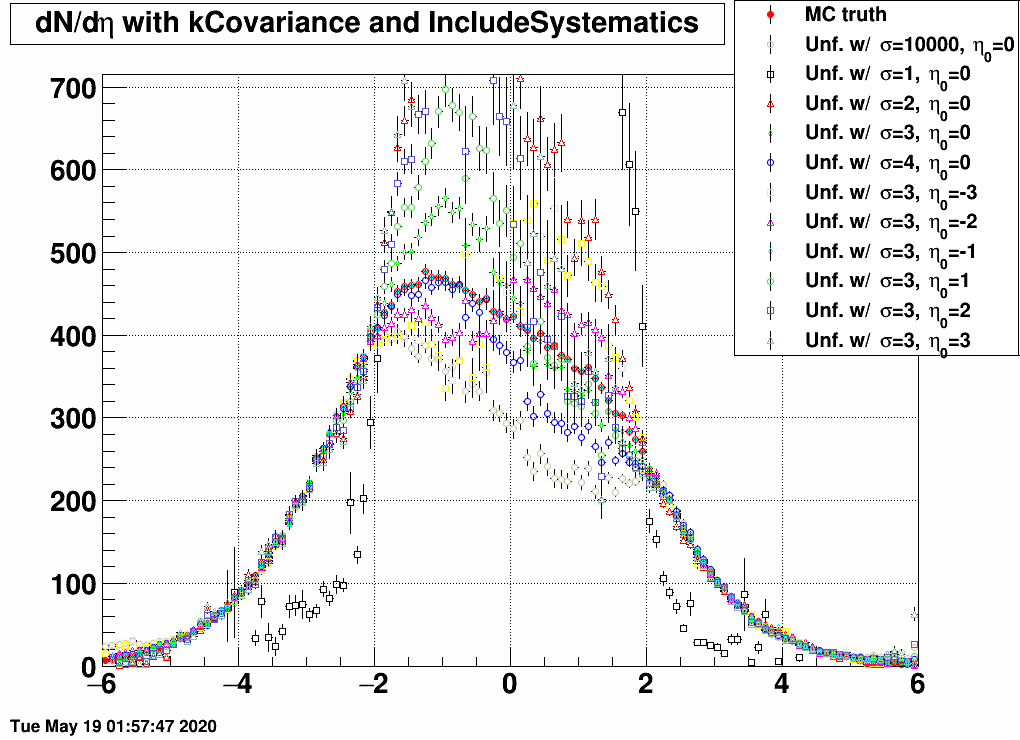
Here are the results for various response matrices and EPD datasets:
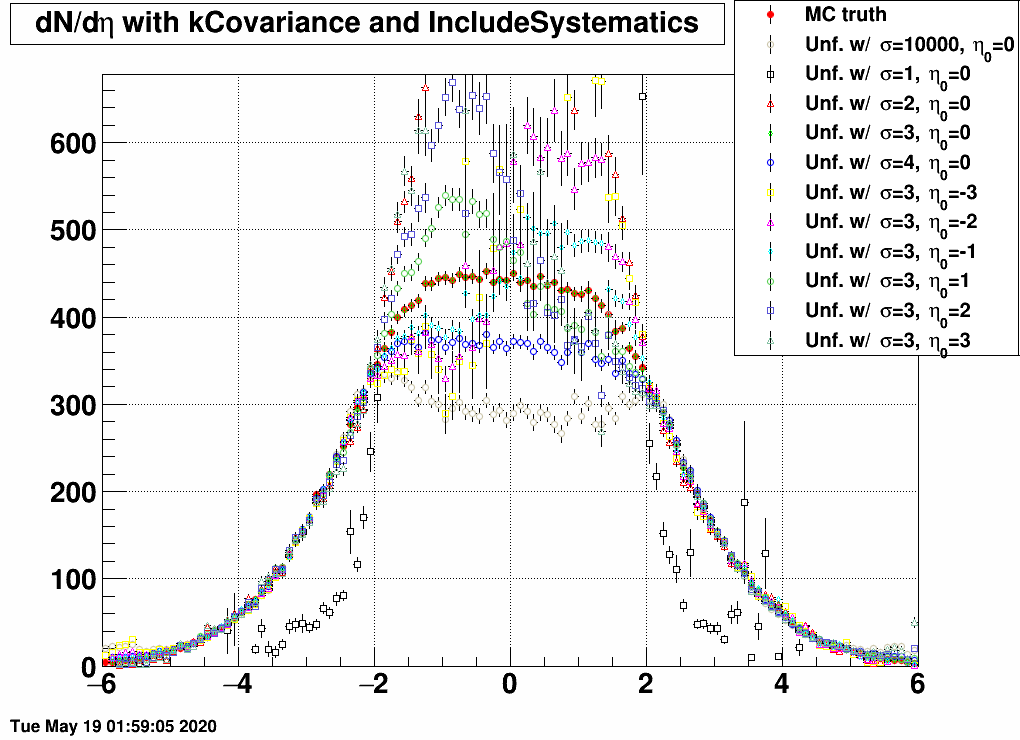
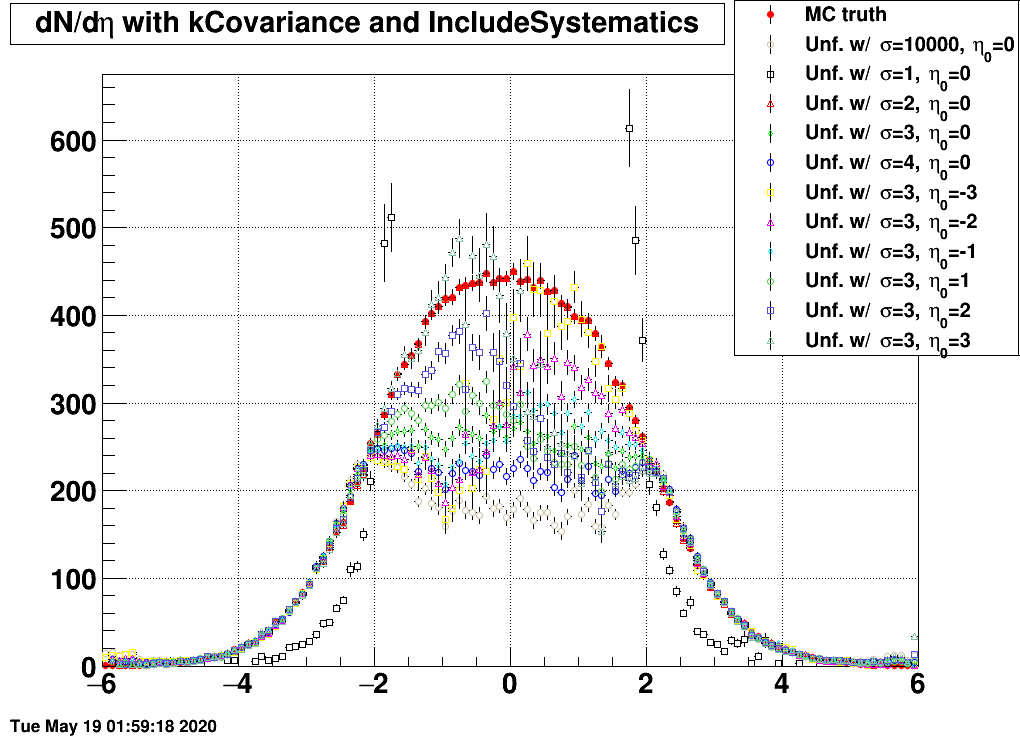
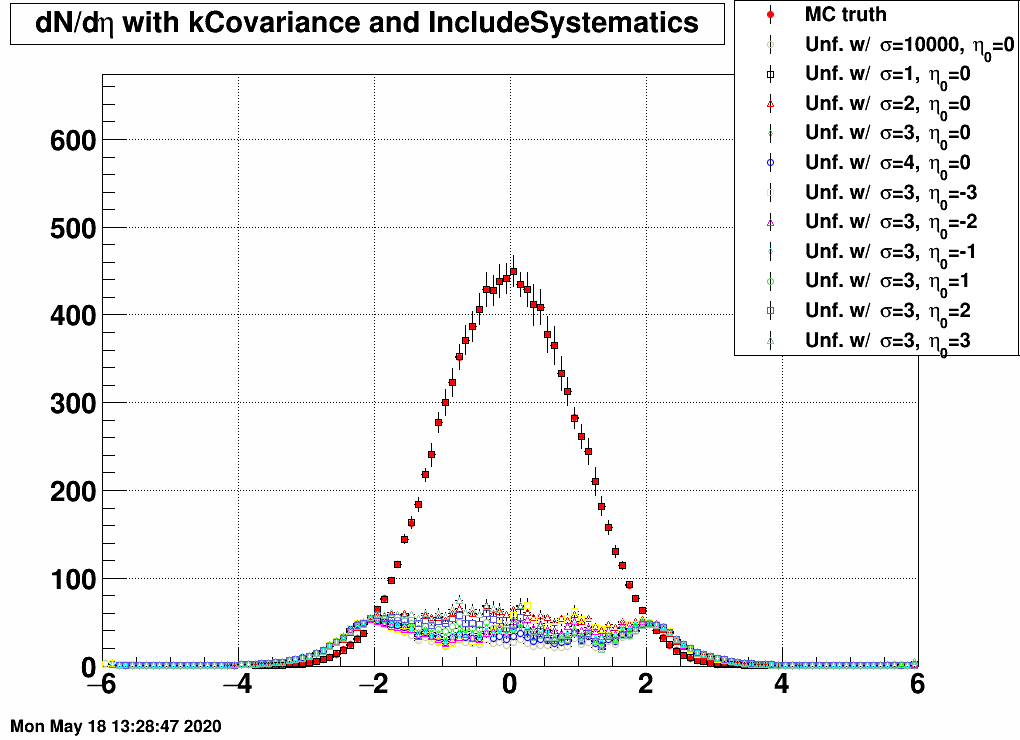
| FIG 2: MC truth: η0=0 and σ=10000 | FIG 3: MC truth: η0=0 and σ=4 | FIG 4: MC truth: η0=0 and σ=3 |
 |
 |
 |
| FIG 5: MC truth: η0=0 and σ=2 | FIG 6: MC truth: η0=0 and σ=1 | |
 |
 |
|
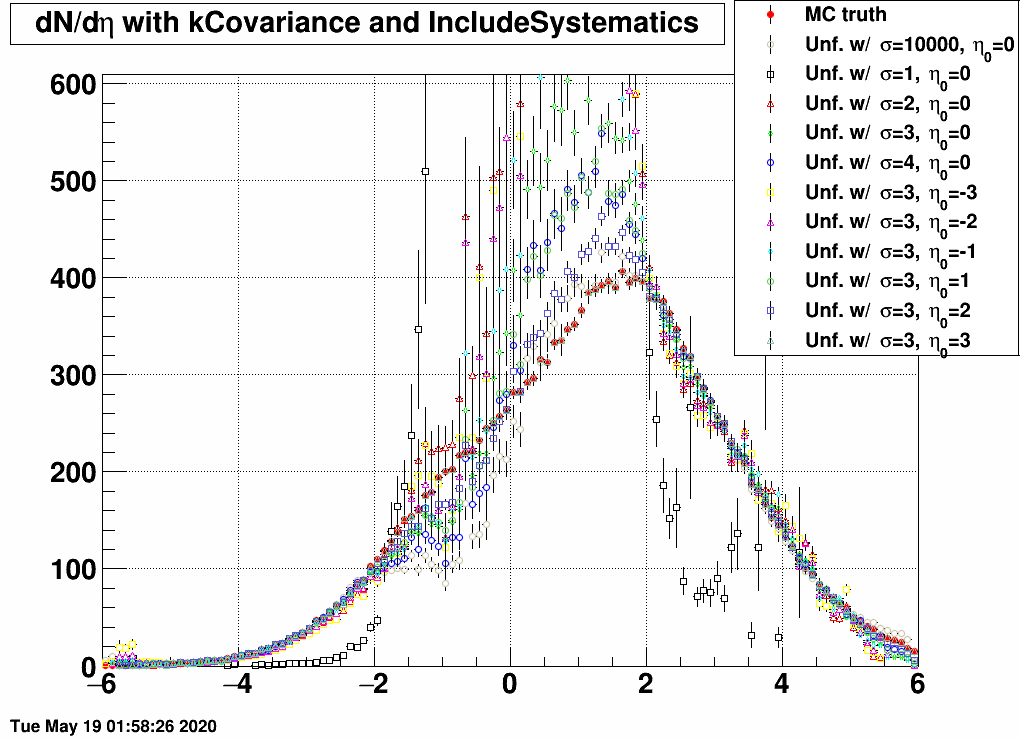
| FIG 7: MC truth: η0=+3 and σ=3 | FIG 8: MC truth: η0=+2 and σ=3 | FIG 9: MC truth: η0=+1 and σ=3 |
 |
 |
 |
| FIG 10: MC truth: η0=–3 and σ=3 | FIG 11: MC truth: η0=–2 and σ=3 | FIG 12: MC truth: η0=–1 and σ=3 |
 |
 |
 |
LESSONS
- In the 2<|η|<5 region, all matrices unfold the same dN/dη, except the one that was trained on a sample with σ=1, as this is too narrow, and there are basically barely any EPD hits.
- If the response and the EPD data are from the same sample, then unfolding is exact.
- If the EPD data is from the sample of with σ=1, then no response matrix can reasonably unfold it, except the one that was trained on exactly the same sample.
Here is a ratio plot for all of the above cases (except where σ=1), i.e. this contains 10x10=100 curves (10 EPD MC data unfolded with 10 different respones each):
| FIG 13: UNFOLDING/MCTRUTH RATIO FOR PLOTS 2-12 (100 CURVES IN TOTAL) |
.png) |
Ultimately, I believe this shows that the unfolding works well in the 2<|η|<5 region, and the systematic uncertainty from the training sample choice can be estimated well, and accounts for the discrepancy in the central (|η|<2) and very forward/backward (|η|>5) regions.
To visualize that differently, let me show here the χ2 maps of the two different ranges (EPD range: 2<|η|<5; other range: elsewhere):
| FIG 14: UNFOLDING-MCTRUTH CHISQUARE MAP, 2<|ETA|<5 | FIG 15: UNFOLDING-MCTRUTH CHISQUARE MAP, |ETA|>5 OR |ETA|<2 |
.png) |
.png) |
Besides the yellow cross corresponding to σ=1, the χ2 values for the EPD pseudorapidity range are pretty reasonable, taking into account the number of datapoints (120).
APPENDIX
- mcsanad's blog
- Login or register to post comments