FMS Opening Angle Reconstruction
Updated on Tue, 2017-09-26 10:59. Originally created by oleg on 2017-09-13 13:50.
Reconstructed gamma pairs from pion decay:
Correction of opening angles:
This might be caused by taking the mean of the histogram and not using a proper fit to the distribution.
Parameterization of correction:
[click figures for larger version]
Since the mis-reconstruction is only a artifact of the fitting method when the separation is close to the point resolution, the correction should not be based on physical properties (e.g. the energy).
The proposed correction is based on the reconstructed opening angle itself.
FMS Opening Angle Reconstruction (Update Sep. 26, 2017)
Proposed opening angle correction is now based on the angle from the pion decay instead of the projected line from the eta peakReconstructed gamma pairs from pion decay:
- energy distributions are for all energy asymmetries
- angle and mass distributions are for the most symmetrical decays only (Z<0.2)
Correction of opening angles:
- left plot: angle of decay vs. reconstructed angle
- right plot: ratio of reconstructed angle divided by decay angle
- solid symbols are for large cells, open symbols are for small cells
This might be caused by taking the mean of the histogram and not using a proper fit to the distribution.
Parameterization of correction:
- the ratio should asymptotically approach 1
- the lower limit of the correction is defined by the cell size
- a good description is achieved with the inverse of a x^6 term plus a constant
- other functional forms are more complicated and may drop towards small angles (outside of the defined range)
FMS Opening Angle Reconstruction (original version)
The opening angle between two photon showers in the FMS is reconstructed wrong if the point separation is on the order of the tower size. This leads to an increased invariant mass; the effect becomes sizable for neutral pions at energies of 50 GeV and above. Eta mesons are essentially not affected.[click figures for larger version]
Single Particle Simulation
Simulation of neutral pions and etas, flat in 2.5<eta<4.3 and full phi, 100k particles for each E = 30, 40, 50, 60, 70, 80 GeV. - Large cells in top row, small cells in bottom row
- Solid line: pions, dashed lines: eta mesons
- Colors according to input energy (same in all the following figures)
- Only events with two points (n==2)
- Acceptance cut around y=0 to remove split showers in north and south detector halves
- The energy is reconstructed a little below the input energy:
- radiation length in large cells: 18.75 X0
- radiation length in small cells: 15.8 X0
Invariant Mass and Opening Angle
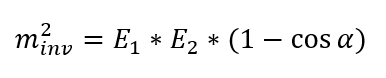
The invariant mass is calculated from:
- pion masses are reconstructed too high with increasing energy
- eta mesons are not affected by this effect (the eta mass is lower than 548 MeV due to the reconstructed energy)
- the deviation is larger for the small cells
- it is a failure in the shower shape fitting (as Akio has shown in a toy simulation)
Correction Method
The opening angle can be corrected by different means.Since the mis-reconstruction is only a artifact of the fitting method when the separation is close to the point resolution, the correction should not be based on physical properties (e.g. the energy).
The proposed correction is based on the reconstructed opening angle itself.
- the invariant mass is approximately proportional to the opening angle for small enough angles
- m = b * alpha.
- (this is mainly for purposes of error propagation)
- plotting mass vs. alpha, the slope is determined from the eta meson in this simulation
- eta peaks are marked by the black circles near the top of the plots
- b is an energy dependent parameter, but it is not used for the final correction
- in real data, it should be possible to use the smeared shape of the pion signal, as can be seen for the lower energies
- the pion peak (solid circles near the bottom of the plots) is compared to the nominal pion mass along the linear rise (for the respective energy)
- from left to right: different z-bins (energy asymmetry)
- the symbols at the nominal pion mass are used in the next plot with the corresponding color for the energy
- solid symbols for large cells, open symbols for small cells
- increasing ranges of energy asymmetry for circles, boxes, and triangles
Corrected Opening Angle
Corrected opening angle vs. reconstructed opening angle - the correction is larger for small angles
- the plot includes statistical uncertainties (smaller than the symbol sizes in most cases)
- horizontal uncertainty from the determination of the eta peak (uncertainty of mean)
- vertical from the determination of the pion peak (uncertainty from fit)
- systematic uncertainties are not estimated completely
- may arise from a mediocre method of finding the peak positions
- example: the lowest z in the small cells at 30 GeV, open red circle
- the correction of the opening angle is dependent on the reconstructed angle
- the correction is NOT dependent on the reconstructed energy
- different energy asymmetry ranges lead to different corrections for the same energy
»
- oleg's blog
- Login or register to post comments