FPS gains / MIP peaks in online monitoring
Updated on Mon, 2017-03-27 15:22. Originally created by oleg on 2017-03-24 14:24.
This procedure was not successful for single SiPMs this year for most channels.
A MIP peak was hard to identify even by eye in a large fraction of channels for both SiPMs simultaneously.
Figure: Three examples (from left to right) for medioce, good, and bad channels from two dedicated runs with different voltage settings.

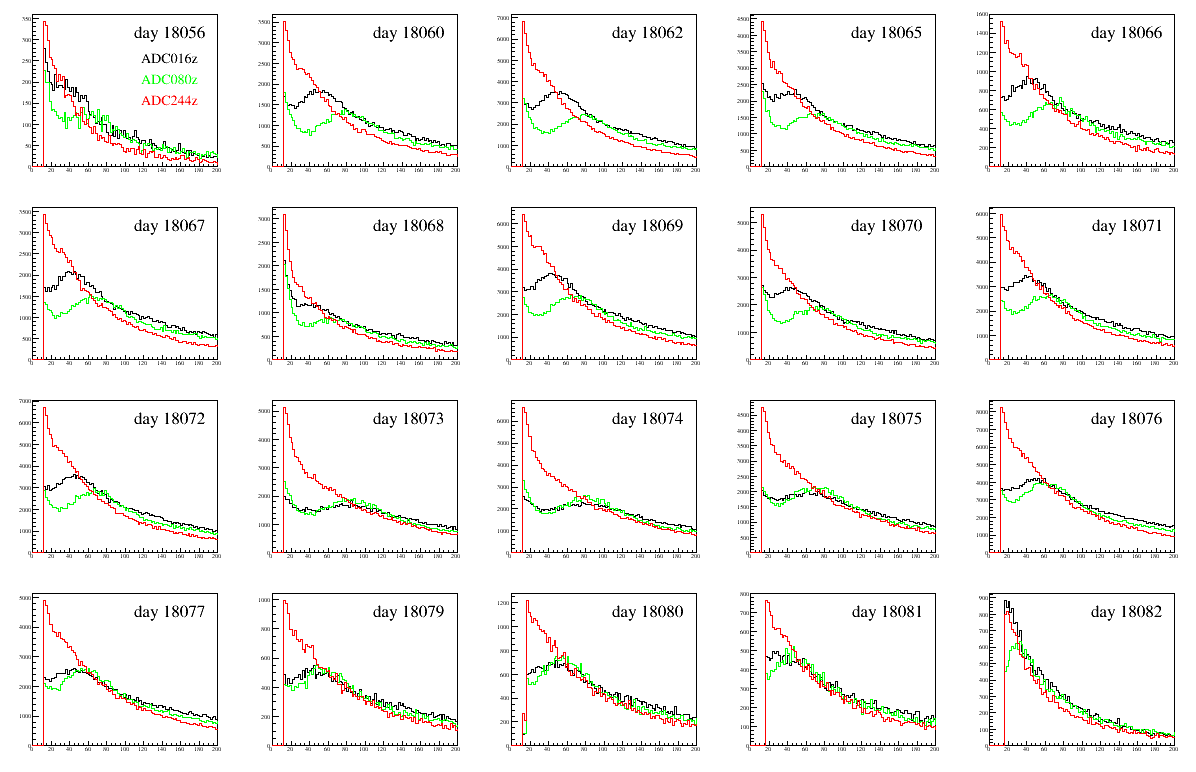
Figure: Aggregated ADC distributions are generated from the online monitoring files for whole days (same channels and color code as previous figure).

Voltages were changed on days 72, 75, and 81 (relative to 2015):
+0.8 V in run 18072032
+0.2 V in run 18075018
-0.7 V in run 18081071
(The spectra are for full days, so these three days contain runs with two different voltage settings.)
For all channels (for periods with different voltages) see the pdf file below.
The MIP peaks in the mediocre channels standing out much better in these distributions
The MIP peaks are not anywhere near 100 ADC counts any more, but gain matching for single SiPMs is not feasible at this point.
This will have to be treated in the offline gain calibration for physics analyses.
The effect of the voltage increase is smaller than expected, but running with voltages close to 2015 looks reasonable.
Lower voltages may lead to partial loss of MIP peak.
We can track the radiation damage from day to day (will need to include the Landau fits again) and can possibly raise the voltages by another 0.2 V later if needed.
The bad channels are still tricky, but those in layer 3 may just have small gains (due to the different SiPM pixel size).
Gain matching FPS in 2017
We tried to gain match the SiPM gains such that the MIP peak would sit at 100 ADC counts.This procedure was not successful for single SiPMs this year for most channels.
A MIP peak was hard to identify even by eye in a large fraction of channels for both SiPMs simultaneously.
Figure: Three examples (from left to right) for medioce, good, and bad channels from two dedicated runs with different voltage settings.

Aggregated distributions from online monitoring
Figure: Aggregated ADC distributions are generated from the online monitoring files for whole days (same channels and color code as previous figure).

Voltages were changed on days 72, 75, and 81 (relative to 2015):
+0.8 V in run 18072032
+0.2 V in run 18075018
-0.7 V in run 18081071
(The spectra are for full days, so these three days contain runs with two different voltage settings.)
For all channels (for periods with different voltages) see the pdf file below.
The MIP peaks in the mediocre channels standing out much better in these distributions
The MIP peaks are not anywhere near 100 ADC counts any more, but gain matching for single SiPMs is not feasible at this point.
This will have to be treated in the offline gain calibration for physics analyses.
The effect of the voltage increase is smaller than expected, but running with voltages close to 2015 looks reasonable.
Lower voltages may lead to partial loss of MIP peak.
We can track the radiation damage from day to day (will need to include the Landau fits again) and can possibly raise the voltages by another 0.2 V later if needed.
The bad channels are still tricky, but those in layer 3 may just have small gains (due to the different SiPM pixel size).
Channel mapping for quadrants/layers
| Layer 1 | Layer 2 | Layer 3 | |
| Quadrant 1 | 000-020 | 021-041 | 042-062 |
| Quadrant 2 | 063-083 | 084-104 | 105-125 |
| Quadrant 3 | 126-146 | 147-167 | 168-188 |
| Quadrant 4 | 189-209 | 210-230 | 231-251 |
Problematic MIP peaks (other than in layer 3):
Q1L2 - channel 32
Q2L1 - channels 66, 67, 68
Q2L2 - channel 98
Q3L1 - channels 131, 132, 133, 138
Q4L1 - channels 189, 192, 193, 194
»
- oleg's blog
- Login or register to post comments
