Parameter tuning in the FGT APVs
First results from the APV tune
This is a dump of some plots coming out of the study of APV parameters. Clearly this is not the cleanest way to present results. I will continue to dump some information here and then on a second pass I will start a new blog with better structure. This is my sand box!!
Preliminary results for the parameter VFS which is the one that produces the biggest change in the decay time of the pulse. The following figures were produced
with 1.2M events collected from Thursday 16th to midnight of Saturday 18th. This analysis is done with slightly modified StFgtTimeShape written by Len Eun.
The conditions for pulses to be accepted in this analysis are:
errCode == 0
chi2<2.
maxadc>600
2<timeBin of maximum < 4 (this conditions forces the pulses to be centered on our 7 time bin window)
The VFS parameters was changed on APV on the "short" side of all quadrants. The figures below show the decay time of the selected pulse as it changes with the different values of VFS:
Figure 1 VFS=0 Produces the fastest decaying pulses.
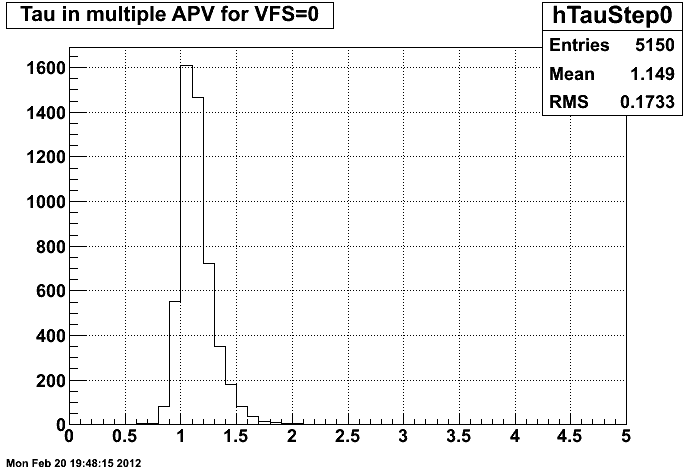
Figure 2 VFS = 30
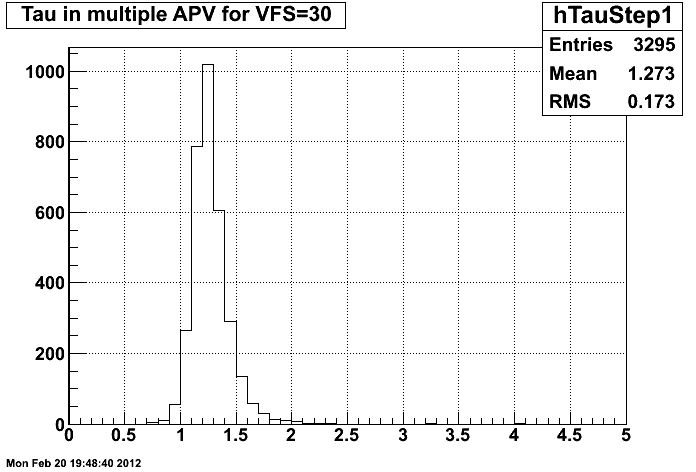
Figure 3 VFS = 60
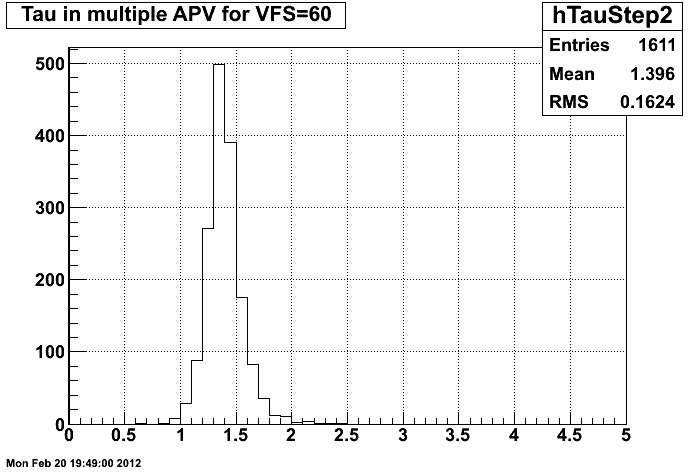
Figure 4 VFS = 90
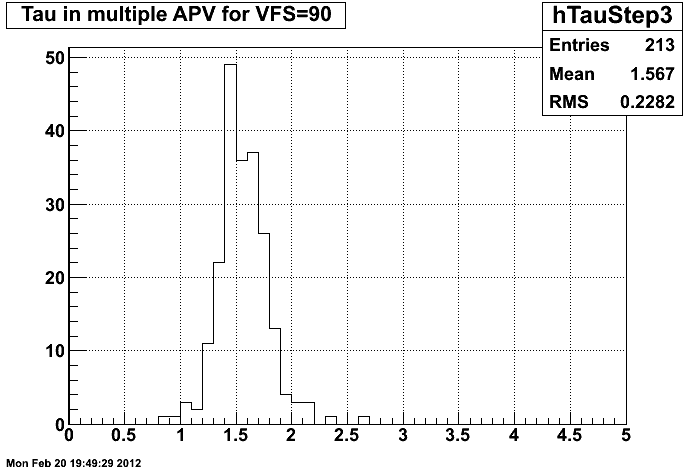
Figure 5 VFS = 120
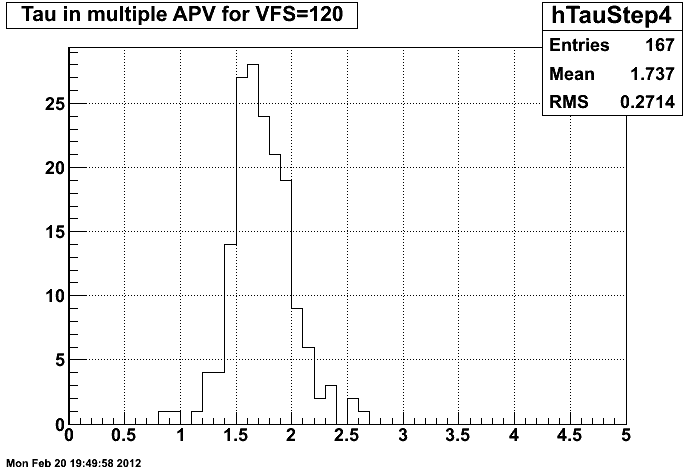
The variation of Tau, the decay time of the pulse as function of the VFS parameter values is clear. But what is not well understood is why the number of entries in these plots goes down as the pulses get slower? The Tau distributions also get wider at high values of VFS.
What follows is a summary for several pulse shape and timming quantities. The conditions required to be included in these figures are:
errCode == 0
chi2<2.
maxadc > 600
Figure 6 T0 the begining of the pulse.

Up to four groups of T0 values are seen. Three groups are seen more often in all APVs. I suspect this matched the three types of pulse shapes we mentione below.
Figure 7 The localion of the pulse maximum in time bin. as its projection for all APVs
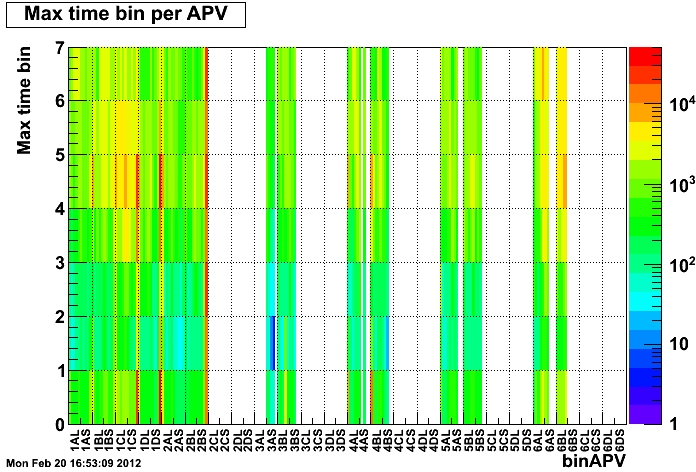

This may show that my choice for the allowed time window of the pulse maximum is selecting only a small fraction of the pulses.
Displaying the time bin of the fitted function maximum cleans up the plot:

The prefered window for the pulse maximum is thus bin 4 to 6
Figure 8 The integral of the fitted function; Total charge collected module the input impedance of the APVs
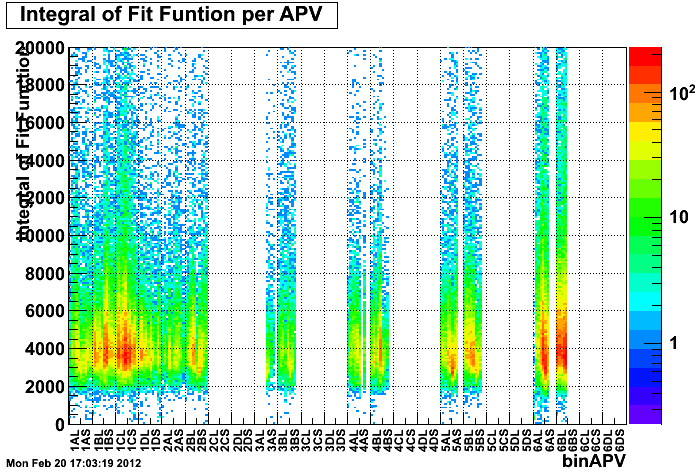
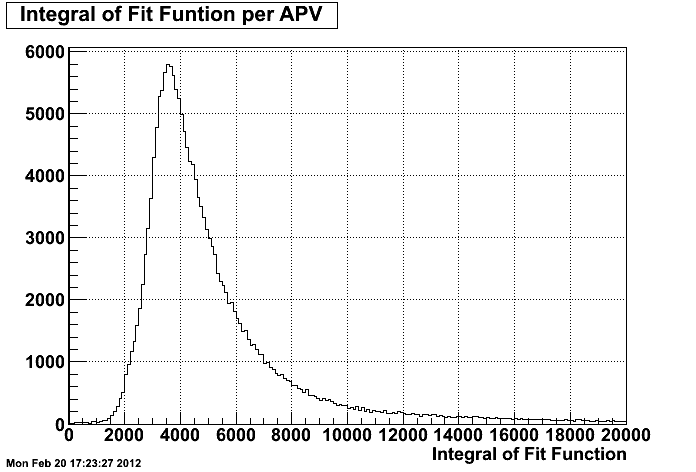
Nice Landau shape, is the MIP somewhere there?
Max ADC

same per QUAD
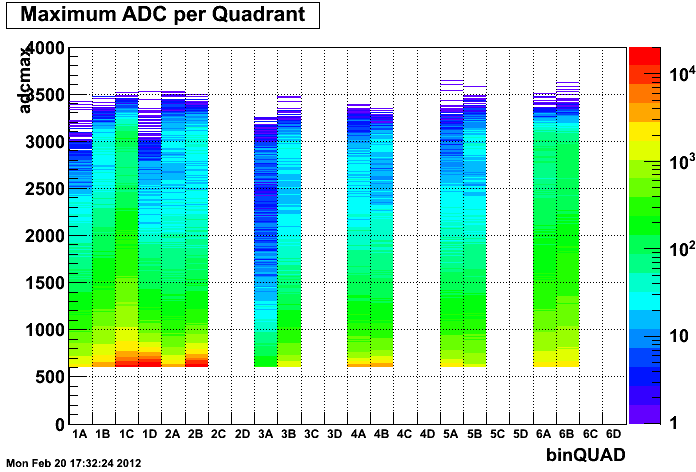
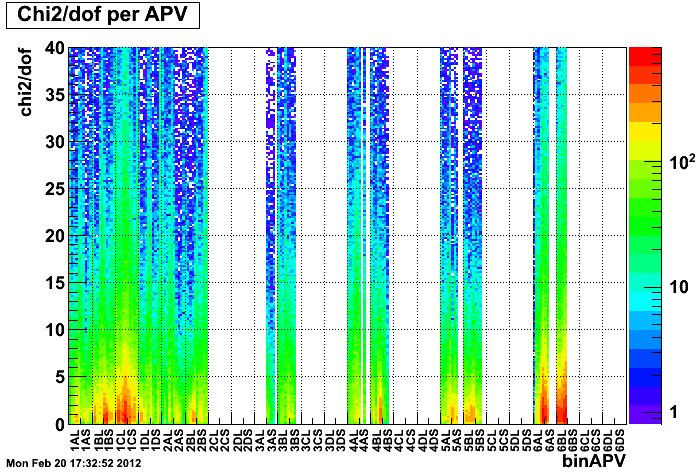
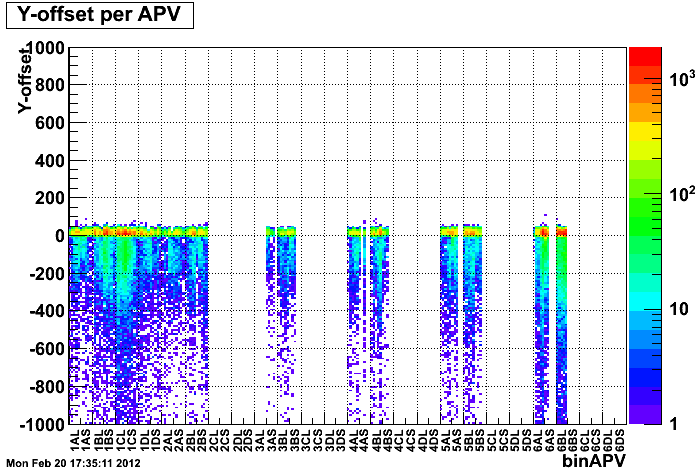
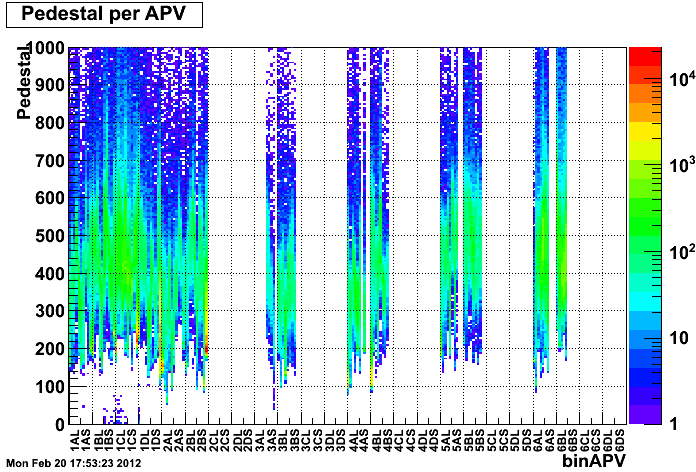

The VFS (shaper feedback voltage bias) and VFP (pre-amp. feedback voltage bias) parameters were changed for the "short" side of two assemblies on disc 1:
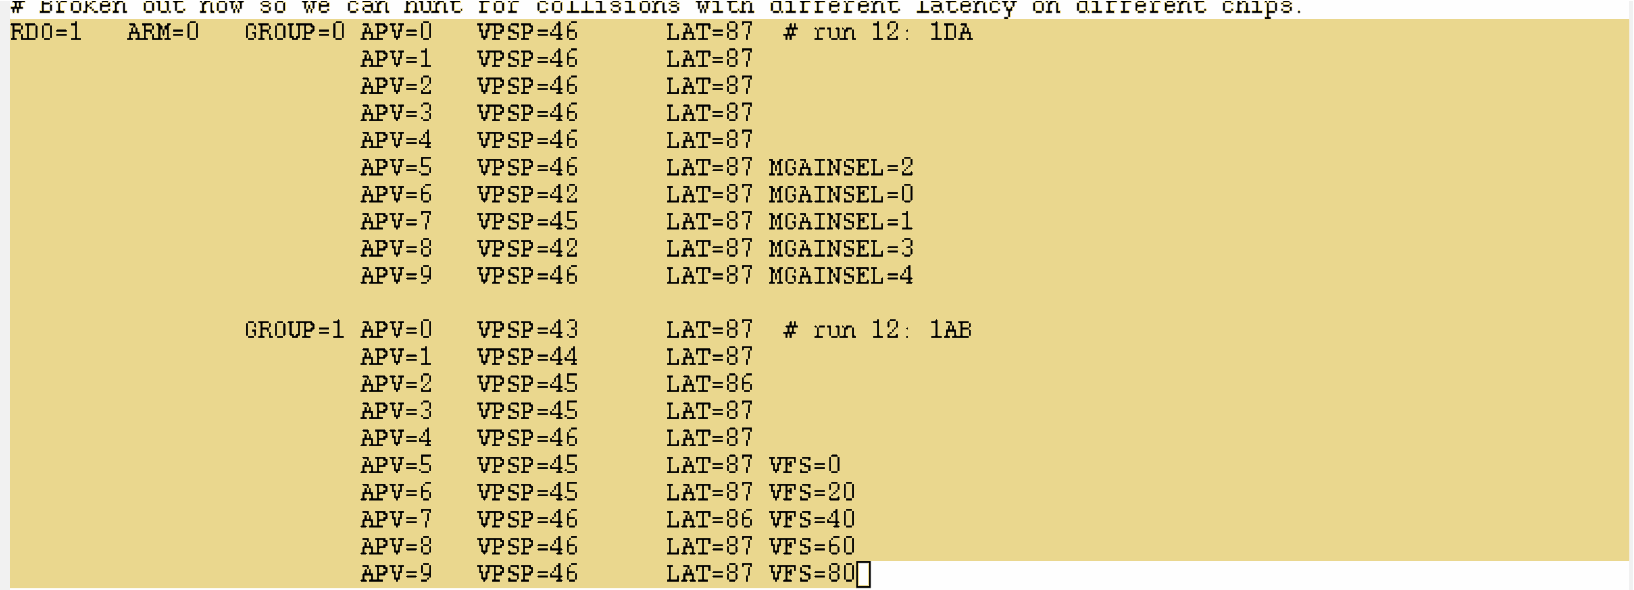
And for VFP:

Pulses with good fits appear to be of three types:
Good timing, one can see pedestal, rise and fall.
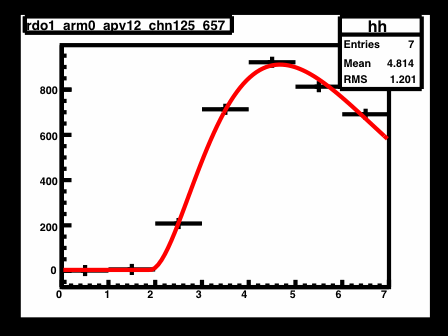
Late pulses; the decay part is not visible.
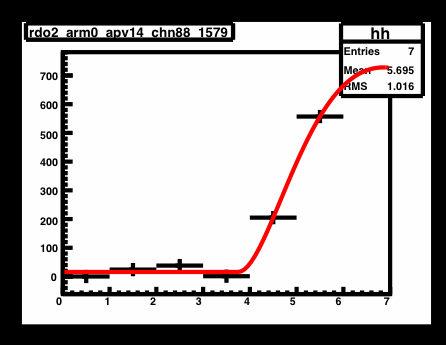
And finally others that I suspect come from a previous bunch crossing, but I'm not sure is the rate of collisions is so high.

Tau for different APVs

- ramdebbe's blog
- Login or register to post comments
