Summary of the study of amplification studies with MUXGAIN set as MGAINSEL
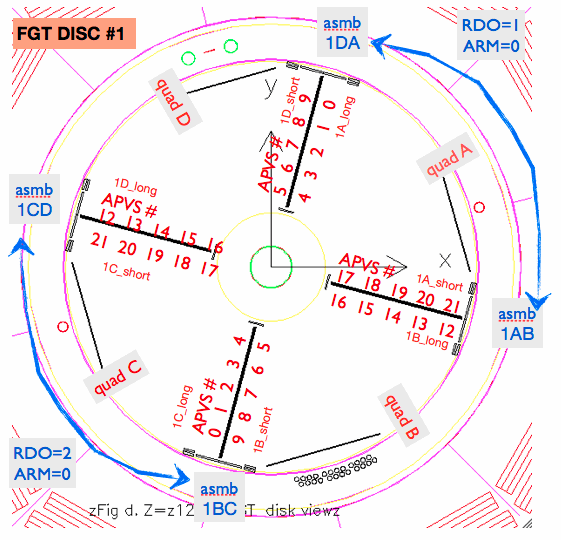
The MGAINSEL parameter was changed in assembly 1DA the "long" side of that assembly (RDO=1,ARM=0 apvs 0 to 4 have the nominal value (MGAINSEL=2) and the corresponding neighbors on the short side had the parameter set as is shown below:
RDO=1 ARM=0 GROUP=0 APV=0 VPSP=46 LAT=87 # run 12: 1DA
APV=1 VPSP=46 LAT=87
APV=2 VPSP=46 LAT=87
APV=3 VPSP=46 LAT=87
APV=4 VPSP=46 LAT=87
APV=5 VPSP=46 LAT=87 MGAINSEL=2 (no change)
APV=6 VPSP=42 LAT=87 MGAINSEL=0 (lower gain by 20%)
APV=7 VPSP=45 LAT=87 MGAINSEL=1 (lower gain by 10%)
APV=8 VPSP=42 LAT=87 MGAINSEL=3 (raise gain by 10%)
APV=9 VPSP=46 LAT=87 MGAINSEL=4 (raise gain by 20%)
A comparison is made for each of the APV that had their gains modified with their neighbor on the "long" side as shown in the figure below:

The figures below have the distribution of adcmax, the maximum value of pedestal subtracted adc in the pulse. All pulses accepted for this study had a good fit to Len's function (chi2/dof <2.)
Figure 1 No change in gain MGAINSEL = 2 APV=4 and 5

Slope for APV=5 -4.29X10^-3 ± 3X10^-4 Slope for APV=4 -4.28X10^-3 ± 4X10^-4
The red histogram correspond to the APV=5 MGAINSEL=2 (no gain change)
<hr />
Figure 2 MGAINSEL = 1 applied to APV=6 neighbor APV=3

Slope for APV=6 -6.19X10^-3 ± 7X10^-4 MGAINSEL=0 Slope for APV=3 4.43X10^-3 ± 4X10^-4
The red histogram (APV=6) correspond to pulses that were reduced by 10%
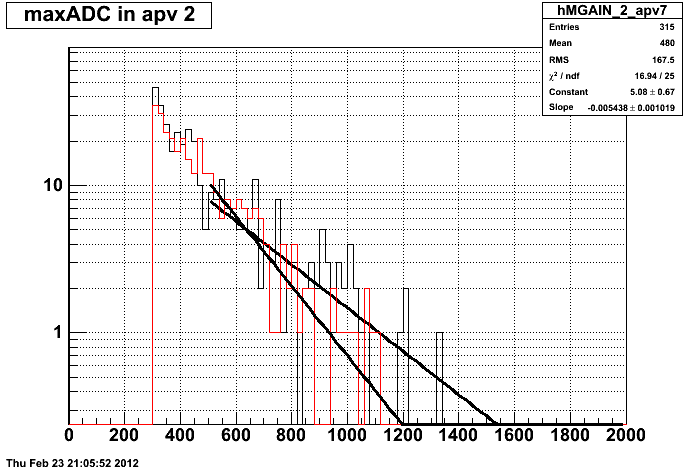
Figure 3 MGAINSEL=1 gains reduced by 20% APV=7 and APV=2

APV=7 Slope: -5.44X10^-3 ± 1X10^-3 MGAINSEL=1 APV=2 Slope: -3.88X10^-3 ± 8X10^-4
Red histogram (APV=7) has pulses whose gain was lowered by 20%
Figure 4 MGAINSEL = 3 APV=8 and APV=1

APV=8 MGAINSEL=3, Slope: -4.46X10^-3 ± 4X10^-4 APV=1 Slope: -5.14X10^-3 ± 9X10^-4
Red histogram: pulses from APV with gain raised by 10%
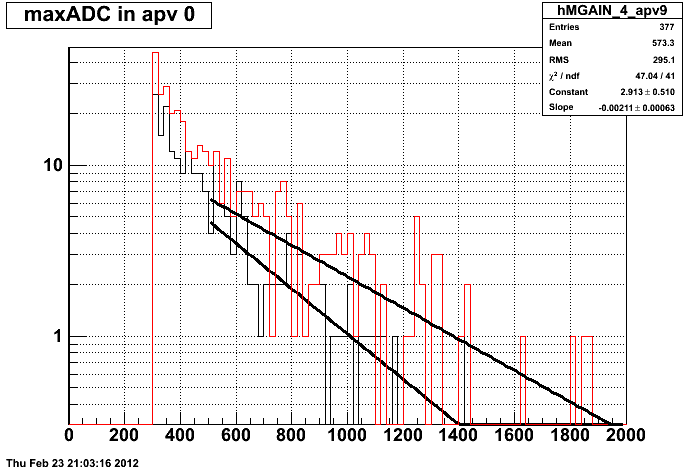
Figure 5 MGAINSEL=4 gains raised by 20% APV=9 and APV=0

APV=9 MGAINSEL=4 Slope: -2.11X10^-3 ± 6X10^-4 APV=0 Slope: -3.03X10^-3 ± 9X10^-3
Red histogram filled with pulses from APV=9
Barring some normalization problems, I would claim that at this point we see the 20% change in gain. The smaller change of 10% is harder to see just comparing the slopes of the max adc distributions. But fitting the distribution to exponentials brings up the difference.
In conclusion, MUXGAIN will be a good parameter to equalize the gains.
- ramdebbe's blog
- Login or register to post comments
