Some rough results from FGT APV tuning
We have collected data for several values of VFS
We now fit to Landau distribution shapes:
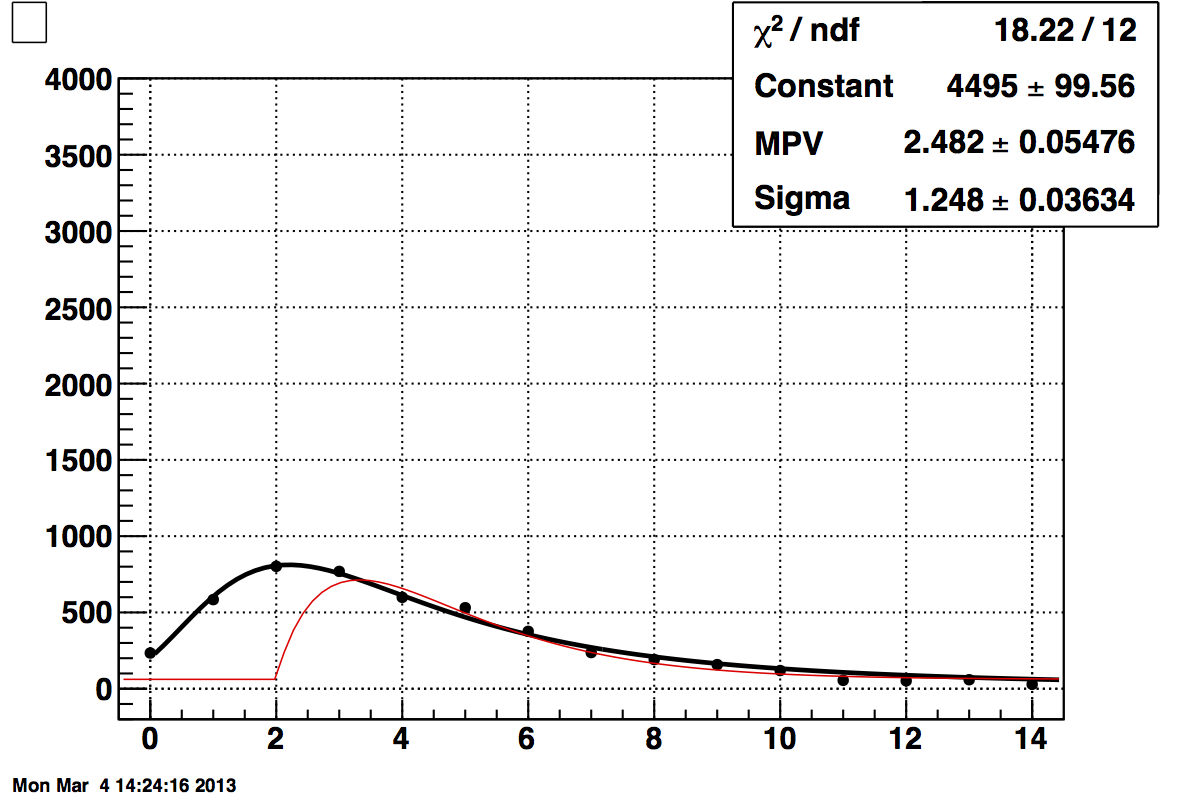
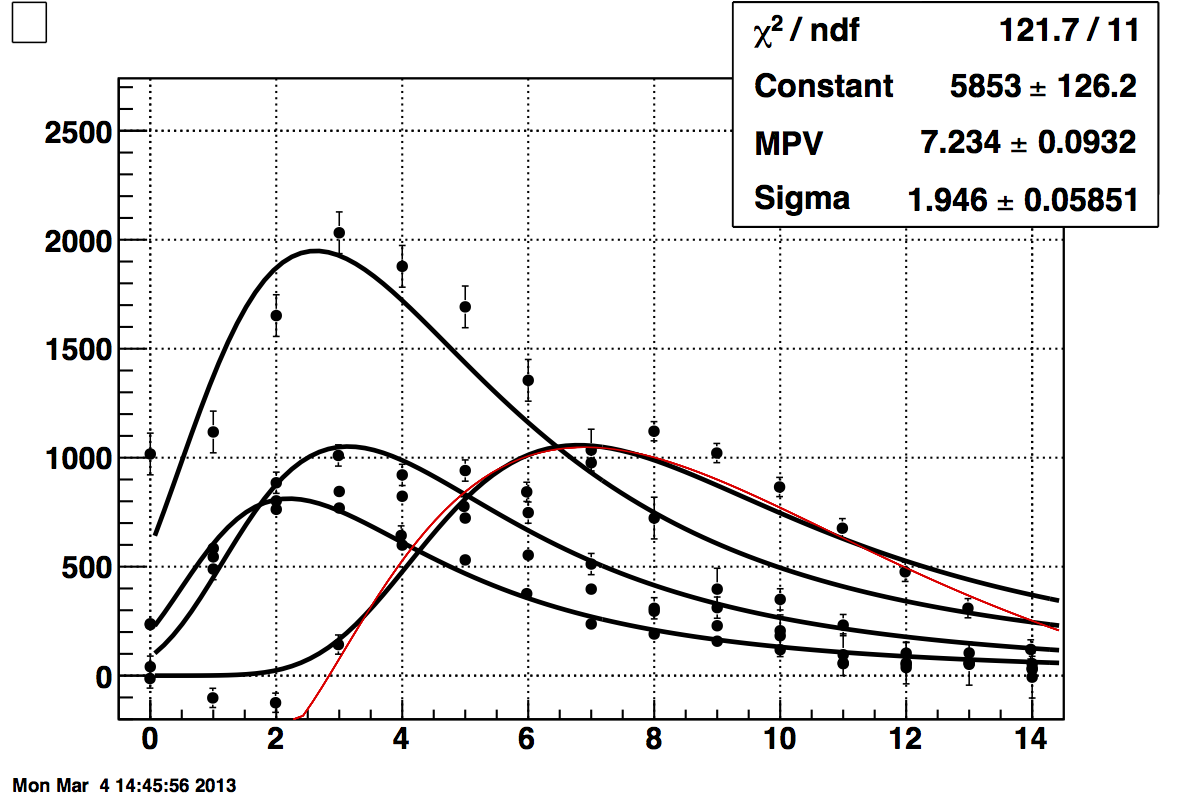
These two figures show how well the Landau shape reproduces the pulses. The shape we used before fails to reproduce the raising side of the pulse too often.
--------------------------------------------------------------------------------------------------------------------
--------------------------------------------------------------------------------------------------------------------
run14065105 VFS=0


--------------------------------------------------------------------------------------------------
--------------------------------------------------------------------------------------------------
run14062106 VFS = 30
----------------------------------------------------------------------------------------------------------------
_________________________________________________________________________________________________________________________________
run14062107 VFS=60
----------------------------------------------------------------------------------------------------------------------
----------------------------------------------------------------------------------------------------------------------
run14062108 VFS=90

This is indicating that the signal started to be corrupted. The VFS=90 does not produce good pedestals I need to redo this and VFS=120 values.
.gif)
----------------------------------------------------------------------------------------------
--------------------------------------------------------------------------------------------------
The last point on ths graph need confirmation with a run with shifted pedestals to avoid "saturated pedestal"
- ramdebbe's blog
- Login or register to post comments