A proposal to change the VFS apv parameter
The plot that follows is a summary of the change in the average rise time of the pulses seen during the VFS parameter scan.
The analysis of the APV parameter scan concentrated on the signal detected in Disc 1. The results were obtained in some cases with pulses from the first quadrant, all four quadrants or event all phi strips in Disc 1. No appreciable difference was found during these three analyses.
We are now focusing on the fact that, in contrast to the effect of the VFP parameter, changes in VFS do modify the output pulse shapes. As we plan to go back to an FGT read-out mode which will reduce dead-time or memory use by trying to fit as much pulse time information in a number of time bins that could be as low a 6. A decision to make our pulse shorter that could bring benefits and doesn't appear to have obvious drawbacks.
The plot shown above has the average rise time of the pulses for runs collected with different values of the VFS parameter. (The definition of rise time is the usual "time for signal to reach 90% of it's maximum). There is ~1.5 time bin change in rise time for VFS changing from 0 to 120. From the value of VFS we used last year (VFS=70) we could make our pulses rise faster by ~0.8 time bins (~20ns)
if we change VFS to values below 10.
The following figures below show three snapshots of the pulse behavior for each value of VFS:
The left most figure shows the Landau shapes obtained fitting each pulse drawn at an arbitrary fixed time. These plots let you see the common characteristics of the pulses. The rise time was extracted from those plots.
The middle plot shows the difference "data - Landau fit" we filled them mainly to look for the presence of "undershoot" in the pulses. Finally, the right most plot shows bin 15 of the previous one to emphasize any possible deviation from 0. The rows of plots correspond, from top to bottom to the values VFS=0, 30, 60, 90 and 120.
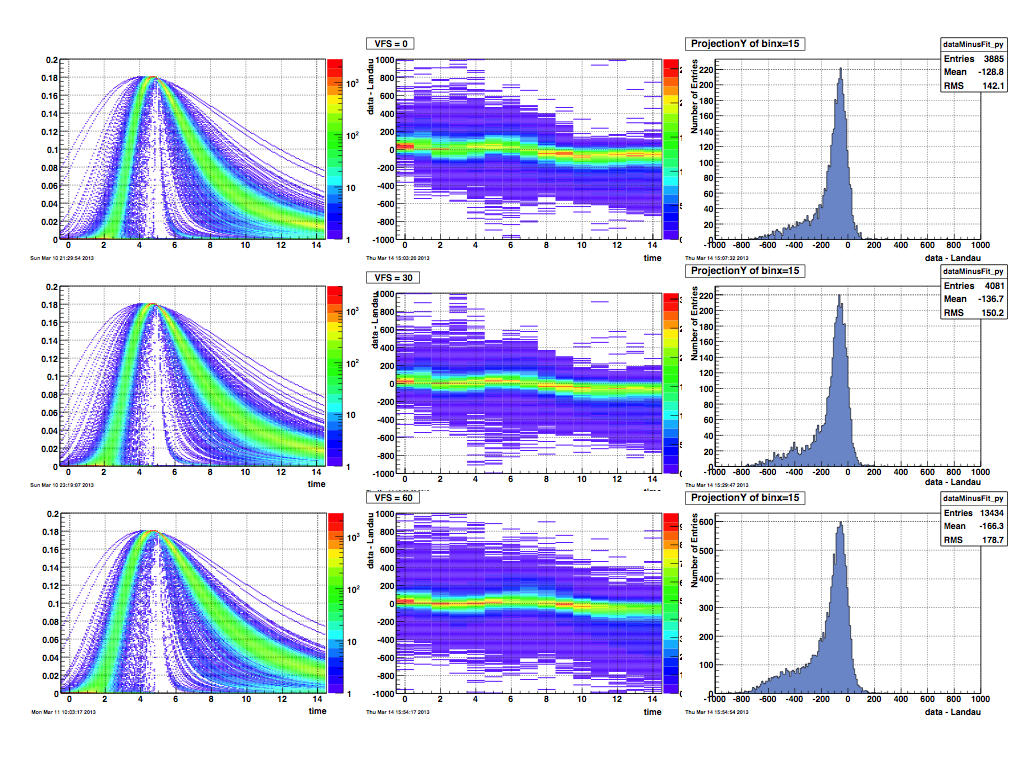
The fit to the Landau distribution is well behaved and the pedestal width is a good estimate of the error on each time bin measurement:
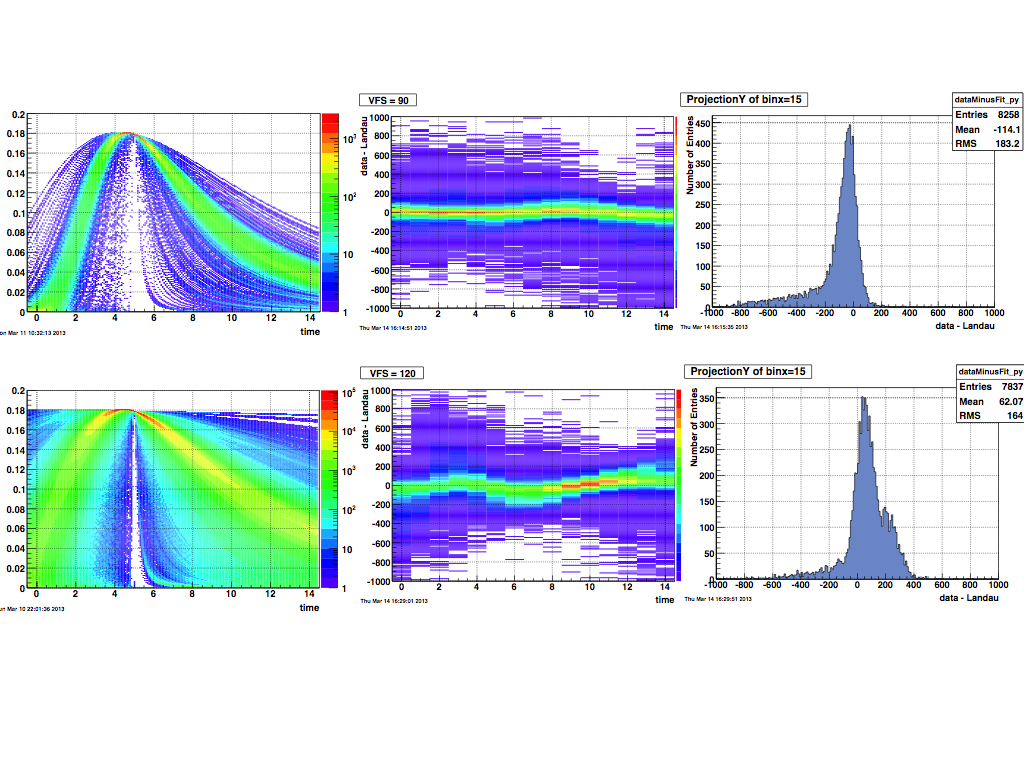
The variation of the pulse shapes as VFS changes is obvious, the difference "data - Landau fit" shows similar systematic features at all values of VFS execpt VFS=120 where the difference above time bin 8 becomes positive, in contrast to the other plots where it appears that the Landau tail extends further than the data.
The main message I extract from these two sets of plots is that below VFS=90 the Landau shape reproduces the data equally well.
- ramdebbe's blog
- Login or register to post comments