Corona or electronic noise?
I looked at another run using fgtPedAsPhysics with HV in Physics mode (config file 16) and the activity I saw in previous runs remains localized in the same spots (with the exection of the first run I used 14066069):
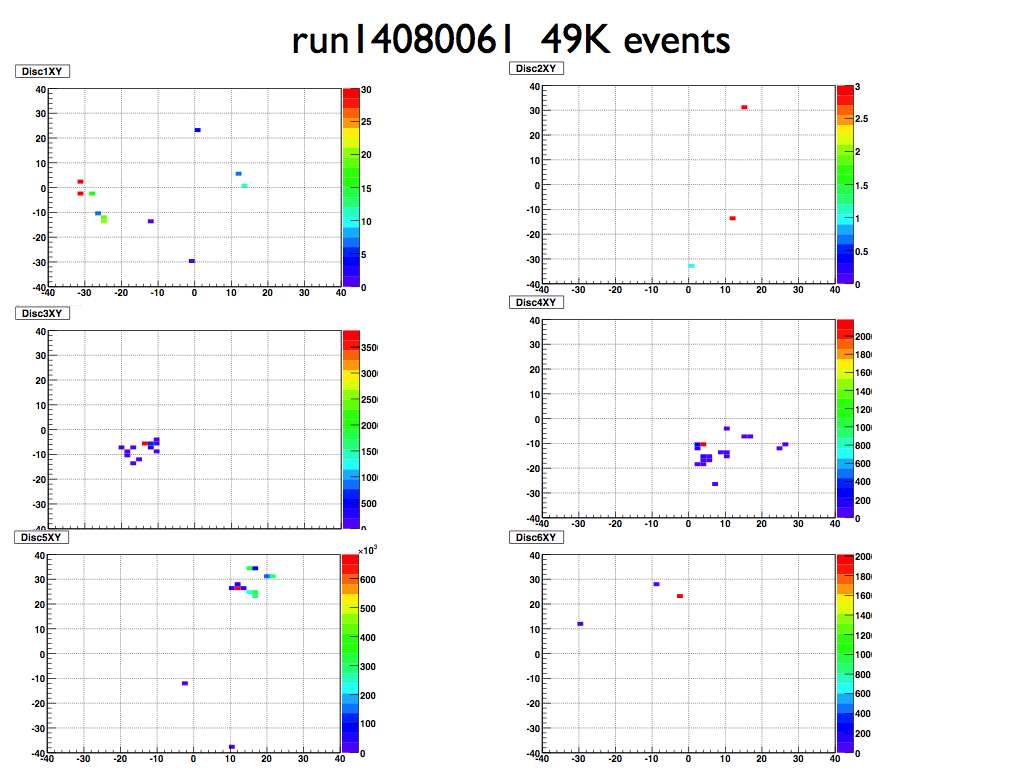
Up to now I had been unable select the the strips that produce the clusters displayed in these plots. This time I did my home work and I'm now able to tell the range of phi and r strips in areas that show activity in the plots above, to do that I use the figure below:
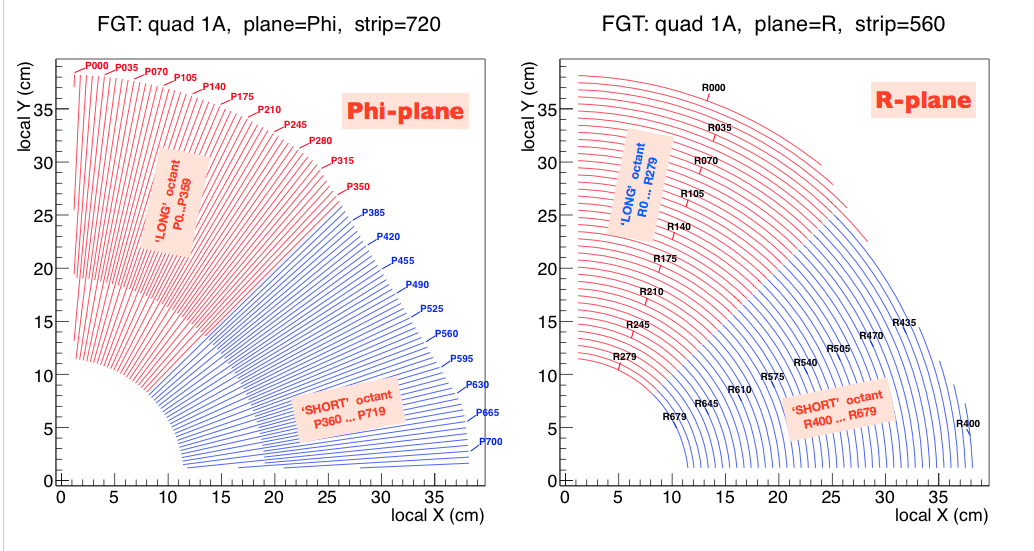
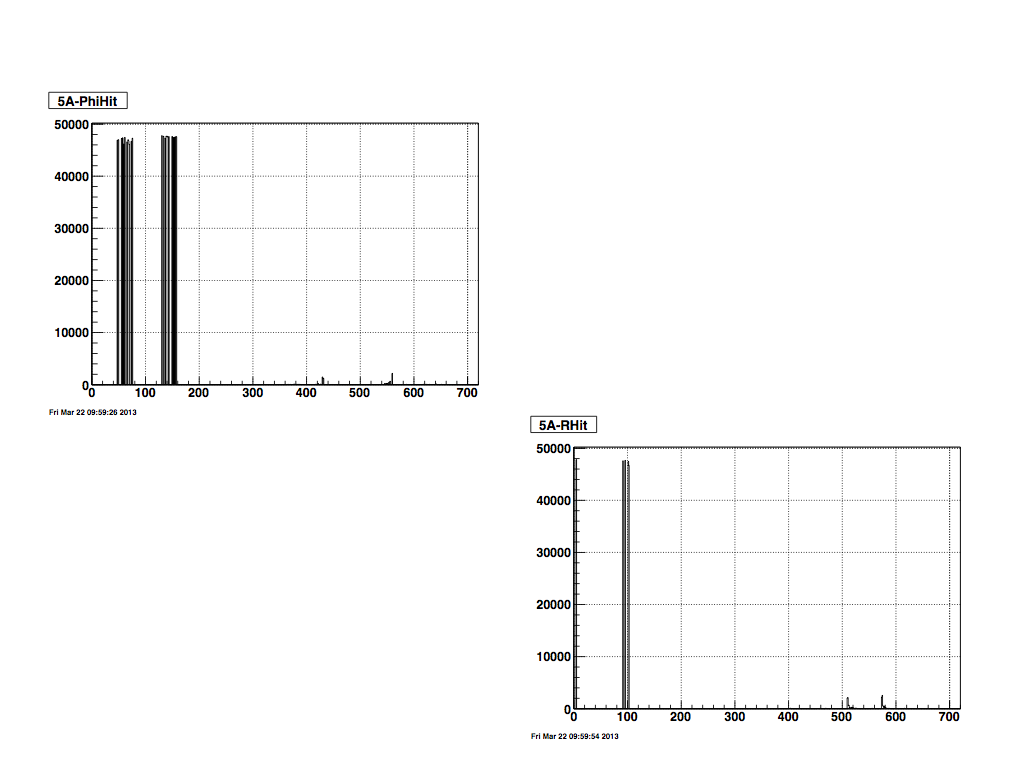
In particular, looking at disc 5 quad A I get the following phi and R distributions where the four spike blob on the upper tip of quad A:
I can then select those strips in disc 5 quad A to be stored and they look very much like noise:
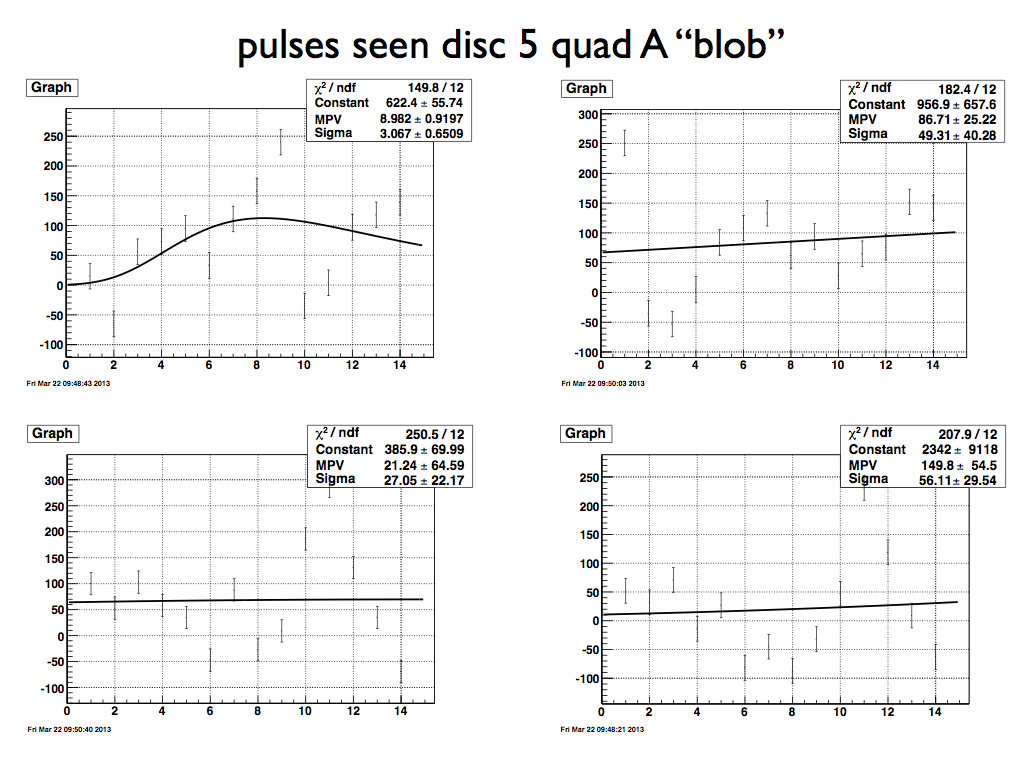
From what I have seen so far, it is likely that all the activity (well localized spikes) seen without beam is mainly electronic noise. I will do similar work on the other discs 1,3,4,6 to confirm this hypothesis.
I a previous test we raised the voltage in disc 5 quad C by 120 Volts without seen activity in that quadrant, the next step would be to take data with that voltage (while monitoring it carefully) and see if we can run that quad at higher voltage.
- ramdebbe's blog
- Login or register to post comments