ADC analysis Cosmic Ray Data
In answering questions about the analysis started at:
drupal.star.bnl.gov/STAR/subsys/epd/2017-cosmic-ray-tests-osu
using the set-up outlined in:
drupal.star.bnl.gov/STAR/blog/rjreed/epd-cosmic-test-2
I have made the following sets of plots. The first is the ADC in all 4 super-sectors for the events I have defined as "vertical cosmic" events. First we should note the order of the super sectors is: SS from top to bottom: 8, 5, 6, 7, with the trigger paddles being located on the bottom. Events are selected that *only* have a single hit in the top and bottom supersector in the same tile. The ADC in each of the 4 supersectors for these events in that specific tile are shown in red. The ADC spectra for all good events is shown in black.
SS 8: drupal.star.bnl.gov/STAR/system/files/AdcSpectra_SS8_0.pdf
SS 5: drupal.star.bnl.gov/STAR/system/files/AdcSpectra_SS5_0.pdf
SS 6: drupal.star.bnl.gov/STAR/system/files/AdcSpectra_SS6_0.pdf
SS 7: drupal.star.bnl.gov/STAR/system/files/AdcSpectra_SS7_0.pdf
By construction there will be no counts in the red histogram in the pedestal region in SS8 or 7 in this configuration.
Next I looked at the ADC in the neighboring tiles on the same side in this configuration, and correlated them with the adc of the selected tile. The distribution for all 4 super sectors can be found at:
Odd: drupal.star.bnl.gov/STAR/system/files/AdcVertNeighborsOdd08222017.pdf
Even: drupal.star.bnl.gov/STAR/system/files/AdcVertNeighborsEven08222017.pdf
Two examples:
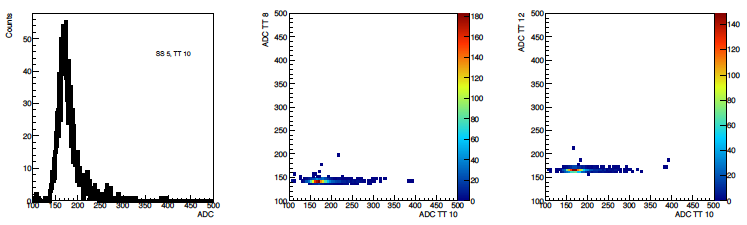
Figure 1: SS 5 TT10
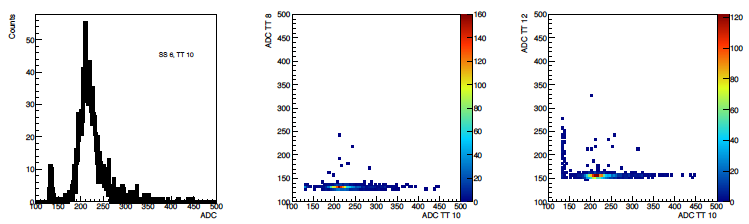
Figure 2: SS 6 TT 10
We can see the misalignment in SS6 in the TT10 TT12 correlation. Not sure if the few counts in the middle represent cross-talk or what, there are very very few of these in the other SS, so I suspect misalignment.
- rjreed's blog
- Login or register to post comments