EPD Cosmic Test 2
EPD Cosmic test stand for this test is shown at:

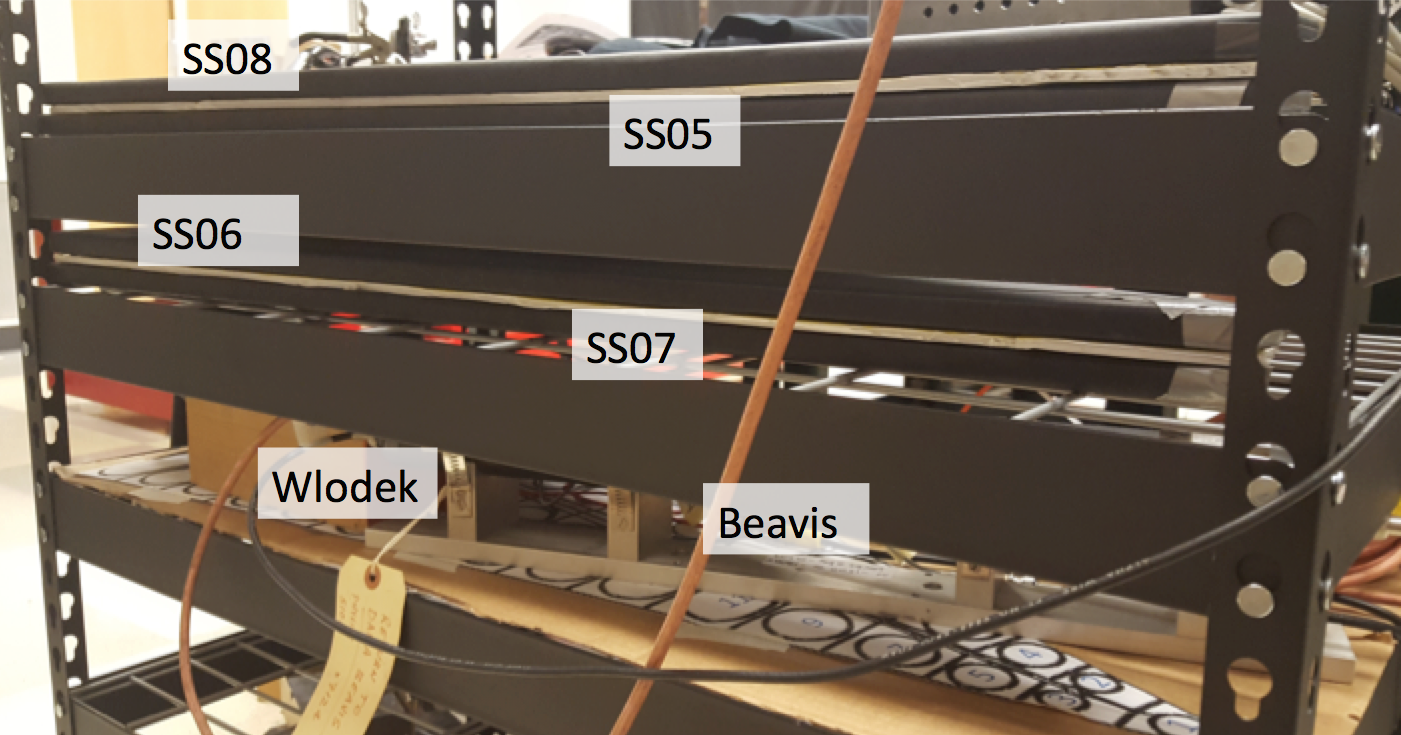
Figure 1: Cosmic Test Stand on August 10th, 2017
Currently we are running 4 SS at the same time (right now analyzing the data on odds, only). This uses 4 FEE cards, and 6 12 channel 10 bit ADC LeCroy 2249. This set up looks at only 15 channels at a time, so that swapping between odds and events will only require a switch of the fiber bundle/FEE, and due to electronics space. Initially we had the super-sectors separated by a space of nearly 2 ft, but the data rate was very slow so we switched to this configuration.
First we needed to select the threshold for each of the channels:
drupal.star.bnl.gov/STAR/system/files/EpdAdc_08102017.pdf
This allows us to look at the hits per supersector and for the system as a whole:
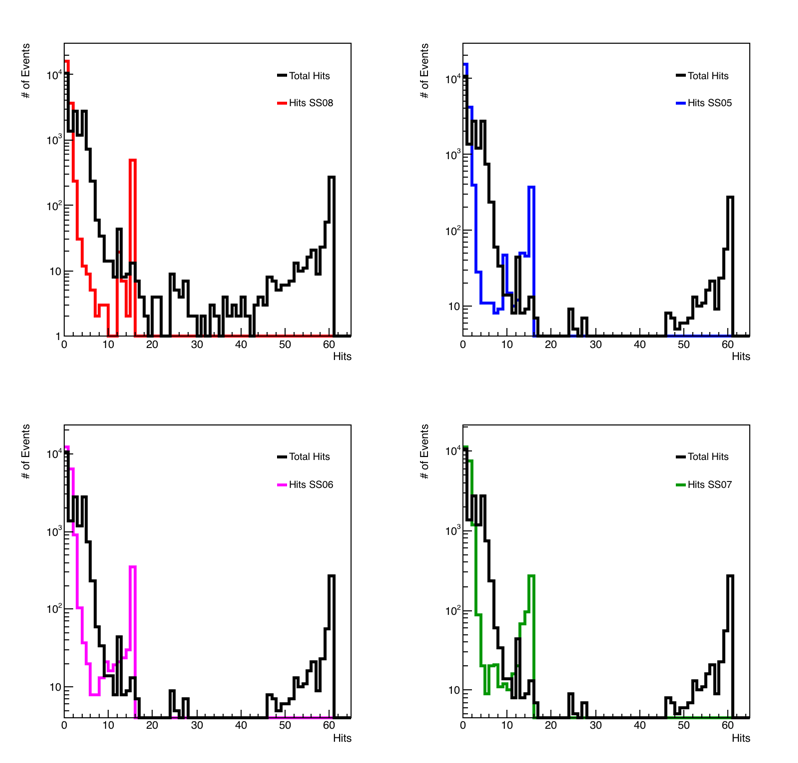
Figure 2: The black curves in all 4 plots are the sum of the hits in all 4 supersectors. The upper left is SS08, the upper right is SS05, the lower left is SS06, and the lower right is SS07.
As shown in our earlier test (drupal.star.bnl.gov/STAR/blog/rjreed/epd-cosmic-test-1), the adcs sometimes light up. Now we are currently saving the data by FEE, which doesn't line up perfectly with the ADCs, so it's not as easy to see. However, we can still make selections on good events. This is rather important as the tiles that do not line up with the trigger detector will actually have more hits due to this "lighting up" more than actual hits. This makes it difficult to determine both efficiency and cross talk. This can be seen in:
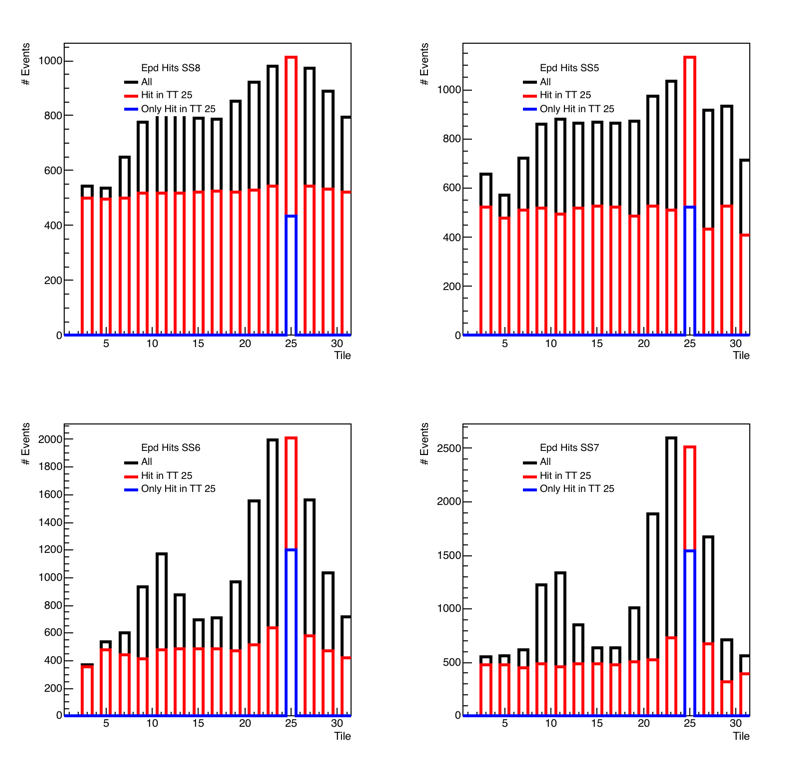
Figure 3: Hits per tile in the 4 super sectors without any event selection criteria. In black are the total number of hits in a given super sector. (Upper left is furthest from the trigger, than upper right, than lower left, then lower right.) We can see the enhancement due to the trigger detectors around TT 9/11 and 21/23/25/27. In red are the hits in tiles from events that have a hit in TT 25. This is the indication that there is a problem, as most hits in the lower tiles come from events where TT25 was hit. This doesn't make sense as the trigger detector will cause us to not select horizontal cosmics, and this is far and above what we would expect with showers.
After looking at the data, I decided to select only those events where the hits in a particular SS were less than 5. (I also trivially select against events with no hits in any supersector, which removes ~50% of the "data".)
.png)
.png)
Figure 4: Counts per tile, on the right each SS is separate, on the left they are plotted in the same plot. In this document the order with respect to the trigger is always the same, top left, top right, bottom left, bottom right. The effects of both Wlodek and Beavis can be seen, though a little washed out (as expected) in the more distant SS.
.png)
.png)
Figure 4: Counts per tile, with the same UL, UR, LL, LR distribution with respect to the trigger detector. The black distributions are simply the counts per tile, and are the same on the left and right. The red distributions are the counts, selecting on events with a hit in TT 23 (left) and TT 25 (right). The blue distribution is the number of events in a given super sector that only have a hit in tile 23 (L) and tile 25 (R).
We see in Figure 4 that most of the weird counts have been removed, and that for the most part a hit in a given tile is an isolated hit. We can turn these plots into probability distributions.
.png)
.png)
Figure 5: This shows the probability (i.e. the ratio of the red histogram and black histogram from Figure 4) of having a hit in a given tile, assume a hit in tile 23 (left four) or a hit in 25 (right four). Obviously the probability is 1 by construction in the tile of interest. As shown in the figure caption, the isolation probability is from 90 - 80%, with tiles further from the trigger detector more likely to be isolated.
Next, I wanted to look at events where cosmic rays nearly went vertically through the EPD. Once again, I'll just look at TT 23 and TT 25.
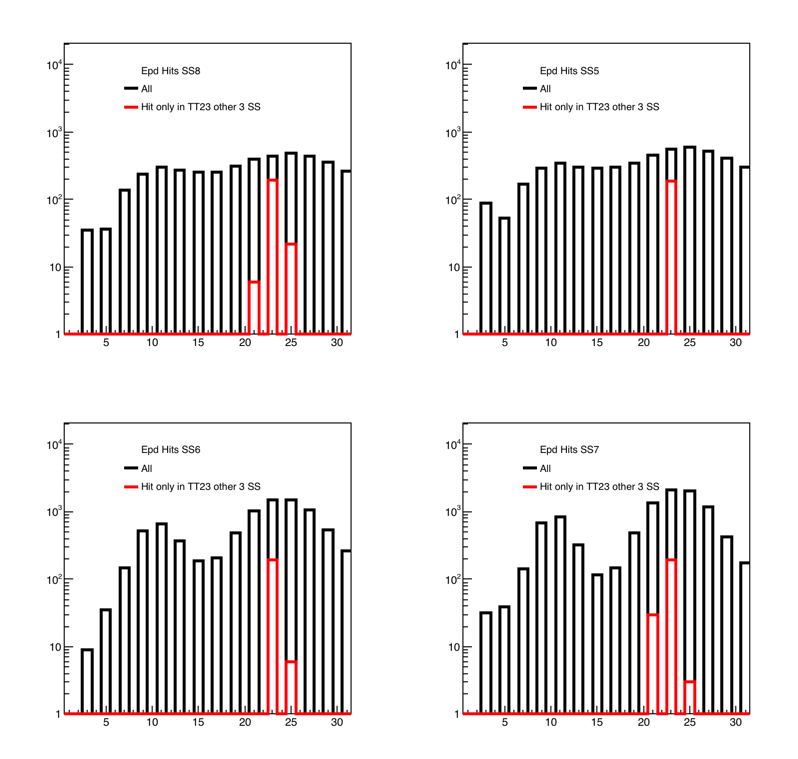
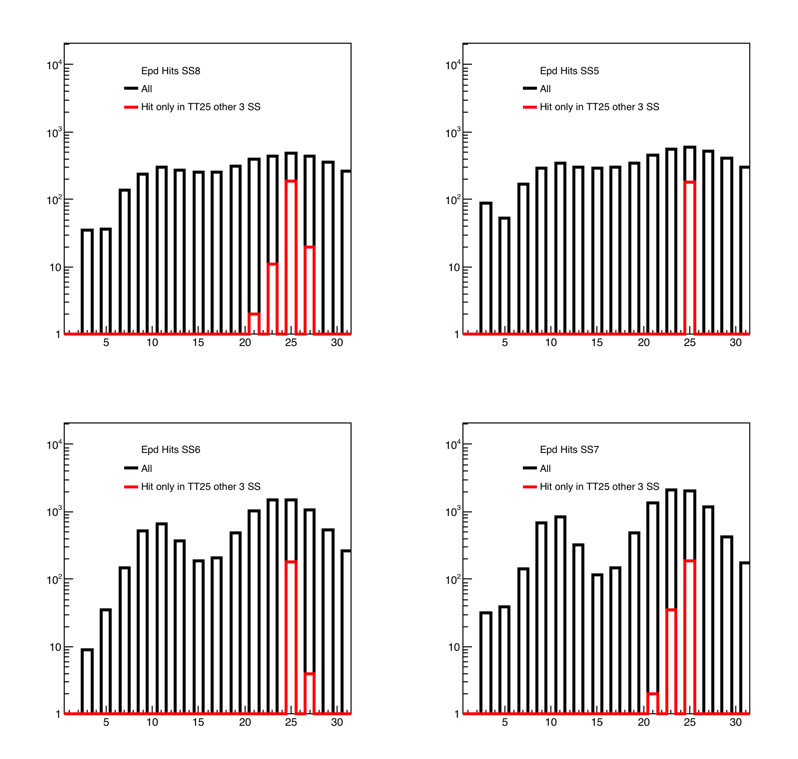
Figure 6: As before, grouped into two groups of four, in the order TL, TR, BL, BR where BL is the closest to the trigger. The black histogram, as before, shows the number of hits. The red histograms show the distribution of hits if the other three super sectors have a single isolated his in TT 23 on the left and TT 25 on the right. It is expected that the SS on the edges will have some drift, as the angle of a cosmic ray can allow this. The fact that SS06 has some off hits indicates some level of cross talk.
If we're truly seeing cosmic rays, we should also see the distribution shift if we choose tiles that are not directly across from one another as above. This is done in:
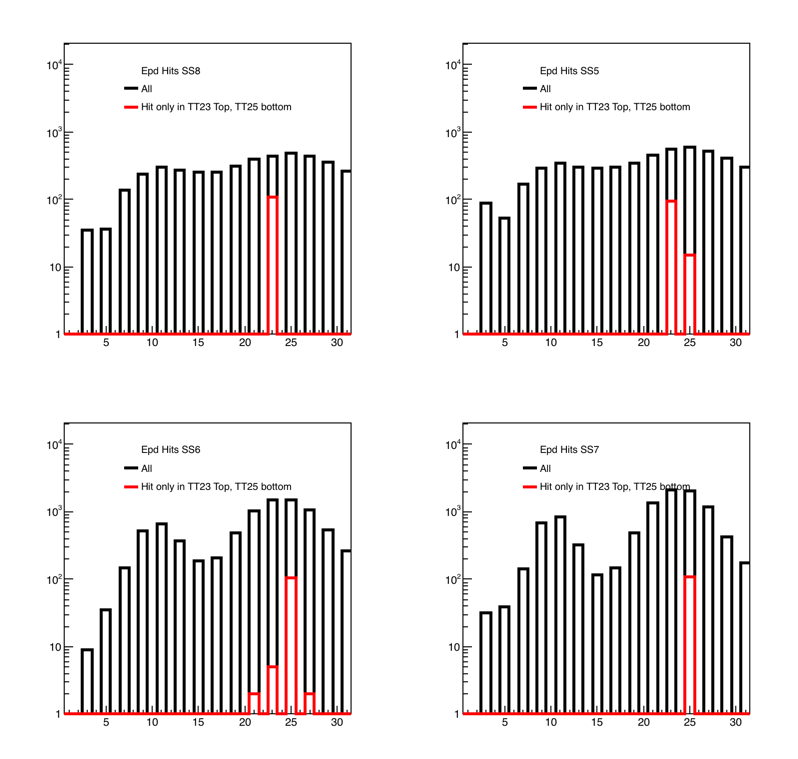

Figure 7: As before, the black distributions are the same. In the left four plots, the outer SS was required to have an isolated hit in TT 23. The inner SS was required to have an isolated hit in TT 25. As expected the cosmic rays can mostly be traced between the two, with some hint of cross talk in SS06. The opposite distribution is created on the right four plots, here an isolated hit in TT 25 in the outer SS is required, and an isolated in in TT 23 in the lower SS is required.
The distributions for the 4 plots on the left (in order TT 21,23,25,27) are below:
0 107 0 0
0 95 15 0
2 5 106 2
0 0 107 0
The distributions for the 4 plots on the Right (in order TT 21,23,25,27) are below:
0 0 181 0
0 33 156 0
3 152 39 0
0 181 0 0
There is some probability of double hits, as expected. but the fact that SS06 has hits outside of the 2 chosen tiles indicate cross-talk.
All the plots in one document can be found at:
drupal.star.bnl.gov/STAR/system/files/CrossTalk_08102017.pdf
Assuming the worst case scenario for SS06, 3/152 = 2% chance of cross talk.
- rjreed's blog
- Login or register to post comments