Centrality and the EPD II
This is a continuation of the study started at: drupal.star.bnl.gov/STAR/blog/rjreed/centrality-and-epd
If we look at the ADC spectra of a single tile:
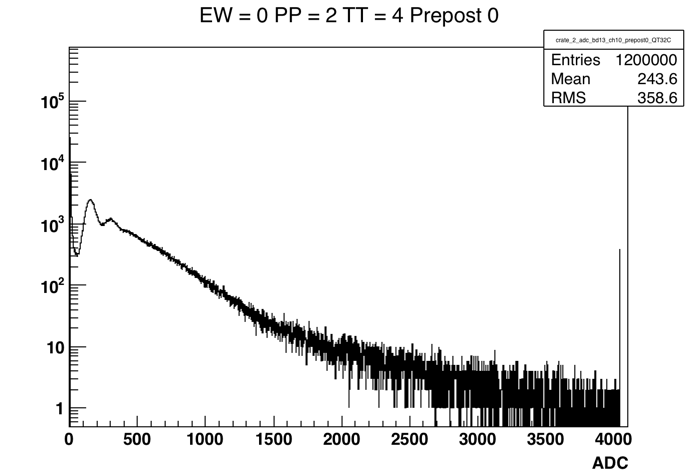
Figure 1: ADC spectra 1 tile. The one and two mip peaks are clear, as is the saturation at 4095.
The question is whether reducing the vbias to lower the adc of the first mip peak will give us more dynamic range in terms of centrality by decreasing the number of tiles that are ADC saturated. It would be difficult to study it this way, so instead we will decrease the dynamic range by assuming that ADC > 3000 is saturated. (I.e. if ADC > 3000, set ADC = 3000).
First, let's look at the number of saturated tiles we have in a given event:
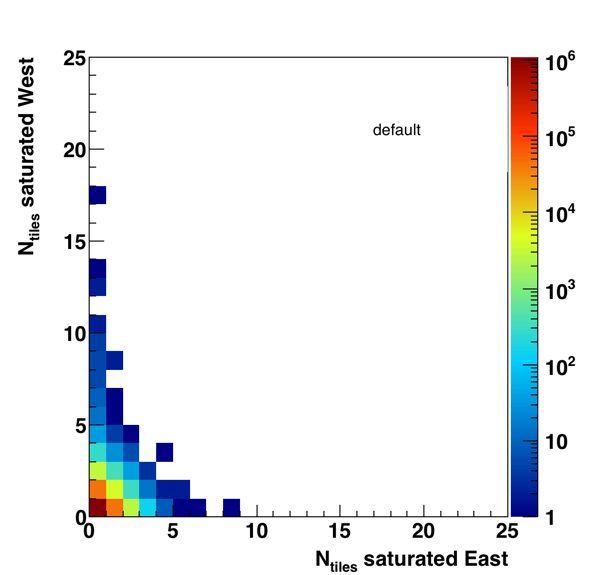
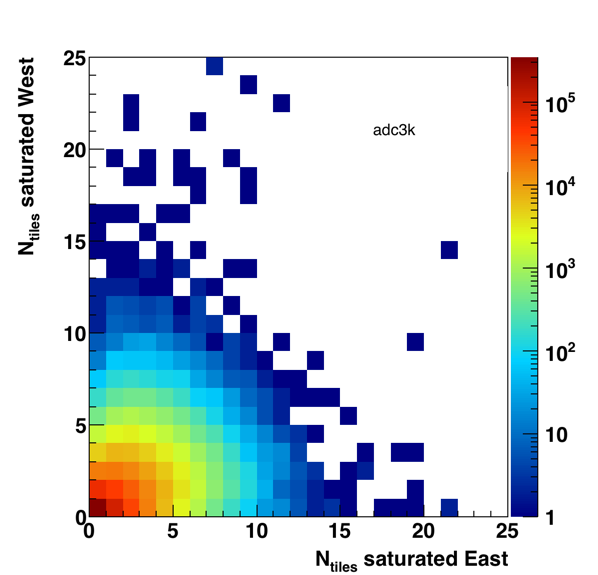
Figure 2: The number of saturated tiles in a given event for a max adc of 4095 on the left and 3k on the right.
From Figure 2 we learn a few things, one is that the vast majority of collisions do not have saturated tiles. In the default case, it is a very rare occasion. On the left we see that the numbers would increase considerably. The lack of correlation indicates that this can't be strongly centrality dependent as we'd expect an increase in both the east and west sides that are the same.
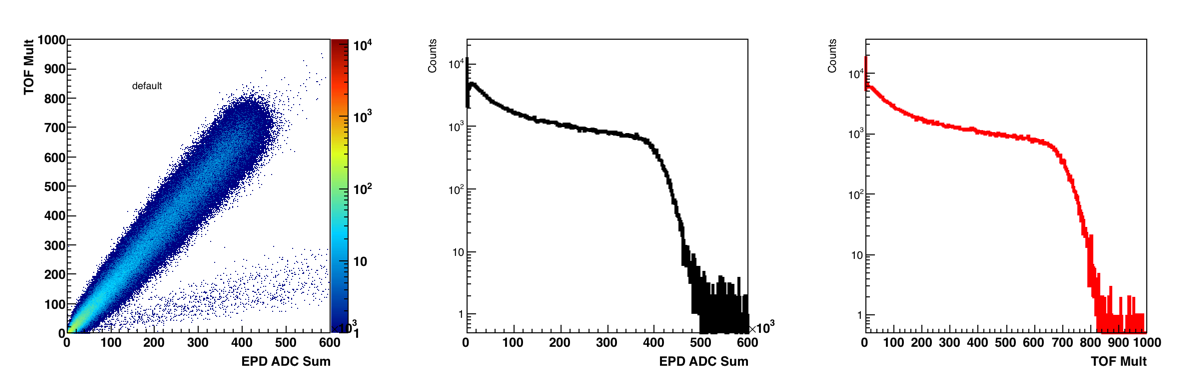
Figure 3: Tof Mult versus EPD ADC sum. In order to evaluate the centrality performance we will use the tof mult. We see that in the default case (other than the 2nd class of events) that the response is quite linear.
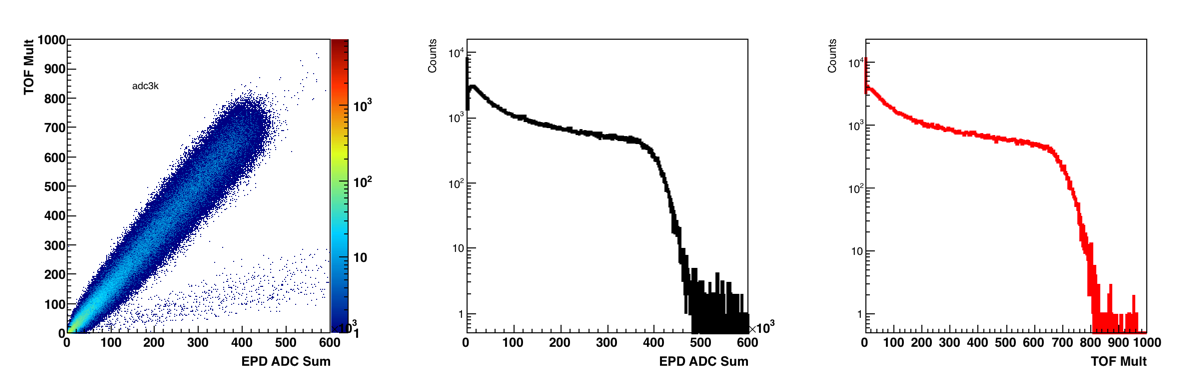
Figure 4: Tof Mult versus EPD ADC sum where max ADC is 3000. We see that this difference is very minimal. (Probably just in the tails where it is hard to see. (It should be noted that these aren't precisely over the same number of events.)
Let's compare these guys directly.
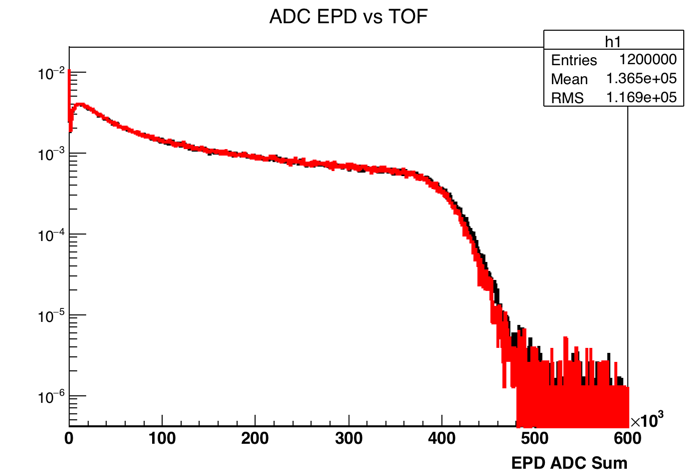
Figure 5. EPD ADC spectra with the default in black, and then the distribution forcing tiles to saturate at ADC = 3k in red. The difference is mainly seen on the high end. Note: This histograms were normalized by dividing by the integral.
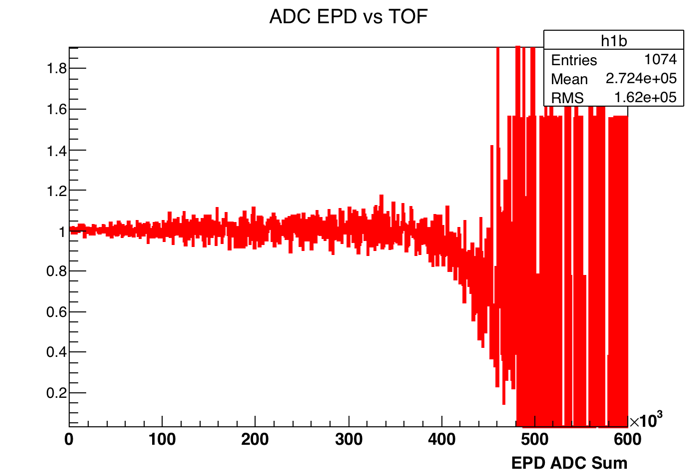
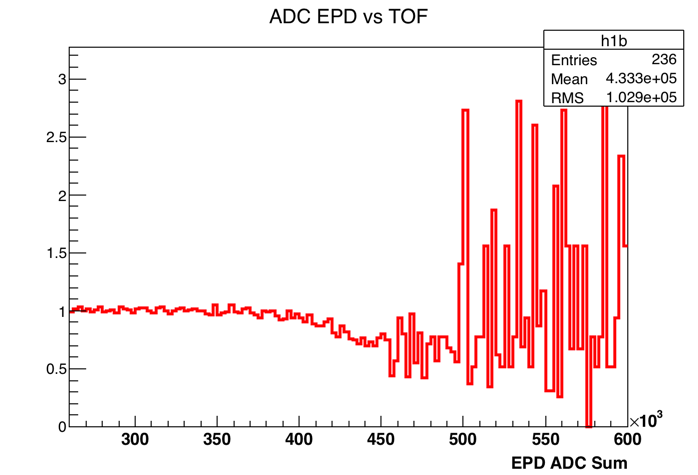
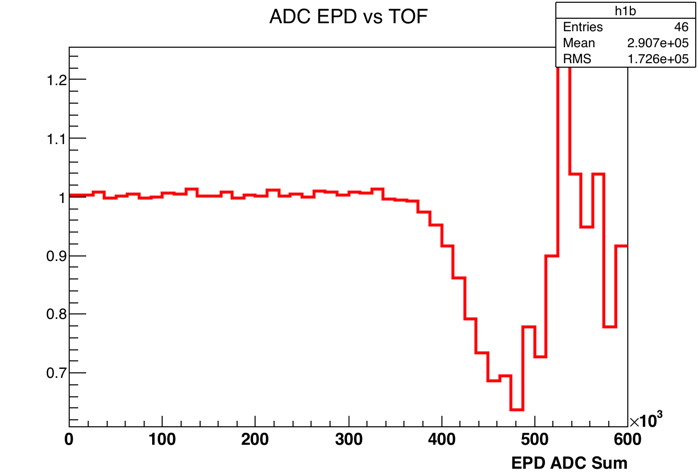
Figure 6. Ratio of the plots from Figure 5. The only difference is the binning... This only plays a role in the 0 - 5% centrality selection.
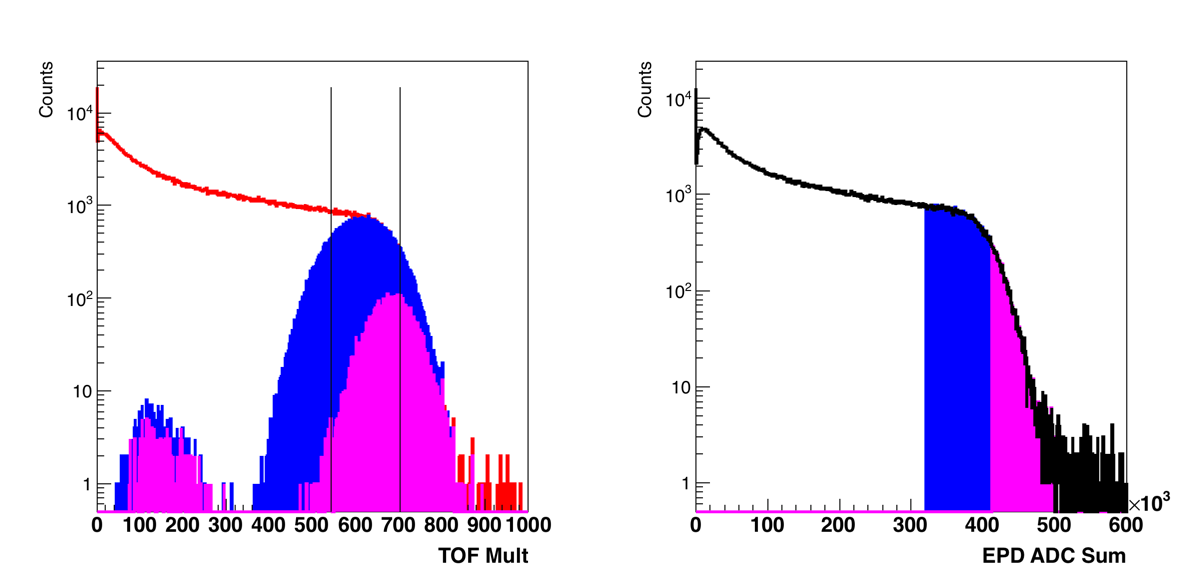
Figure 7. Using the EPD to select 0 - 10% (blue) and 0 - 1% (purple) events in the TOF. The lines shown on the left show where we would put the cuts if we were making the same centrality selection using the TOF.
We can see that selection 0 - 1% in the EPD does select central events, but only about half of them are in that centrality bin using a different detector, with a few not even in the 0 - 10% bin. (However it should be noted here that it's a little incorrect to divide by the integral in that most of the peripheral events won't leave a signal so we have some bias.)
If we do the same in our special case, we see:
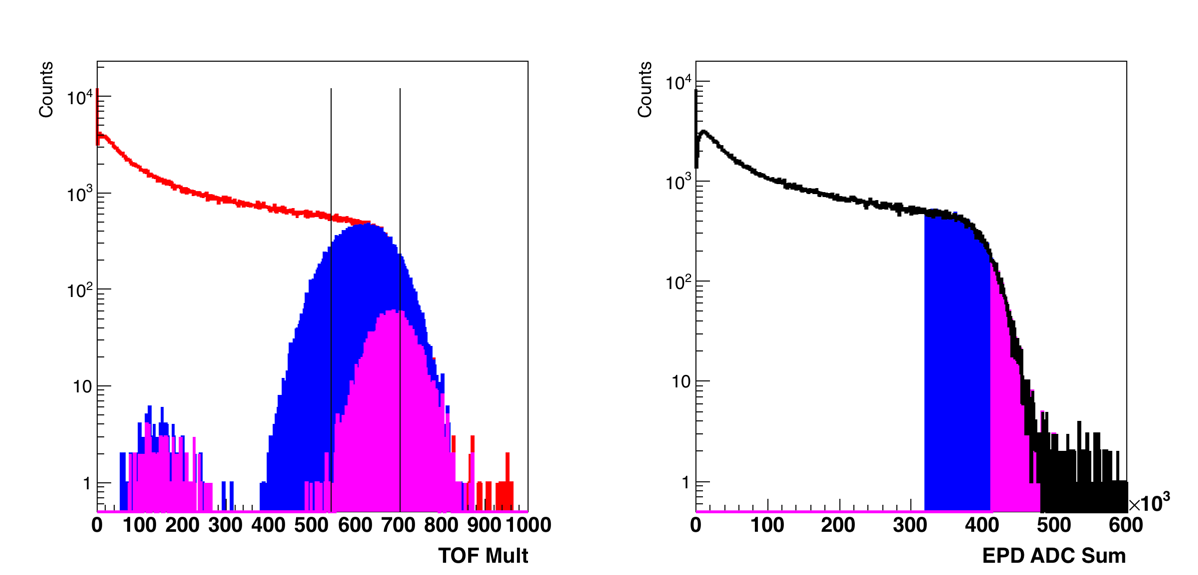
Figure 8. Same as Figure 7, but ADC Tiles can saturate at 3k. The cuts were kept the same in this distribution. It is very difficult to see the difference.
However, the difference in the centrality was on the order of 0.2% (in centrality bin) for both 0 -10 and 0 -1.
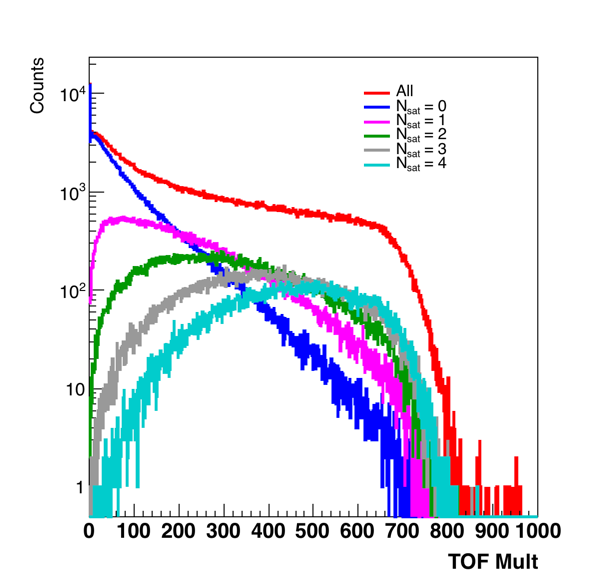
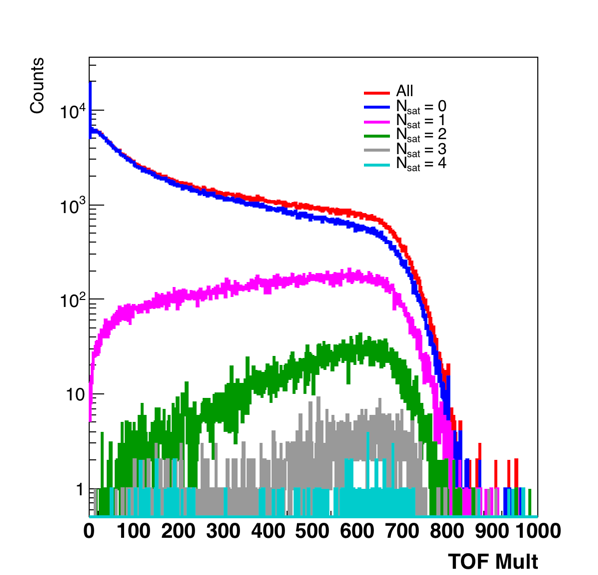
Figure 9. Tof Mult distributions for differing numbers of saturated tiles. On the right, the tiles saturate at 3k, on the right, at 4095.
From Figure 9 we see that with less dynamic range, all of our central events would have some saturation. Whereas in the current configuration, most do not. It should also be noted that this wouldn't change the sum adc by that much, as it would be the difference between the "true" adc and the saturated adc in a single tile (with 743 others contributing.)
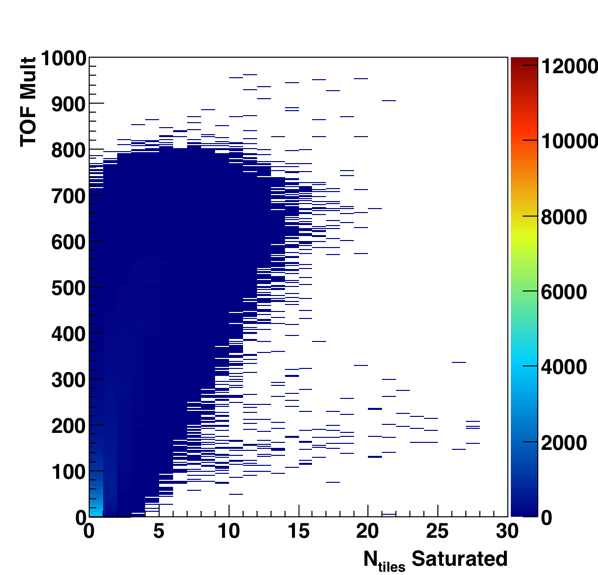
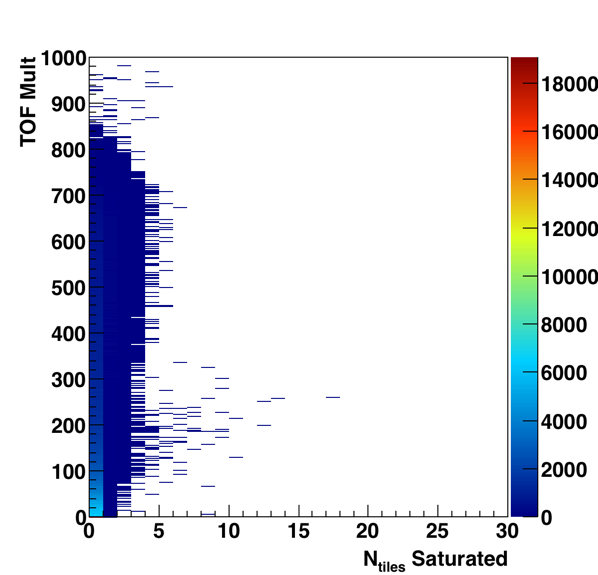
Figure 10: Tof Mult versus number of Saturated tiles, on the left tiles saturate at 3k, on the right the default of 4095.
- rjreed's blog
- Login or register to post comments