Cosmic Ray distribution versus trigger position
Executive Summary: The distributions of hits in the top supersector, when selected on events where a single tile in the bottom-most supersector depend on the trigger position. If the bottom tile overlaps with the trigger paddle, then the distribution of single hit only events in the top supersector will be roughly Gaussian peaked at the same tile, reflecting the fact that the probability distribution of cosmic rays is peaked for those that are vertical. When selecting a bottom tile that does not overlap with the trigger paddle, the distributions peak far away, as we are selecting cosmic rays with a high angle of incidence such that they could hit only the tile that doesn't overlap with the paddle in a straight configuration, but still hit the trigger paddle itself so that the event is recorded.
Analysis
Other than the position of the triggers, and the fact that the even tiles are hooked up to the electronics, the set up for this study is identical to what is shown in: drupal.star.bnl.gov/STAR/blog/rjreed/epd-cosmic-test-2
This analysis was on Even Configuration 1, which had a trigger under tiles 14, 16, 18, 28 and 30. SS index 0 (far) = 8, SS index 1 = 5, SS index 2 = 6, SS index 3 = 7 (near). There were 144896 triggers in this distribution. For the analysis, we only select those triggers that correspond to "good" events. This is defined as an event with at least one hit in the top and one hit in the bottom super-sector, with no single super-sector having greater than 5 hits. This selects events where a cosmic ray has gone through the stack, not a shower, and against events where the issue of the hot bit caused a problem. This yielded 66936 good events.
The ADC distributions and thresholds can be seen at: drupal.star.bnl.gov/STAR/system/files/EpdAdc_even1_08182017.pdf
The distribution of hits in the various SS is:
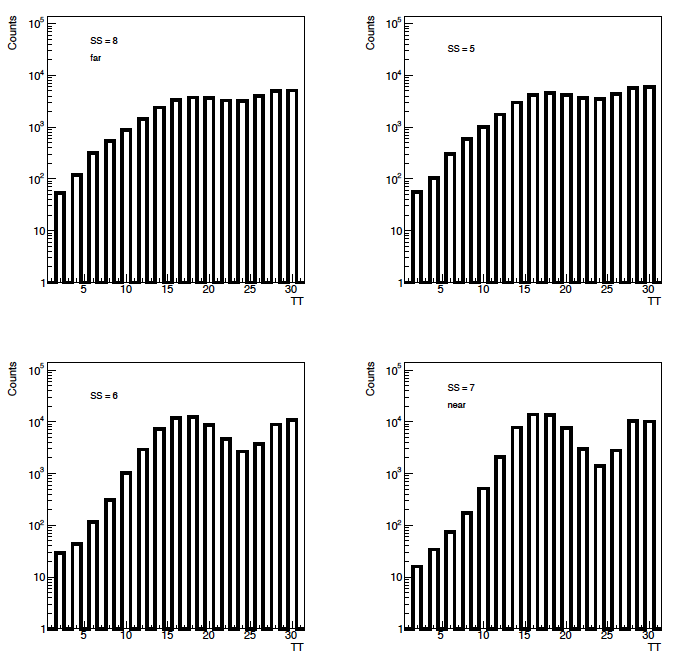
Figure 1: Hits per SS. The position of the trigger paddles is much more visible in the SS closest to the trigger, as expected.
Next we wanted to examine the "good" pairs of hits in the top and bottom super-sector. This is defined as events where there is a single hit in the bottom super sector and a single hit in the top. We will create plots of the number events where there is only a single hit in the top SS, after selecting events that have a single hit in chosen tile in the bottom super-sector.
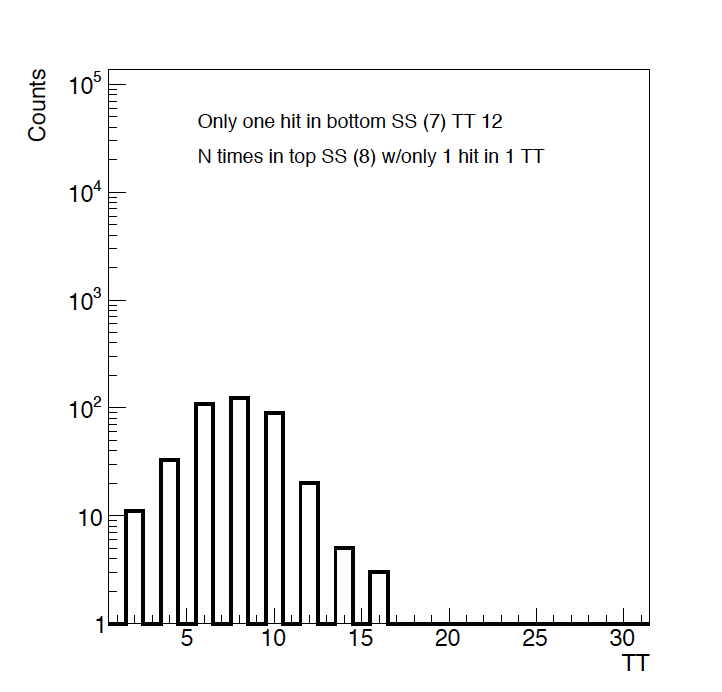
Figure 2: Hit in Bottom TT 12
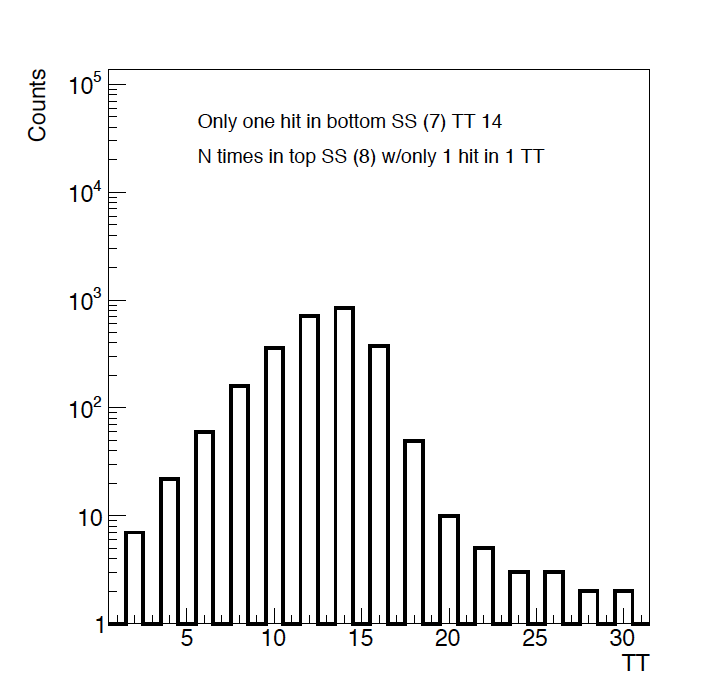
Figure 3: Hit in Bottom TT 14 (trigger)
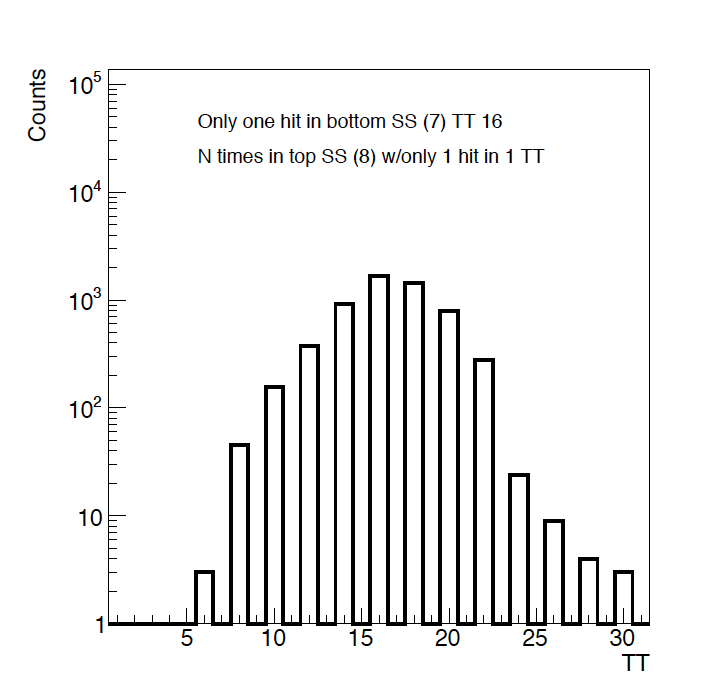
Figure 4: Hit in Bottom TT 16 (trigger)
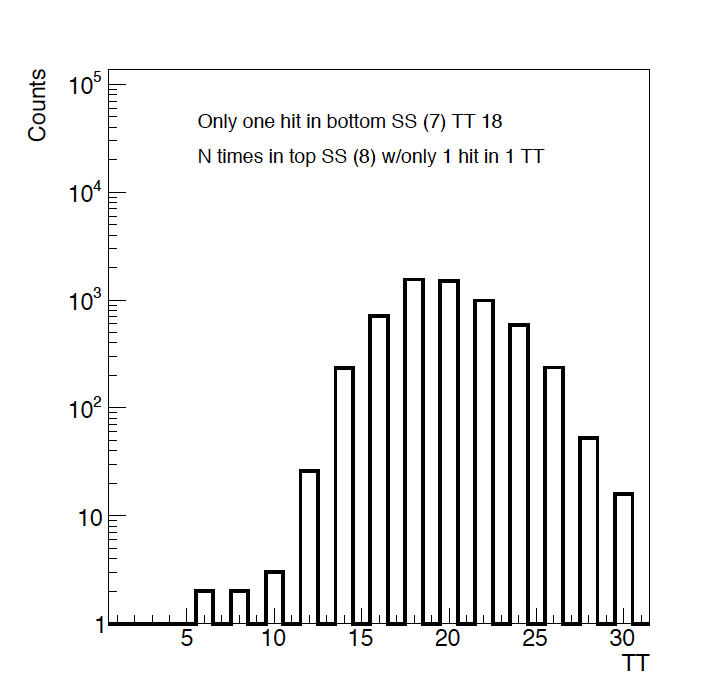
Figure 5: Hit in Bottom TT 18 (trigger)
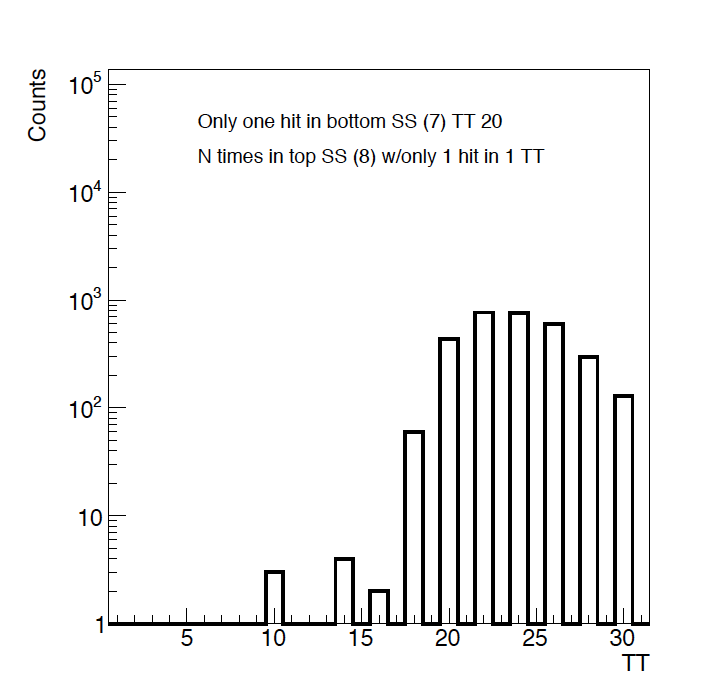
Figure 6: Hit in Bottom TT 20

Figure 7: Hit in Bottom TT 22
In the distributions that correspond to a hit in the bottom super-sector that correspond to a tile covered by a trigger detector, we see an expected distribution that is roughly Gaussian, centered about the trigger channel. (Figure 3 - 5). The most common cosmics should be straight down, so this makes sense, with a distribution that falls off as you get further.
What is interesting is to look at distributions where the event was not selected from the trigger tile, such as Figure 2 or Figures 6 and 7. Here we see the distribution quickly shifts away from the bottom trigger tile. For instance, for TT bottom 22, the peak is really in TT top 30. This also makes sense, we are generally not triggering on vertical cosmics, as they would have missed the paddle. Since TT22 is 2 tiles away from the trigger position at 18, we would be preferentially selecting cosmics with a larger incident angle than in Figure 6, where we are only looking 1 away.
It's this selection bias that causes the interesting and rapidly changing distribution as you go from tiles that are trigger tiles to those who are not.
All of these plots and the tracking plots can be seen at: drupal.star.bnl.gov/STAR/system/files/EPDCosmicHits_even1_08182017.pdf
- rjreed's blog
- Login or register to post comments