EPD Calibration check for 2018 II
We have been trying to figure out what happened in the EPD calibration here:
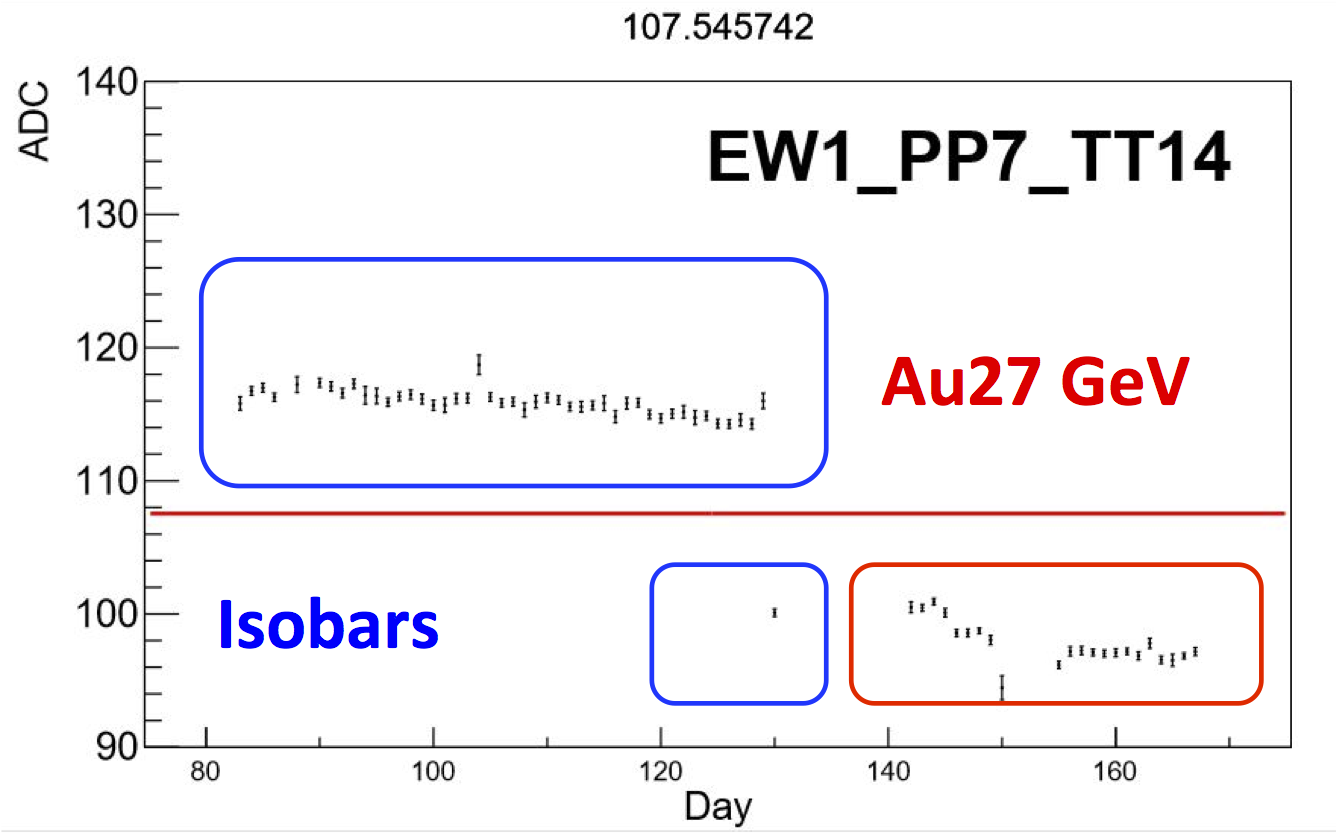
Figure 1: West PP7 TT14 Calibrations
We realized that there were some issues in our application of Mike's nice mip peak fitting formula, which I detail at:
drupal.star.bnl.gov/STAR/blog/rjreed/landau-functions
Executive Conclusion: The fitting range needs to encompass all of the proposed mip peaks. So if the first mip peak is at 120, the second should be a little past 240, and the next a little past 360. If the fitting range isn't at least out to 400, the fit will fail. Secondly, the weights for the different mip peaks need to forced to be positive.
What I have been analyzing are the AuAu 27 GeV data that were officially produced, and an isobar file that I have produced from day 123.

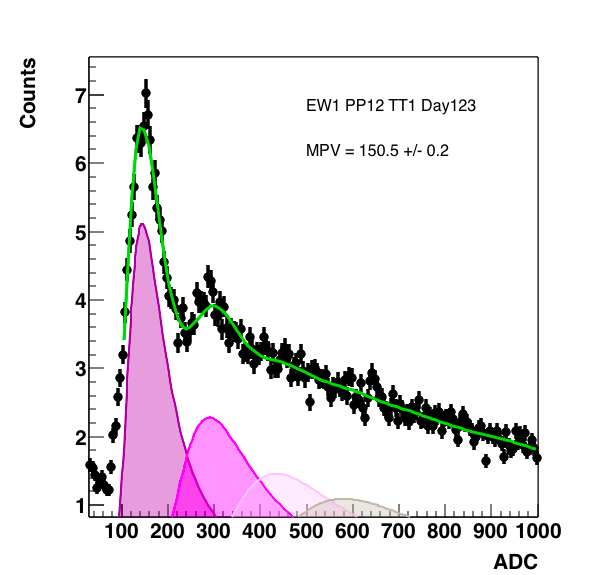

Figure 2: Right is Au 27 GeV, Middle is Isobar, and the right is a comparison. All fits were done with 6 mip peaks, as this was the minimum needed to fit the entire range.

Figure 3. ADC for West PP12 TT5 comparing the 27 GeV (blue) to the Isobar (red) where the Isobar data comes from days 120 - 125 and the 27 GeV comes from days 130 - 131. Done by Mike.
From Figures 2 and 3, we see first of all that what I see is very similar to what Mike saw, and that I am seeing roughly a 6 ADC count difference between the Au 27 GeV and the Isobars, looking at tile 1 where things are the most
- rjreed's blog
- Login or register to post comments