EPD Centrality in OO
Looking at the minimum bias OO data from 2021, using the quantiles of the distributions to select centrality, Jordan made the follow plots:
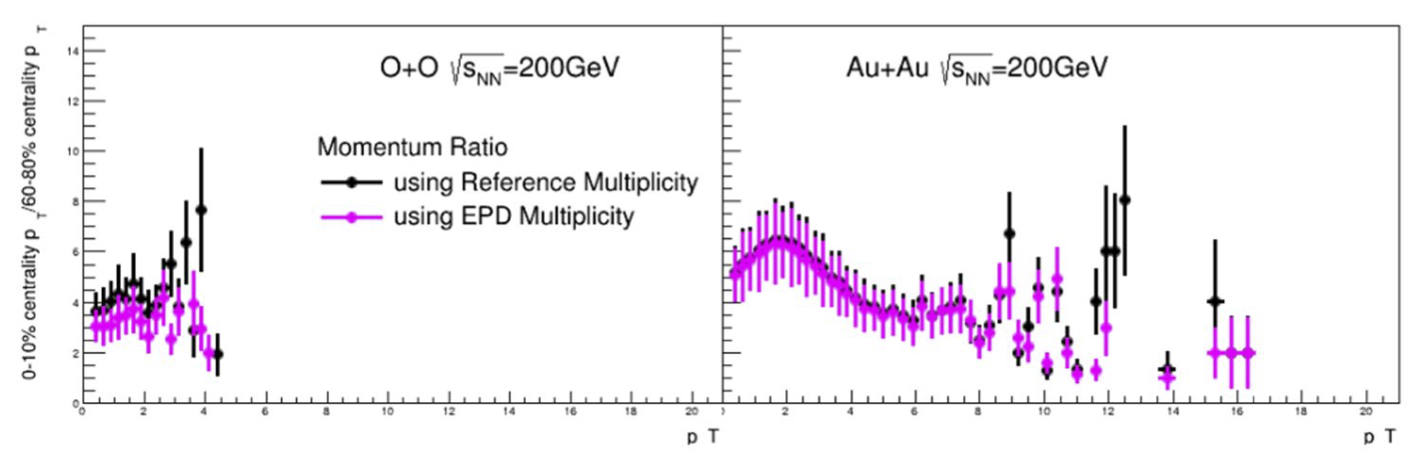
Figure 1: EPD max Nmip for both systems was 3, minimum was 0.2. In each case, the percentile was determined directly from the data (i.e. simply the quantiles of the distributions). Basic event quality and track quality cuts were used. Both data sets were using the fastoffline data. Ratio of pT spectra for EPD selected events in purple, TPC selected events in black. The plot on the left is O+O 2021, the plot on the right is Au+Au (2020).
In figure 1, we see that the ratio of the spectra is different depending on whether one uses the EPD or RefMult to determine the event centrality in O+O, but the difference is negligible in top energy Au+Au. A quick check of the 19.6 GeV Au+Au (Fastoffline) also showed similar results as the O+O. This let us draw the conclusion that this was some "small systems" effect, where we are defining a small system as one that produces relatively few particles.
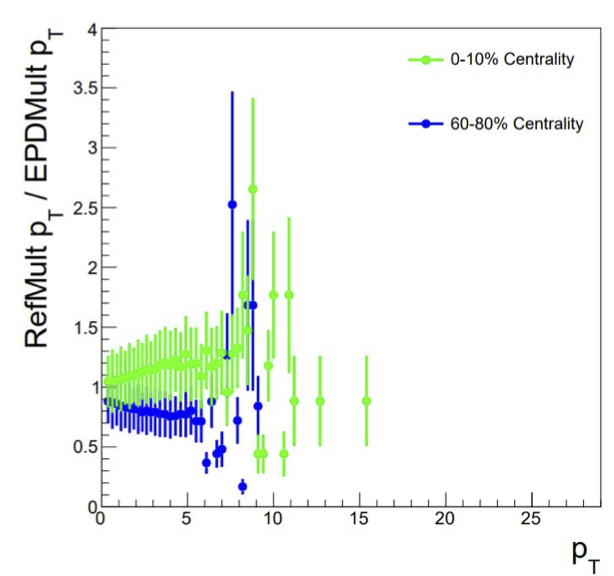
Figure 2: This is the same data as above, but now the distributions are plotted with the "0 - 10%" data in green and the "60-80%" data in blue. For both, the distribution of pT for refMult selected events is the numerator, for EPD selected events is the denominator.
We see from Figure 2 that there are more high pT particles in the "0 - 10%" selected events when refMult is used as the centrality indicator, but more high pT particles in the "60-80%" selected events when the EPD is used as the centrality indicator. This is what results in the separation seen in Figure 1. We also see a momentum dependence, especially in the central events. From here we can make several assumptions.
RefMult is probably better correlated with the impact parameter - it is choosing events that actually more central in the 0 - 10% bin, and less central in the 60 - 70% bin based on the yield since this should be dominated by the number of binary collisions. If these distributions were flat in pT, we would be done and would advise people to use refMult. However, the increasing trend in pT indicates that we are seeing autocorrelations between the presence (or absence) of jets in the event and the event centrality. This was noted by ALICE in pA (see figure 4 of arxiv.org/pdf/1403.5143.pdf).
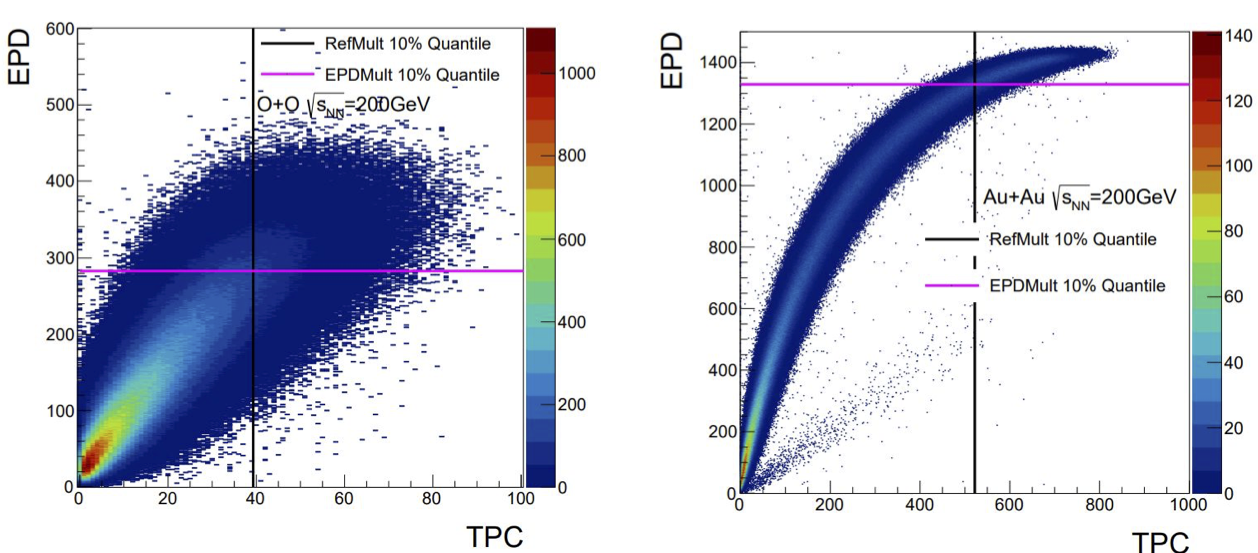
Figure 3: EPD multiplicity (Nmip max = 3) vs refMult. The top 10% are indicated by the black line for refMult and the purple line for EpdMult.
In figure 3, Jordan has shown us the 2D correlation, which we see is quite a bit tighter for the 200 GeV data. This is on fastoffline with some event quality cuts - we can see some pile-up in the Au+Au figure on the right, which we won't worry about for this study. The EPD multiplicity is summed tile by tile with:
Nmip < 0.2 -> Nmip = 0
Nmip > 3.0 -> Nmip = 3.
This results in some of the saturation we are seeing in the Au+Au data. Jordan then projected the distributions for the following graph:
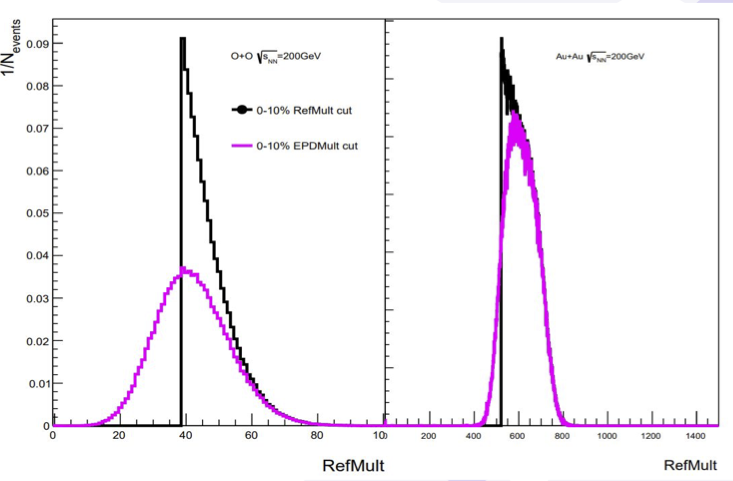
Figure 4: 1D projections onto the RefMult axis. The sharp cut off in the black is due to the fact that this is simply the top 10% quantile of that distribution. The purple is the distribution if one used the 10% of the EPD mult data and then looked at the RefMult. We see the resolution is simply a lot better for Au+Au 200 GeV.
We have other forward detectors we can use. The ZDC does not have much of a correlation with RefMult, but the other detectors do:
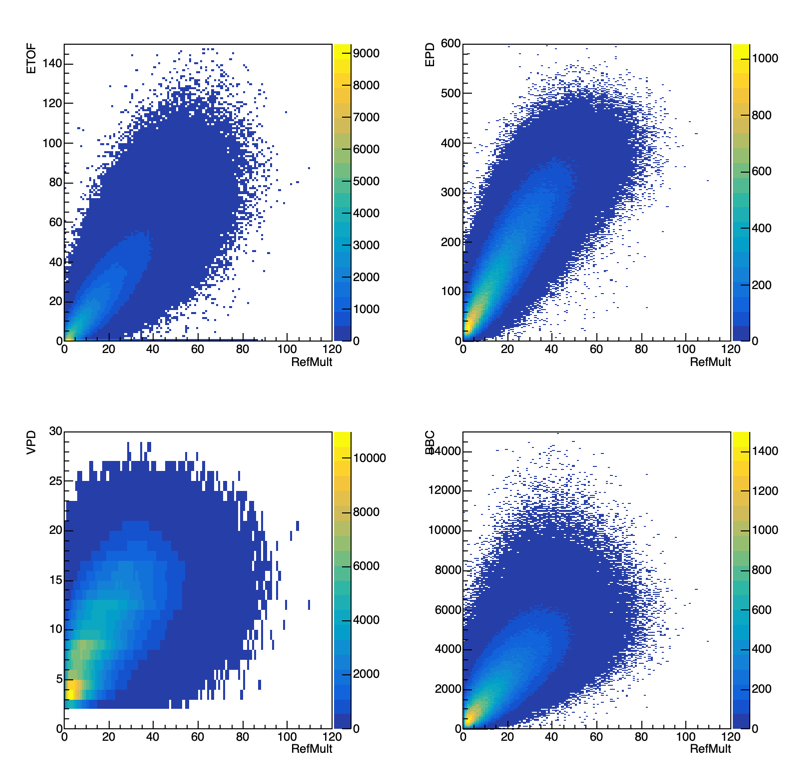
Figure 5: All forward detectors vs RefMult in minimum bias OO data (fastoffline). The top left is ETOF, top right is EPD, bottom left is VPD, bottom right is BBC. The BBC is determined via the Sum ADC.
Following the methodology developed by Mike Lisa (first seen in drupal.star.bnl.gov/STAR/blog/lisa/ring-weights-estimating-global-quantities-linear-sums and then ultimately followed up in: arxiv.org/abs/2009.01483) first I simply tried to introduce a linear weight for each detector.
This gives me the following weights: bbcSumAdc*-0.001118 + vpdHits*-0.045716 + etof*0.195535 + EpdMult*0.107418
If I use a bias term, I get: bbcSumAdc*-0.002011 + vpdHits*0.853462 + etof*0.266755 + EpdMult*0.063969+-0.795746
Looking at the top 10% I find:
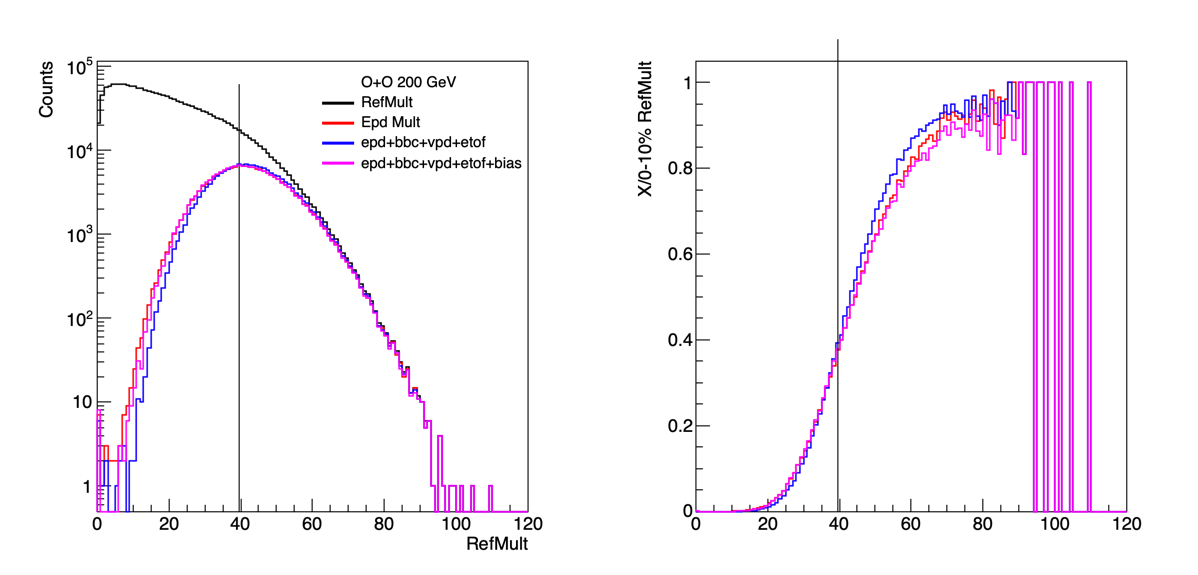
Figure 6: RefMult distribution in black, with the vertical line showing 0 - 10% based on RefMult. In red is just the EPD Multiplicity as already done by Jordan. Then blue is the linear weight of the four forward detectors. Purple is the same, but also using a bias term. It seems that the best result comes from the simple weighting of the 4 detectors.
Since this is the top energy there isn't that much contamination from spectators, so the ring-by-ring weighting would be less important. However, we can give that a try.
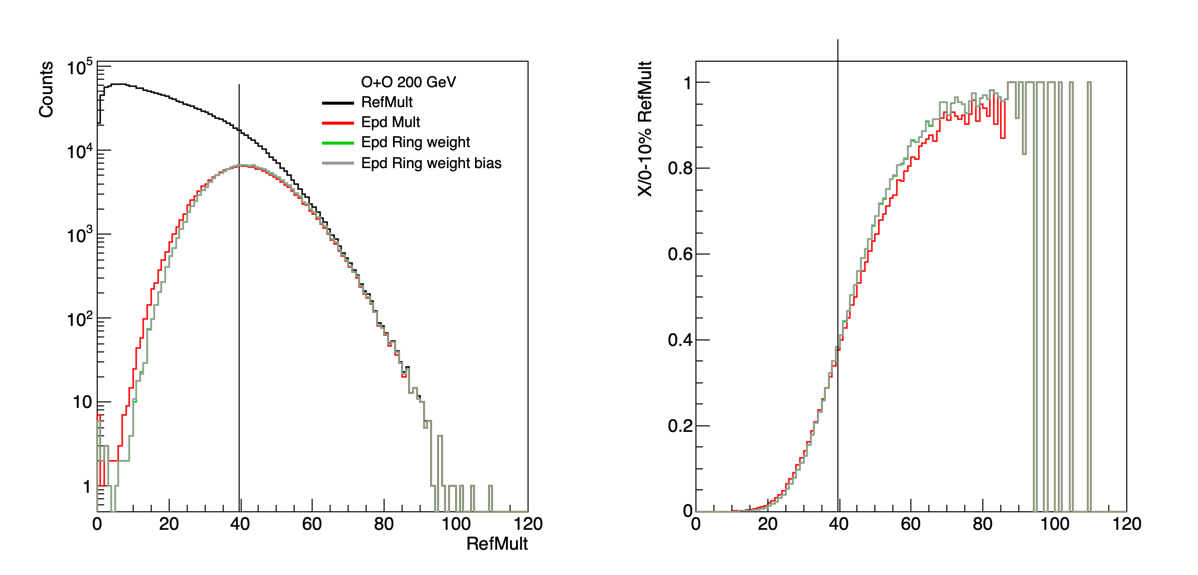
Figure 7: RefMult distribution in black, with the vertical line showing 0 - 10% based on RefMult. In red is just the EPD Multiplicity as already done by Jordan. Green is just the EPD with weights for the rings, grey is the same, but with a bias term.
Weights by ring with no bias = {-0.0170652 , 0.00461631 , 0.0366636 , 0.0724058 , 0.10956 , 0.138076 , 0.156424 , 0.169268 , 0.181678 , 0.189226 , 0.198998 , 0.198118 , 0.212622 , 0.21651 , 0.207819 , 0.213299};
Weights by Ring with Bias = {-0.0259651 , 0.00423662 , 0.0366735 , 0.0719321 , 0.108665 , 0.137074 , 0.155301 , 0.168188 , 0.180558 , 0.188164 , 0.198027 , 0.197304 , 0.211703 , 0.215598 , 0.207029 , 0.212491 , 0.356389};
From figure 7, we see that there is a little improvement using just the EPD with weighting the rings. It seems to be the same whether we include a bias term or not, so probably easiest to not include it. There is an improvement, but seems to be on the level of including the other forward detectors. So next would be doing both methods.
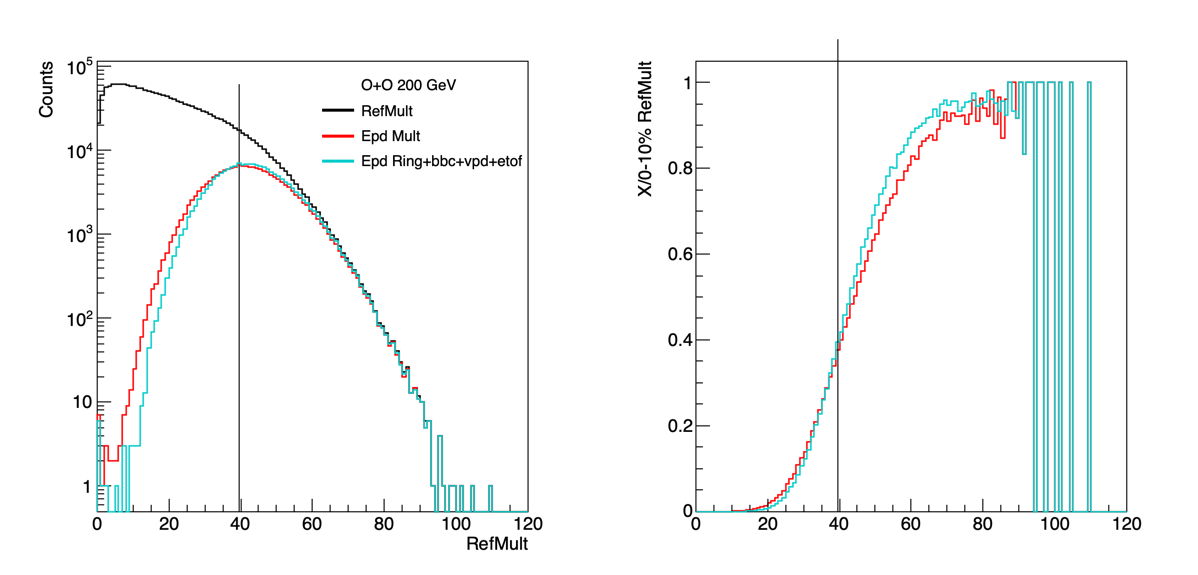
Figure 9: Same as Figure 7+6, but now using a linearly weighted standard with each epd ring weighted separately, along with the bbc, vpd, etof.
Form Figure 9 we see that we gain a bit of refMult resolution when we use all of the forward detectors together. Let's try to look at this in some more detail ... thought the gain here compared to the EPD alone is small enough that I'm not certain how much we can recover. For completeness sake, the weights for this scenario is:
r01*-0.029738 + r02*-0.000229 + r03*0.028159 + r04*0.055022 + r05*0.085260 + r06*0.106585 + r07*0.120874 + r08*0.129812 + r09*0.138909 + r10*0.144257 + r11*0.151928 + r12*0.150638 + r13*0.161816 + r14*0.163222 + r15*0.155401 + r16*0.158570 + bbcSumAdc*0.000037 + vpdHits*0.053736 + etof*0.165309
I will be calling this weighted determination "forward centrality" from this point on.
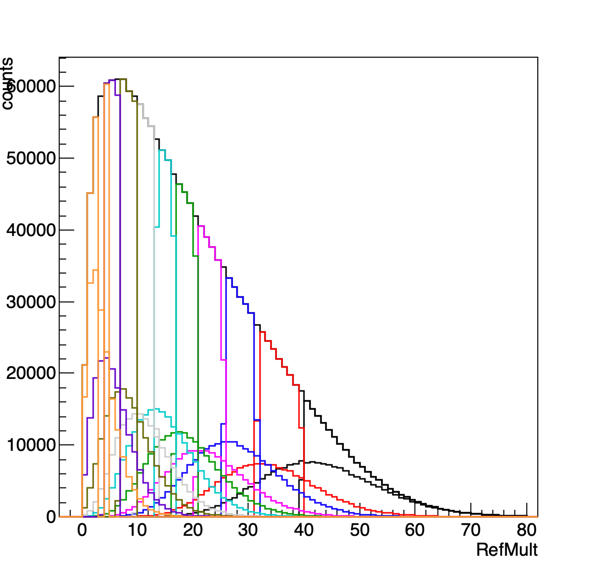
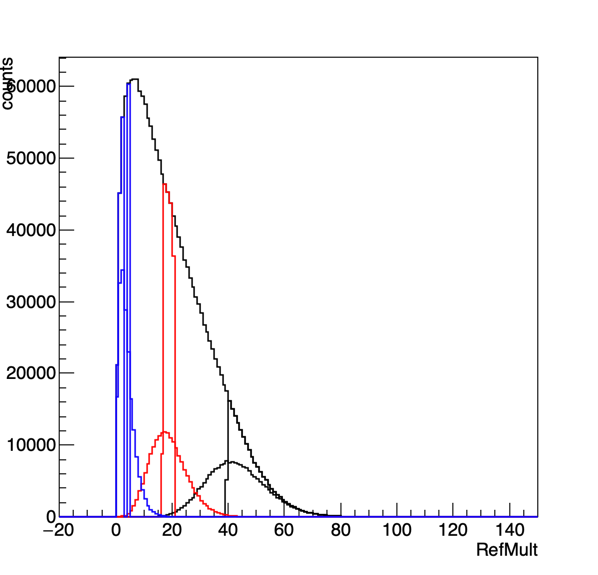
Figure 10: These are 10% central bins. For one set (pure refMult) these are directly calculated. The distributions aren't completely sharp since I determined the percentage of counts in each bin that would need to be assigned to a given centrality class, to keep the distributions at exactly 10%. For the other set of curves, the forward centrality determination was used, and we can see that it does not do a tremendously great job. On the right I reduced the number of bins to 3 to span the region.
Figure 10 is a bit different than our paper situation - the means of the refmult curves determined from the forward centrality are not directly underneath the direct refmult calculations. We could do the same exercise of looking at the comparison of the widths - but this won't give us the whole story.
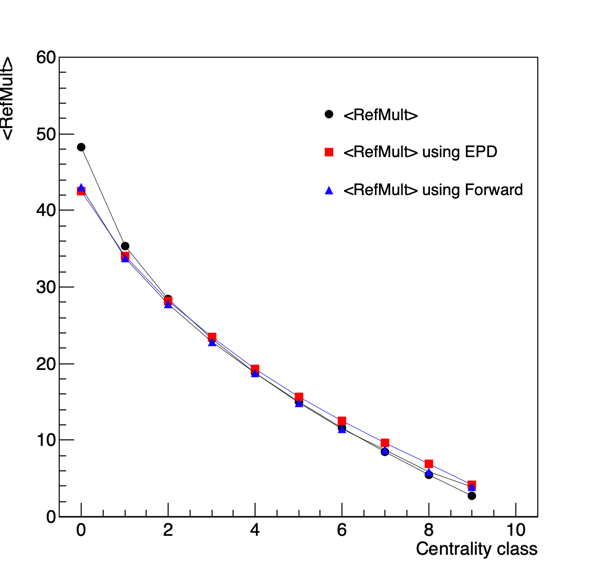
Figure 11: The average RefMult for a given centrality class as determined directly from RefMult, for from using the EPD or the forward centrality determination.
In Figure 11 we see that we gain very little with the forward centrality definition. It does marginally better across the range, but they both fail tremendously when going to the most central events. We can see part of the reason seems to be that the average refMult starts to rapidly increase, which I don't think is reflected in the forward definitions. In fact, while things look ok in Figure 5 - for all of these detectors the profile starts to leave the linear distribution right when we hit the 10% for RefMult. At first I was worried that I was seeing some sort of saturation effect in the EPD (in which case, all bets are off). But it's in all of the forward detectors, and given the very different technologies this indicates there is something more at play here.
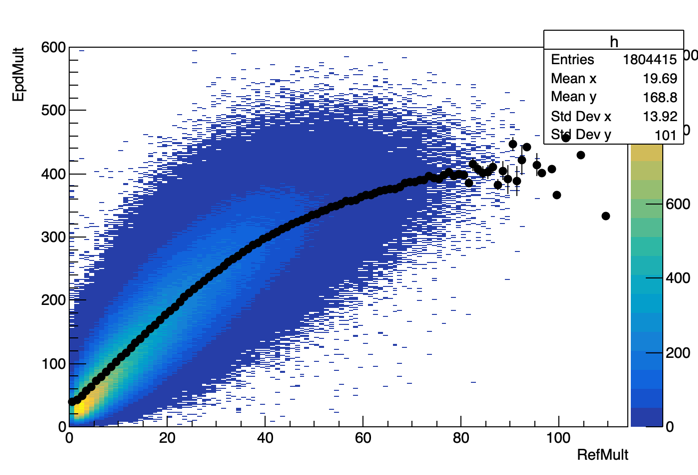
Figure 12: The distributions of RefMult and EPD mult compared to a TProfile.
From Figure 12 we can see that the distribution is not linear - so this is one reason the linear weighting regime would fail. So I think we need to think a little more about this.
Jordan's Jetcorr slides:
July 29th, 2021- drupal.star.bnl.gov/STAR/system/files/Cory%207_28%20EPDResolution%20%281%29.pdf
- rjreed's blog
- Login or register to post comments