Results of 2021 EPD install
Following along the directions at: drupal.star.bnl.gov/STAR/blog/rjreed/epd-install-calibration-and-commissioning-run-21
Physical Installation
The physical EPD install started Thursday January 28th and finished the morning of January 29th. The installation team consisted of Prashanth, Bill Struble, Robert Pak, Mike Lisa and Rahul. We did the west side first as they needed to install the magnet grounding strap, The east side was nearly completed the first day, but then CAD needed to do some tests with the machine so we came back in the morning. After install, we checked the dark current in both sides compared to the dark current from 2020.


Figure 1: Dark current comparison run 2020 vs run 2021
The dark current seems to be similar if not lower this year. Perhaps we did a better job of the light tighting.
We took the CAMAC off run for the vped settings, though I didn't get to the actual runs until after physics has been declared.
Pedestal Issue
For many of the channels, the pedestal subtraction did not seem to be working. After retaking the pedestals a few times, it was observed that each channel seemed to continue to be wrong by the same amount. An example plot is shown in Figure 2.
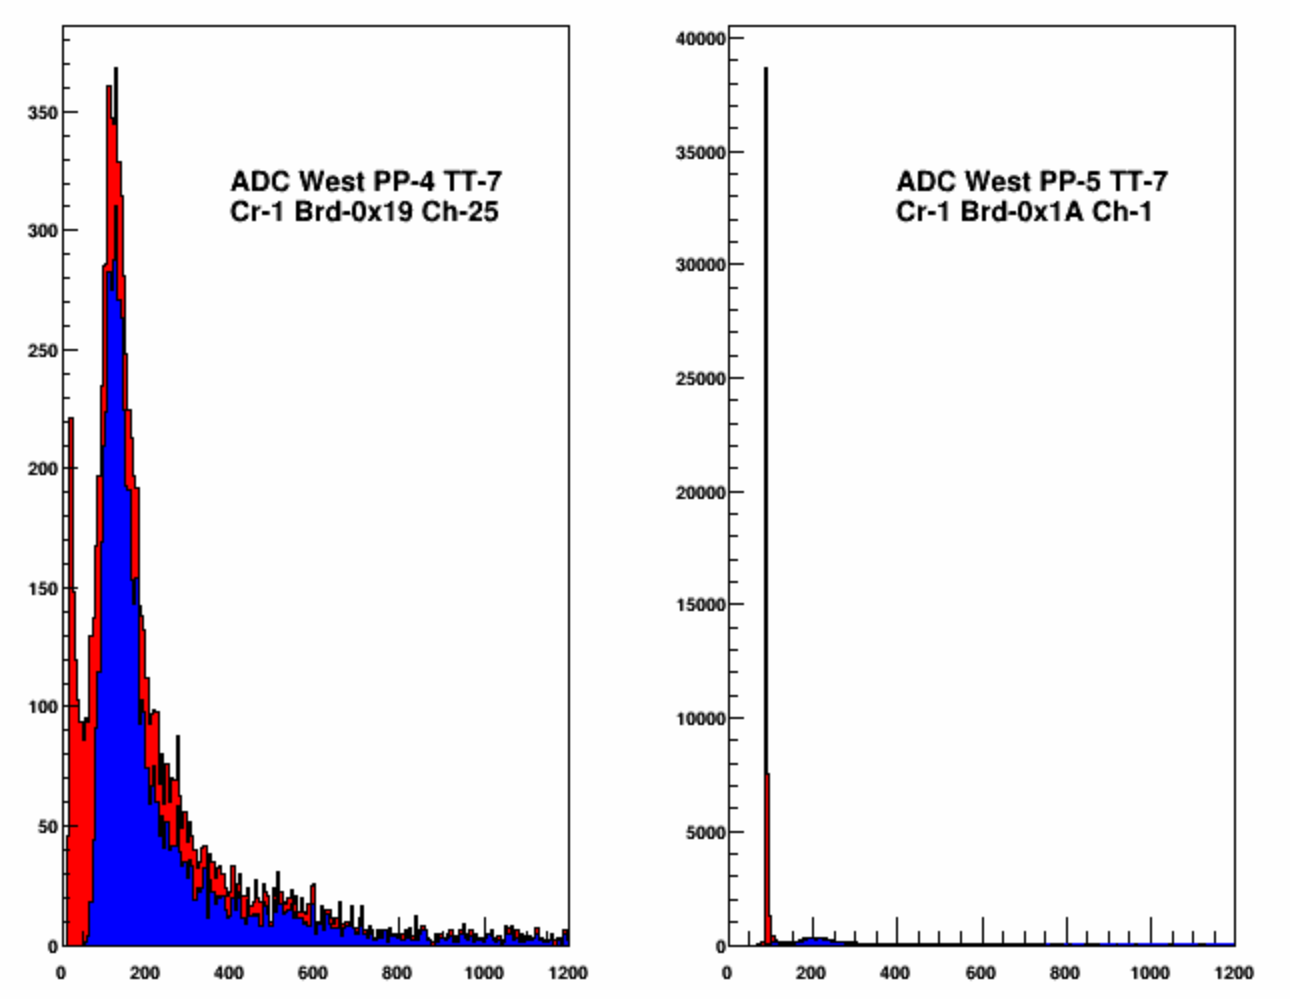
Figure 2: Online plots of the pedestal issue. Tile chosen as one of the most extreme so easiest to view the issue.
The trigger group looked into it, and found that there was a problem transferring the binary means files to startrg because of an SSH key change that happened during the upgrades. This means that the LUT were not being created each time, instead the last pedestal run from September was being used. Oddly enough this was true for all QT boards, so I am a little confused why we are the only ones to have noticed.
This means that the first set of vped scans outlined below to preserve the information were probably not useful and needed to be taken again.
Run 220320*
run 33 - zeros (with the new zero file starting with vped -50)
run 34 - vped -20
run 35 - vped -10
run 36 - vped 0
run 37 - vped 10
run 38 - vped 20
run 39 - vped -80 (bias voltages?)
run 40 - vped 80 (bias voltages? might have been nominal file)
run 41 - set default
Empty Tile in West PP5 TT23
During Run 20, this tile was consistently empty (corresponds to EQ1 board 6 channel 7). Prashanth found that the connector into the QT board had gotten loose for that channel, so he pushed it in and it worked. Note: we spent time looking at the output from the diffRx cards and determined that we were seeing cosmics from this channel so we knew that it was ok. However, that was a pain as the connectors at the diffRx end are very hard to remove. Probably if we see something like this again, we should first check the connectors on the QT side as that is quite a bit easier.
Vped Scan
The EPD vped scans were repeated now that the issue with pedestal subtraction was solved. These runs are:
220340*
17 ped rhic clock clean to "zero" the EPD
18, vped = -80
19, vped = -20
20, vped = -10
21, vped = 0
22, vped = 10
23, vped = 20
24, vped = 80
25 pedestal rhicclock clean to set epd back to normal (2020 values)
The CAMAC off run is 22034033.
Bias Scan #1
Bias scan files:
Run 22033*
32 - Vbias 60V
33 - Vbias 61V
34 - Vbias 61V
36 - Vbias 61V
37 - Vbias 62V
38 - Vbias 62V
39 - Vbias 63V
40 - Vbias 59V
41 - Vbias 58V
42 - Vbias 57V
One thing to note here is that 57V is not low enough, the first run should be done at a value of 55V. Another issue that had cropped up was that the version of Mike's bias scan code linked to in the instructions was not the most up to date. At some point I had added QT32C or QT32B to the histogram names in the reader, and this change was not carried through. I know that he had updated his code on his laptop, but I modified it myself to account for this. I may then be setting the bias voltages to the higher values we were using in 2019 rather than our lower choice for 2020. Another change that had to be made was including a bias voltage value for "tile 0", the empty spot on the even side. Since the output file is read in by the macro that creates the mapping, which expects these values, it was easier to add it in.
The giant PDF created by Mike's code can be found at: drupal.star.bnl.gov/STAR/system/files/BiasScan2021_v1.pdf and it created the raw file of bias voltages at: drupal.star.bnl.gov/STAR/system/files/VbiasRaw_2021v1.txt
For file creation I modified by hand the text file output, which can be found at: drupal.star.bnl.gov/STAR/system/files/Vbias_2021v1.txt then using the creation macro, this gave me the file: drupal.star.bnl.gov/STAR/system/files/EPD_TUFFmap_02142021.txt which is what we used until the access. To be clear, we started with the 2020 values. Then starting with run 22046001 we used the bias values found in this first scan.
The results of the bias setting compared to 2020 are shown below:
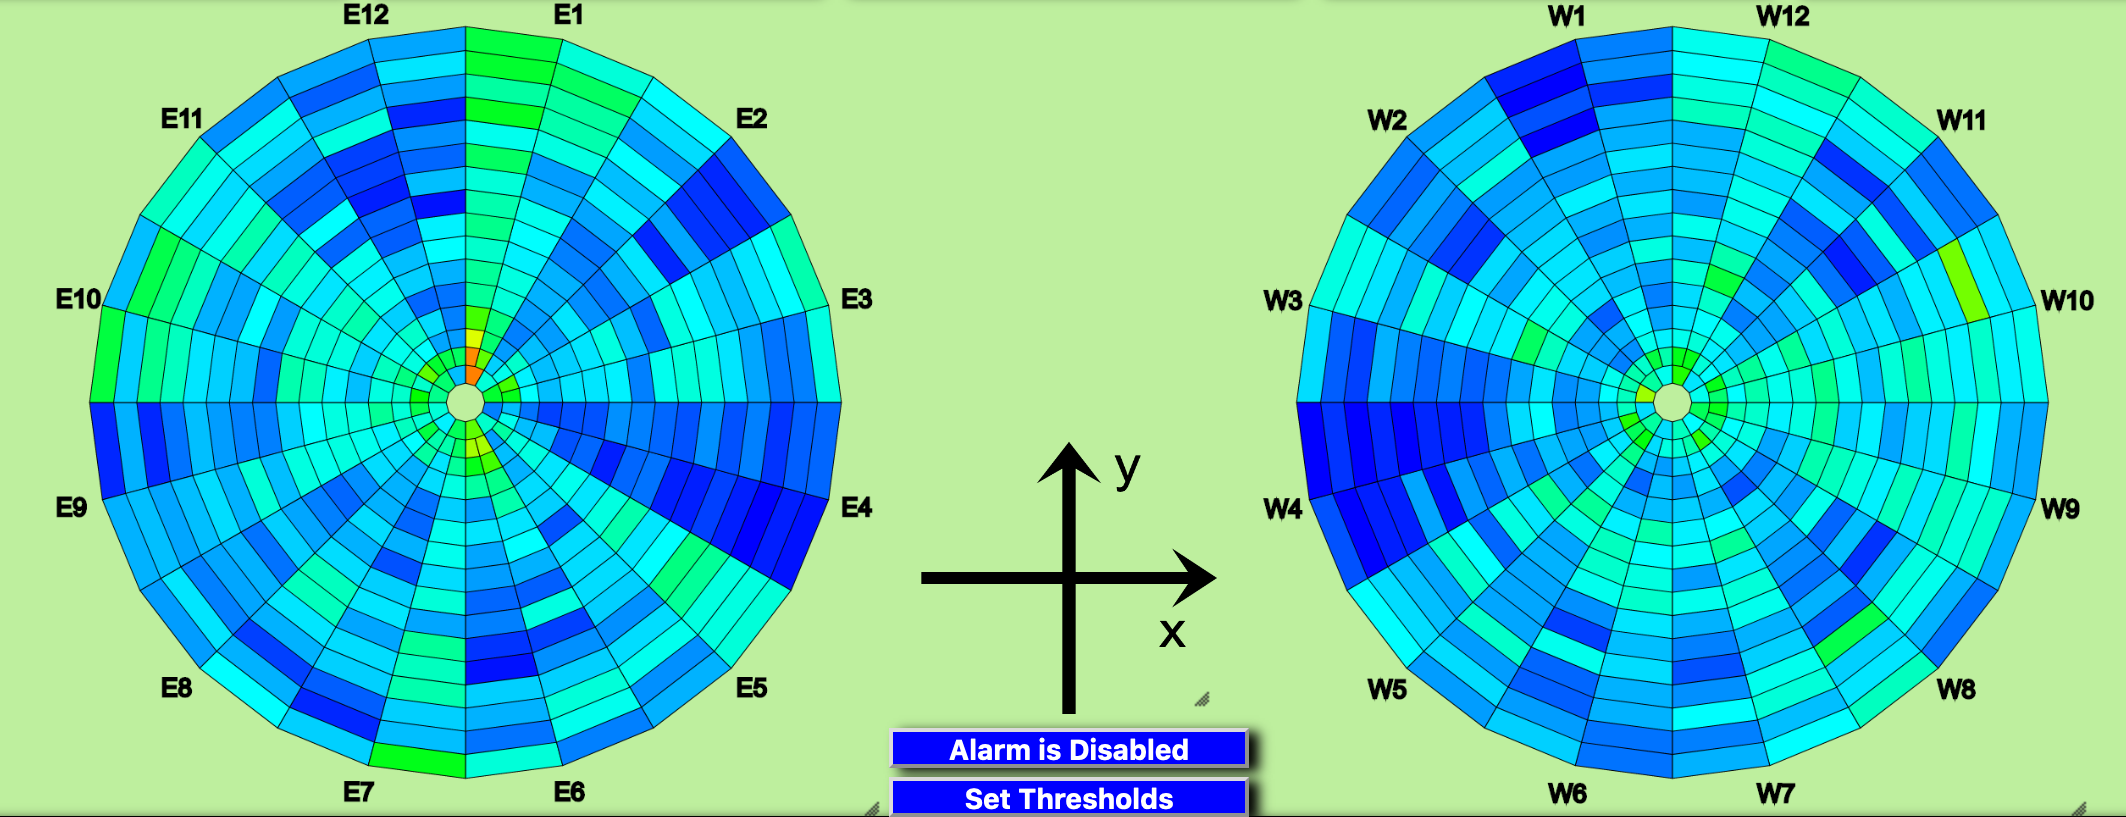
Figure 3: Bias settings for 2020 running. The z range is 55 - 63 V.
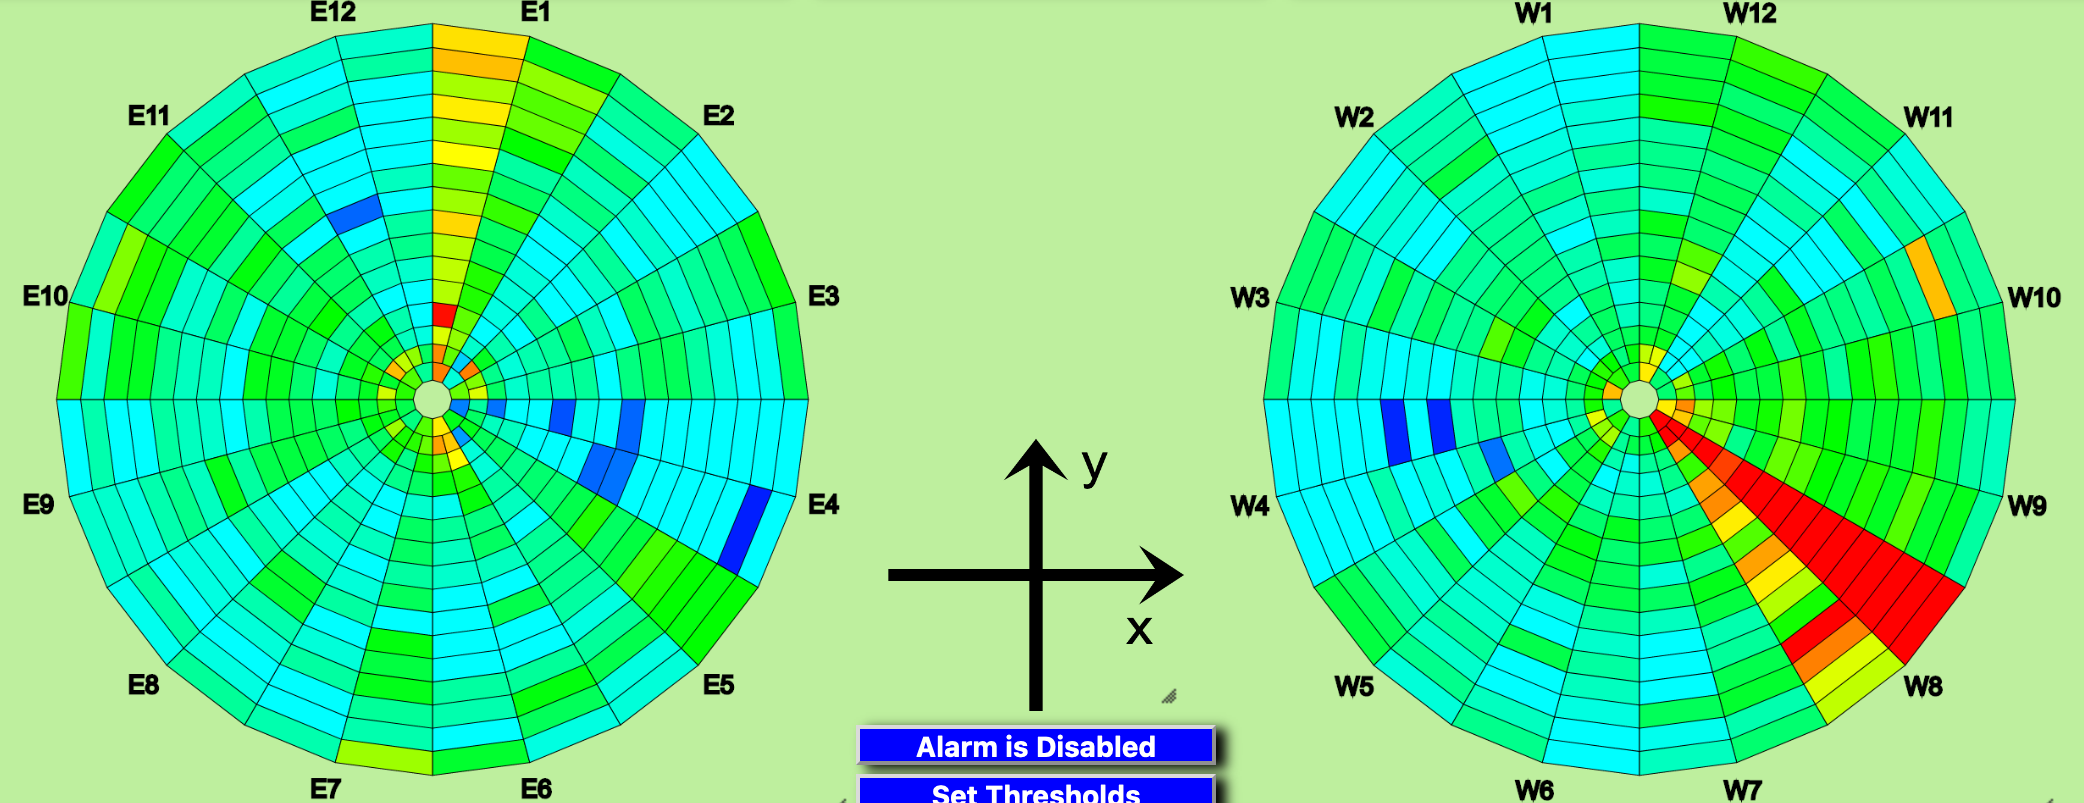
Figure 4: Bias settings for version 1 of the 2021 values. (Note: Since my lowest run was at 57V there are no channels below that so this looks warmer compared to 2020 than is fair.)
Prashanth reseated the connector during the access Wednesday Feb 17th, and the first run after the access was 22045040. The average ADC in west PP 8 looked high after this, so it seems to have done the trick. It should be noted that he found that a lot of the blackout tape was coming off. Perhaps we need better tape. Another things that was noted was that the SiPM edge connectors can be quite loose - Mike says that he has noted this in the past but it seems to work out just fine.
Bias Scan #2
Run 220490*
27 - Vbias 55
29 - Vbias 57
30 - Vbias 59
50001 - Vbias 61
The observant user will see I stopped at 61V (which using Mike's code makes this the ceiling of the possible value) - this was due to running out of time on my shift. So for any tile that wanted a value of > 61V, I used the values from the previous analysis. The giant pdf created by Mike's code is at: drupal.star.bnl.gov/STAR/system/files/BiasScan_2021v2.pdf it created the output file drupal.star.bnl.gov/STAR/system/files/VbiasRaw_2021v2.txt. I modified this by hand to create: drupal.star.bnl.gov/STAR/system/files/Vbias_2021v2.txt and then created the tuff map file which can be found at: drupal.star.bnl.gov/STAR/system/files/EPD_TUFFmap_02192021.txt
The representation of these settings is:
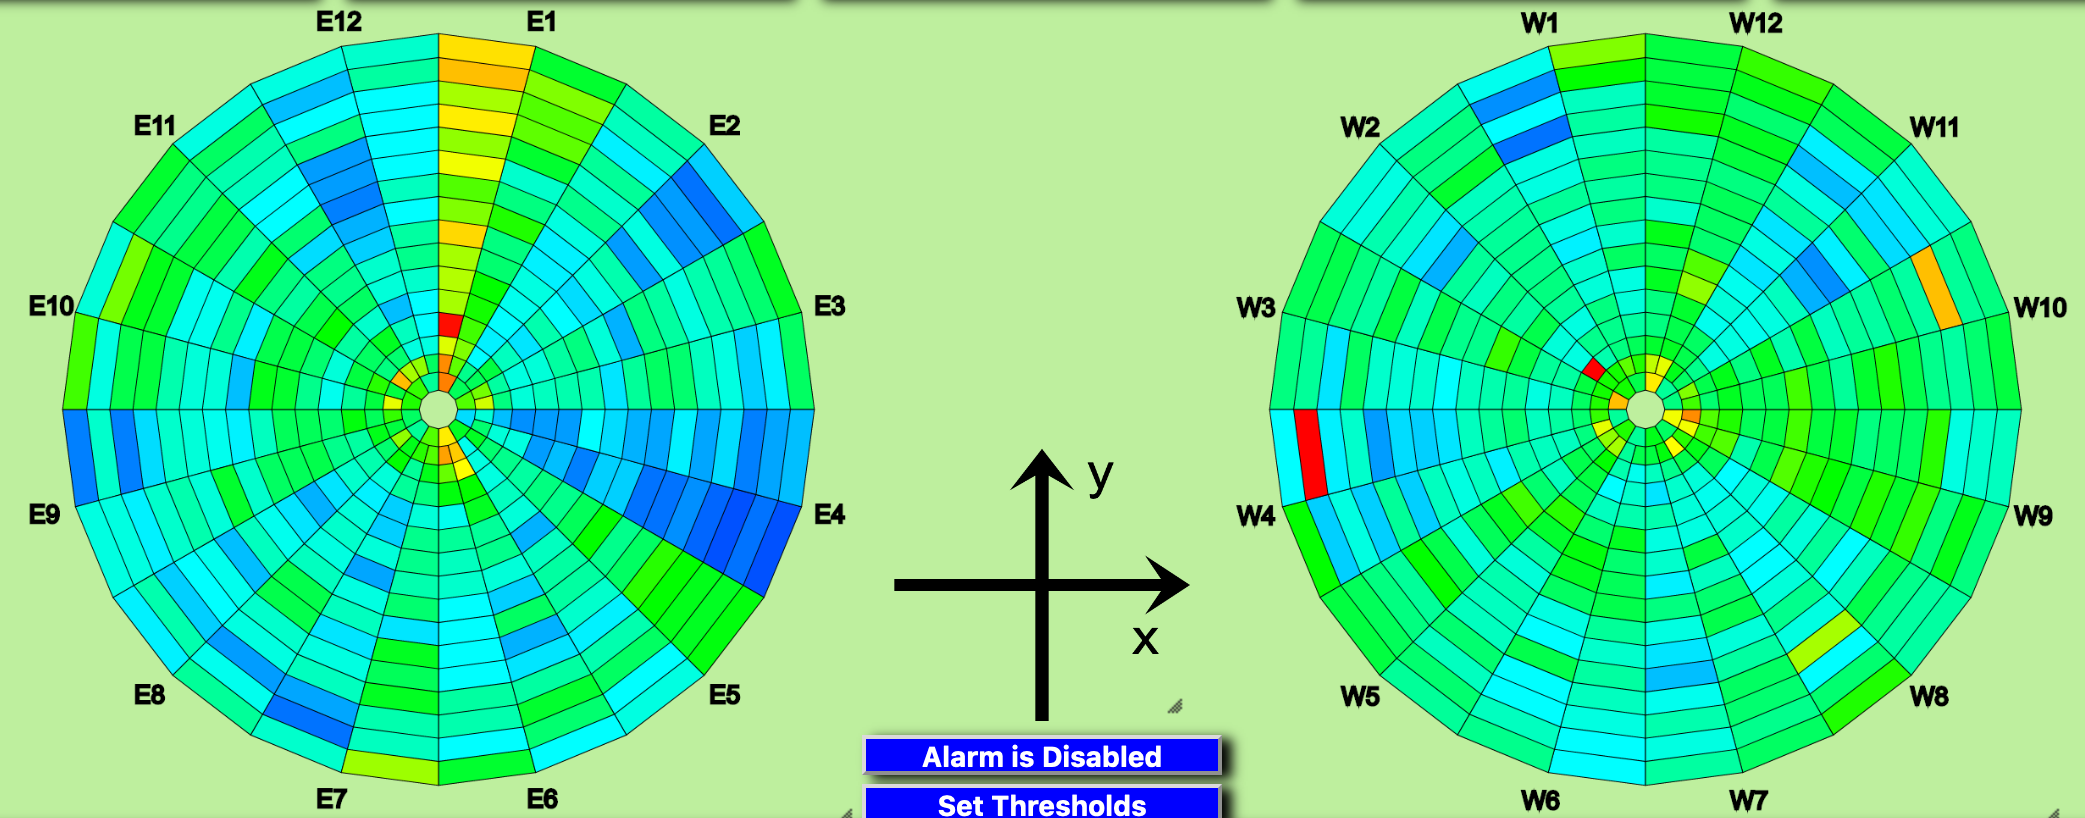
Figure 5: Bias settings for version 2 of the 2021 values. (As before the z range is 55 to 63 V).
The first run with this setting is 22050036. At this point we should be gain matched. One question that we have asked ourselves is whether the EPD is darkening. So I plotted the bias scan values for each channel year by year. The comparison can be found at: drupal.star.bnl.gov/STAR/system/files/BiasCompareEPD2019to2021_02222021.pdf What I notice is that while generally the 2018 values are "better" (i.e. a larger MPV for the same bias voltage), that isn't generically true. It also seems that 2019 tends to be the worst of the lot, other than PP8 from the first version of this year. It seems that the connection matters most of all - though this would be an interesting analysis to do.
Performance
The question is then, how well are we doing? For this I chose two runs and plotted the ADC distributions from the same tile on top of one another. The summary can be found at: drupal.star.bnl.gov/STAR/system/files/TileByTile_22051039.pdf and drupal.star.bnl.gov/STAR/system/files/TileByTile_22052031.pdf. The results seems to be similar between the two runs, so I will use 51039 since it has more statistics for the comparison below.
Issues Summary
East PP1 TT1 - 3 are low. It looks like the entire odd section of East PP1 is low with some weird signals. FEE perhaps?
East PP2 TT2 -> Bias should go to 60.3V
West PP1 TT5 -> Weird structure - Need discussion.
West PP1 TT31 -> Weird structure -> Reduce bias to 59V and see what happens.
West PP4 TT 25, 29, 30, 31 -> Seem to have no signal until all of a sudden it turns on! Change Bias for TT29 to 59V to get a signal. Further Analysis.
West PP1 TT31 -> reduce to 58V
Spikes in PP6 TT19, 20, 22, 24, 25, 27, 29(?) and PP12 TT19, 22, 24, 29(?) -> Seem to be a result of a higher bias setting. Try setting bias to 57V and see if the spikes go away? (Perhaps see how consistent these are first.) Good thing I asked this - seems the answer is not very - so I won't change the bias voltage.
Some slides on East PP1 are at: drupal.star.bnl.gov/STAR/system/files/EastPP1Questions.pdf
Issues Details
I notice right away that for the first 3 tiles of the east side there are a few issues.
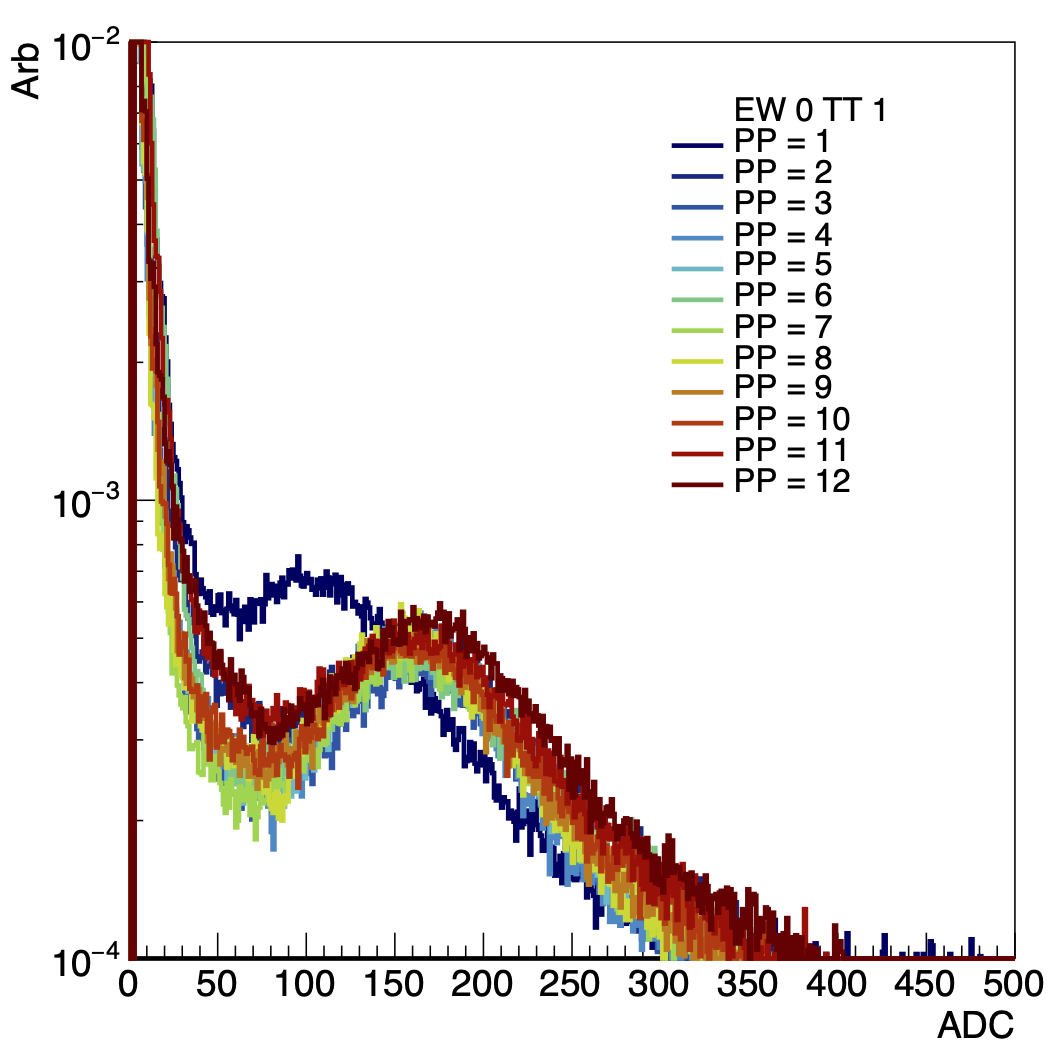
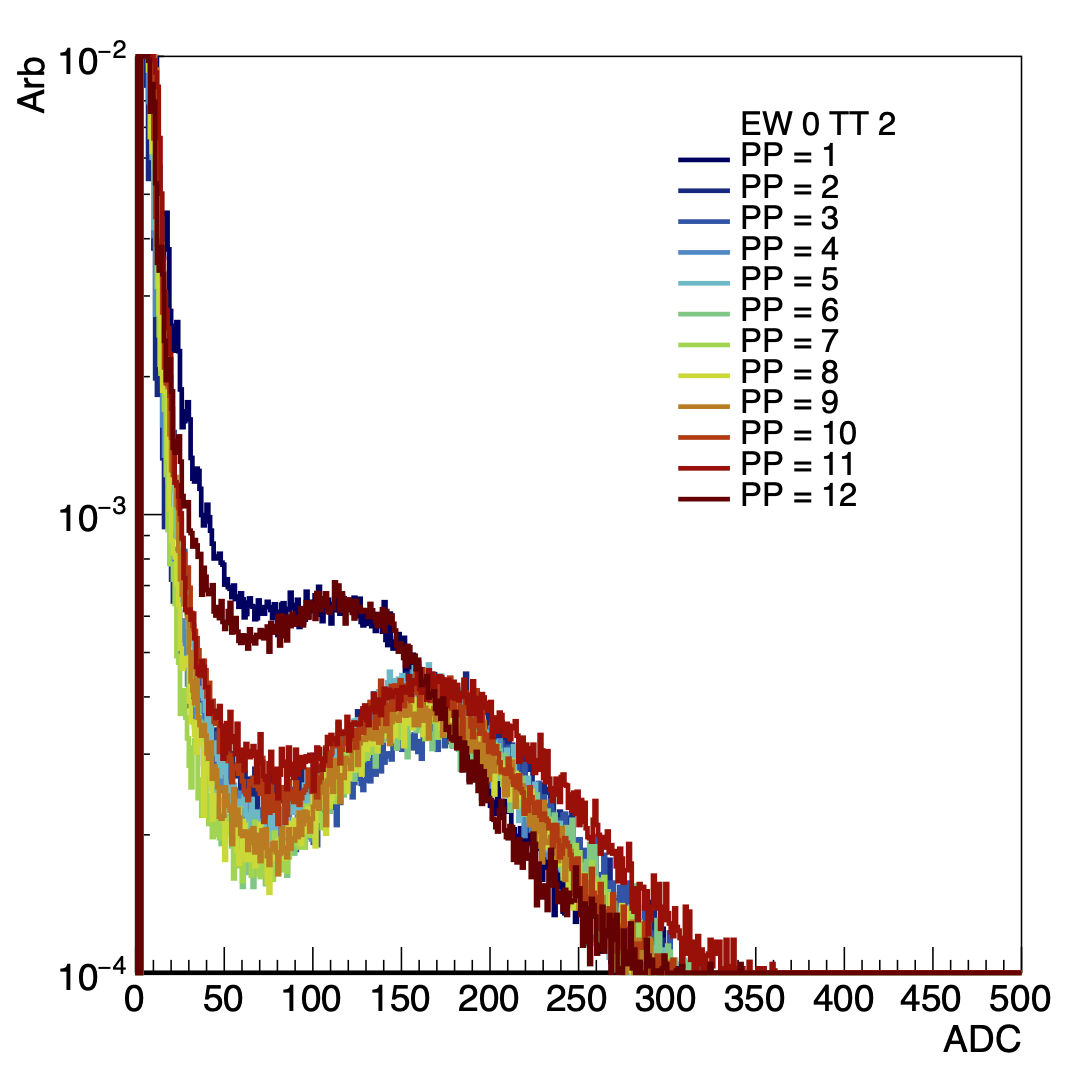
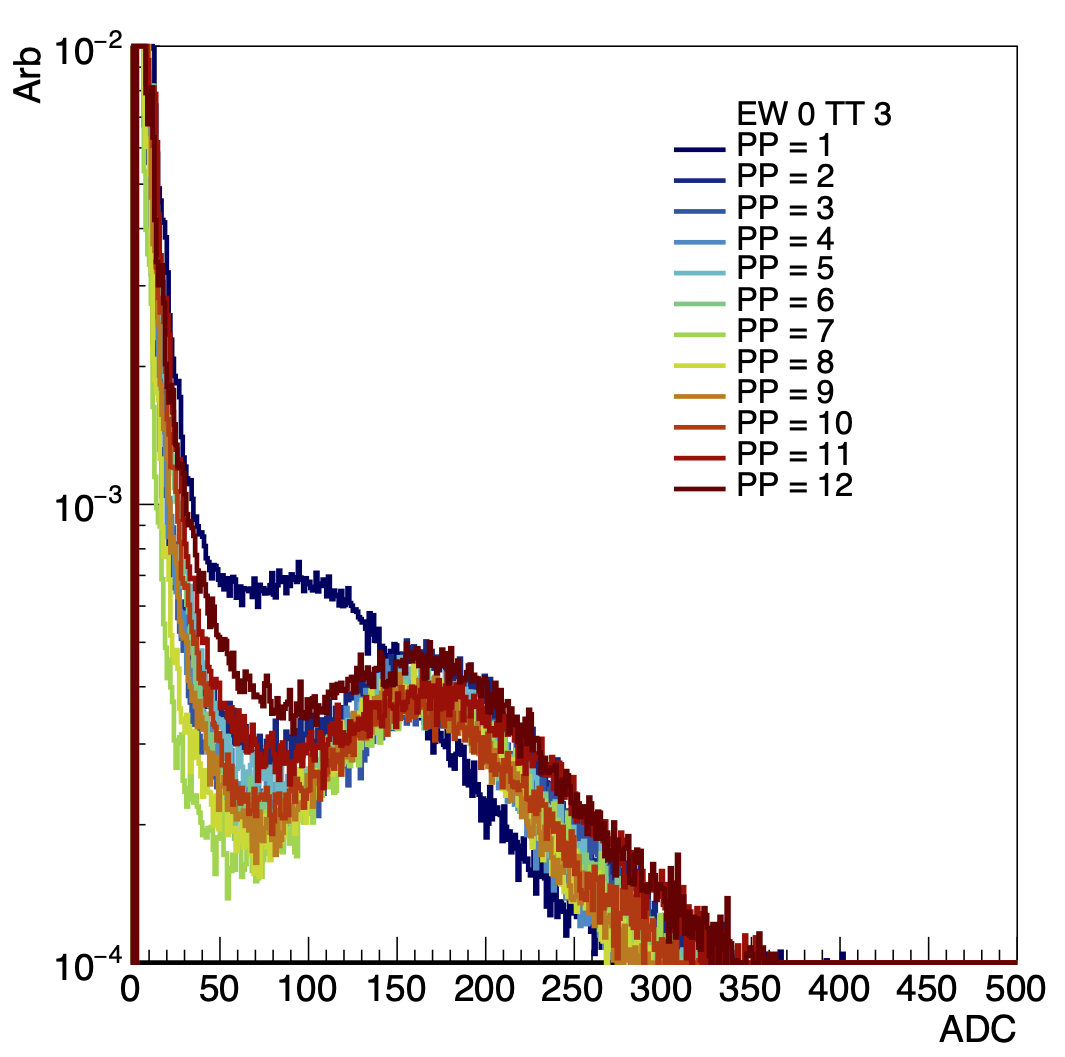
Figure 6: Run 22051039 East Tiles 1, 2 and 3 after gain matching.
EW0PP12TT->EQ3 BD4 CH24 the fit failed for the 61V run, it did seem to struggle a bit for the 3 inner tiles:
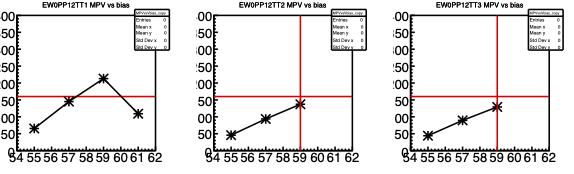
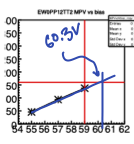
Figure 7: East PP12 TT 1-3 from bias scan check. TT3 fit didn't fail for the first bias scan of 2021 so I used that value instead (which is why it looked ok above). The 4th plot is my fix for the voltage setting for this channel.
I see that PP1 seemed to have trouble with all 3 files - so next I check the details. EW0PP1TT1 -> EQ3 BD6 CH0, EW0PP1TT2 -> EQ2 BD13 CH0, EW0PP1TT3 -> EQ2 BD13 CH1 and I set the bias voltages to 61, 59.7, 61,9 respectively.
The fits for these PP1 channels failed completely:
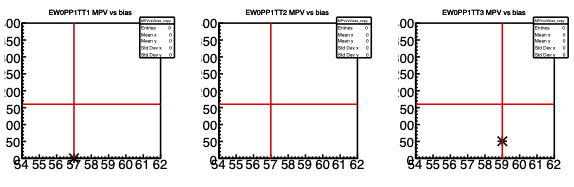
Figure 8: East PP1 TT 1 - 3 from the second bias scan.
Looking at the distribution, they failed due to a weak signal - all of these channels would like to be higher than what I have set them. Looking in general at the bias voltage settings - this seems to be true for East PP1 in a general sense. It is unclear what we should do since they probably would need ~63V or so which is high.
TT4 looked fine, but then TT5 gives us this gem:
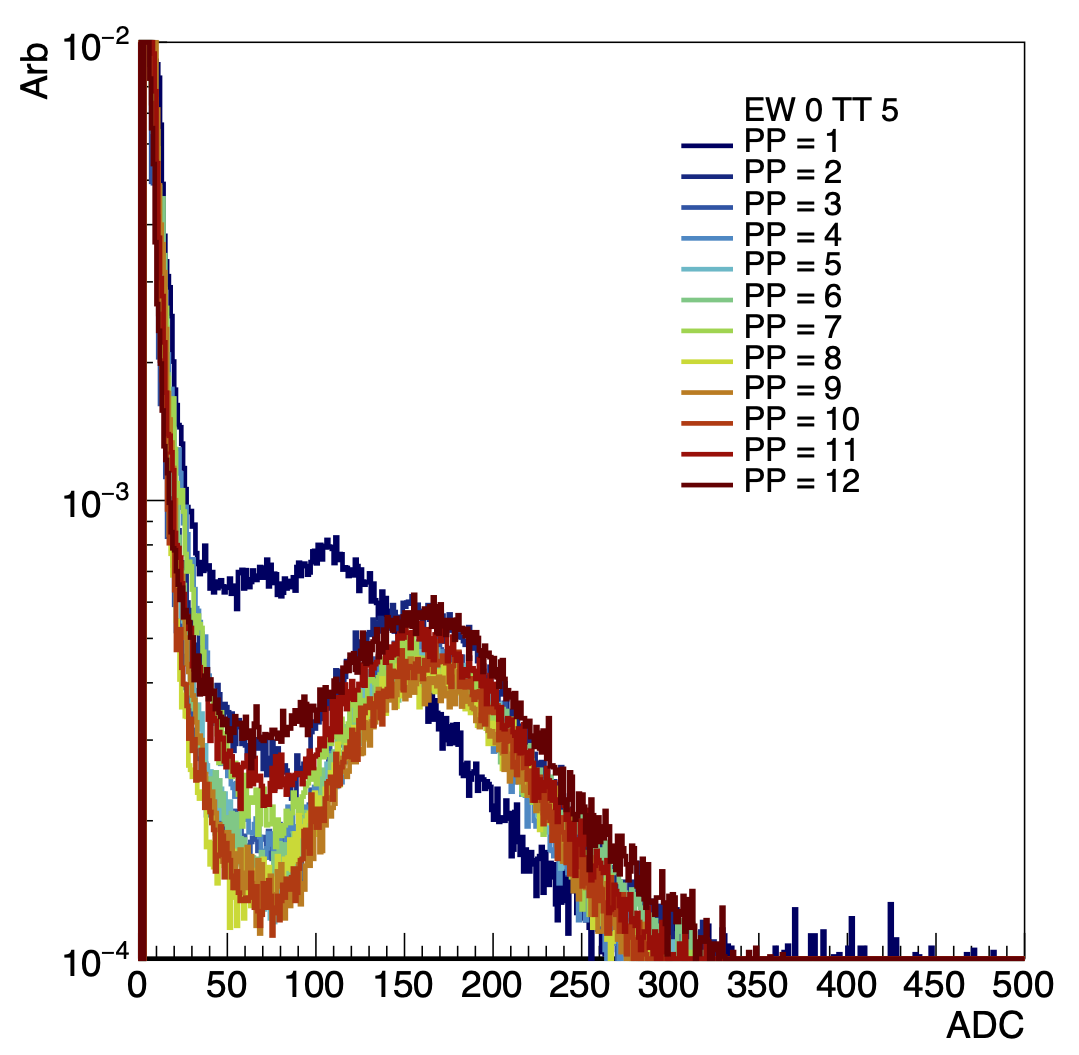
Figure 9: East TT5. We see here that the problem tile EW0PP1TT5 -> EQ2 BD13 CH 3. This channel also seemed to be simply weak and wanting to be set to a higher value. The weird shape in the ADC is also noticeable here. Strange....
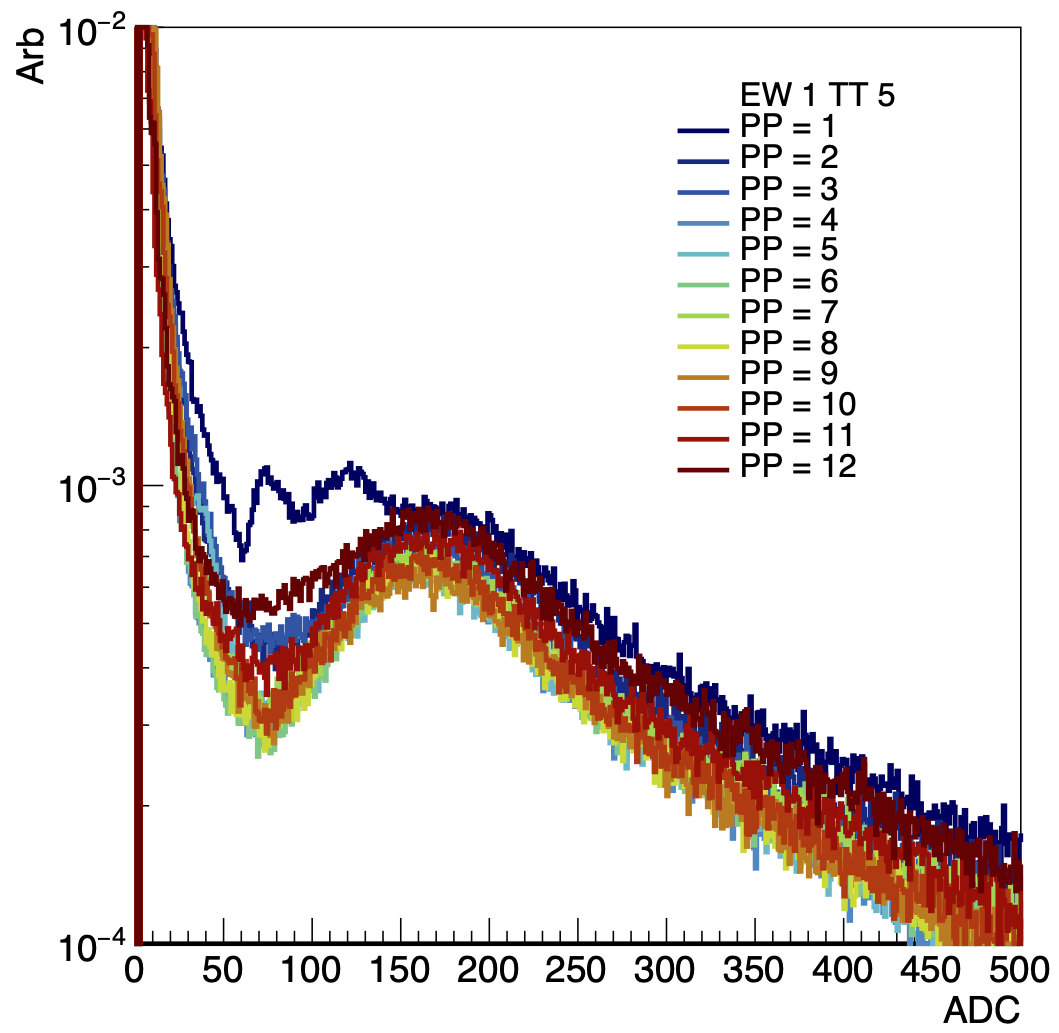
Figure 10: West TT5. It's obvious that something incredibly weird is going on with EW1 PP1 (EQ1 BD13 CH3).
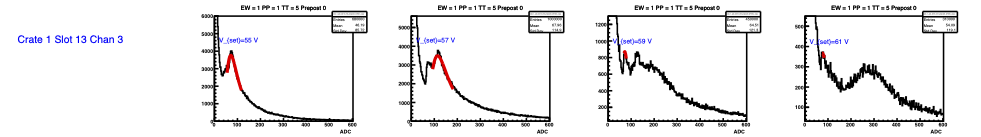
Figure 11: West PP1 TT5. It's obvious the structure was there during the bias scan.... It must be that channel. (I set Vset = 58.3 from v1 scan, which is probably a little low but not bad. But that structure....
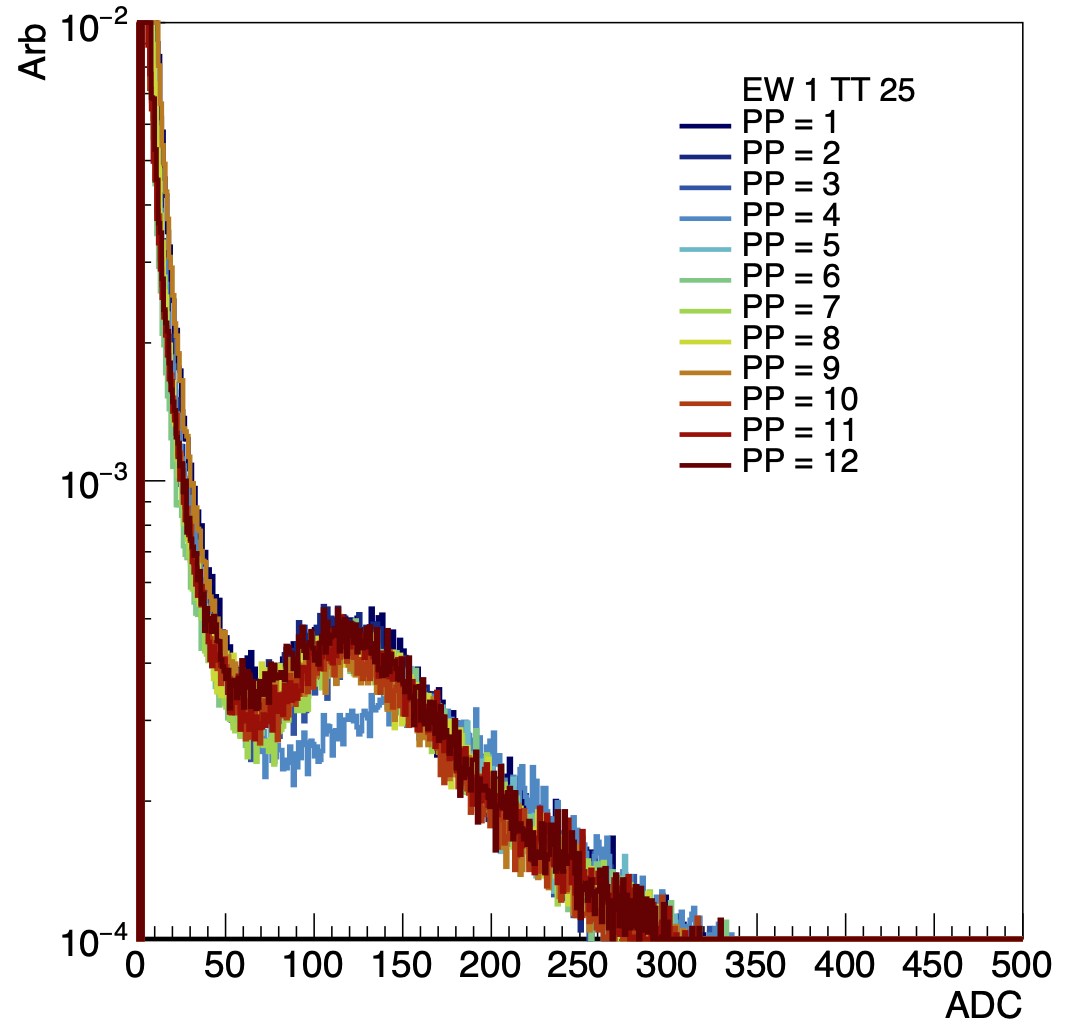
Figure 12: West TT25, looks like PP5 was set at a higher than needed voltage. (EW1PP5TT25 ->EQ1 BD1 CH1). A little strange - the fit failed for the 1st and 4th fits, but the required setting was between the 2nd and 3rd so I would have expected it to do a little better. It was set to 57.7586V. The slope for this tile is 42.5ADC/volt so to reduce the peak by about 30 ADC, we would want to reduce the voltage by about 0.7 or to 57.0586V.
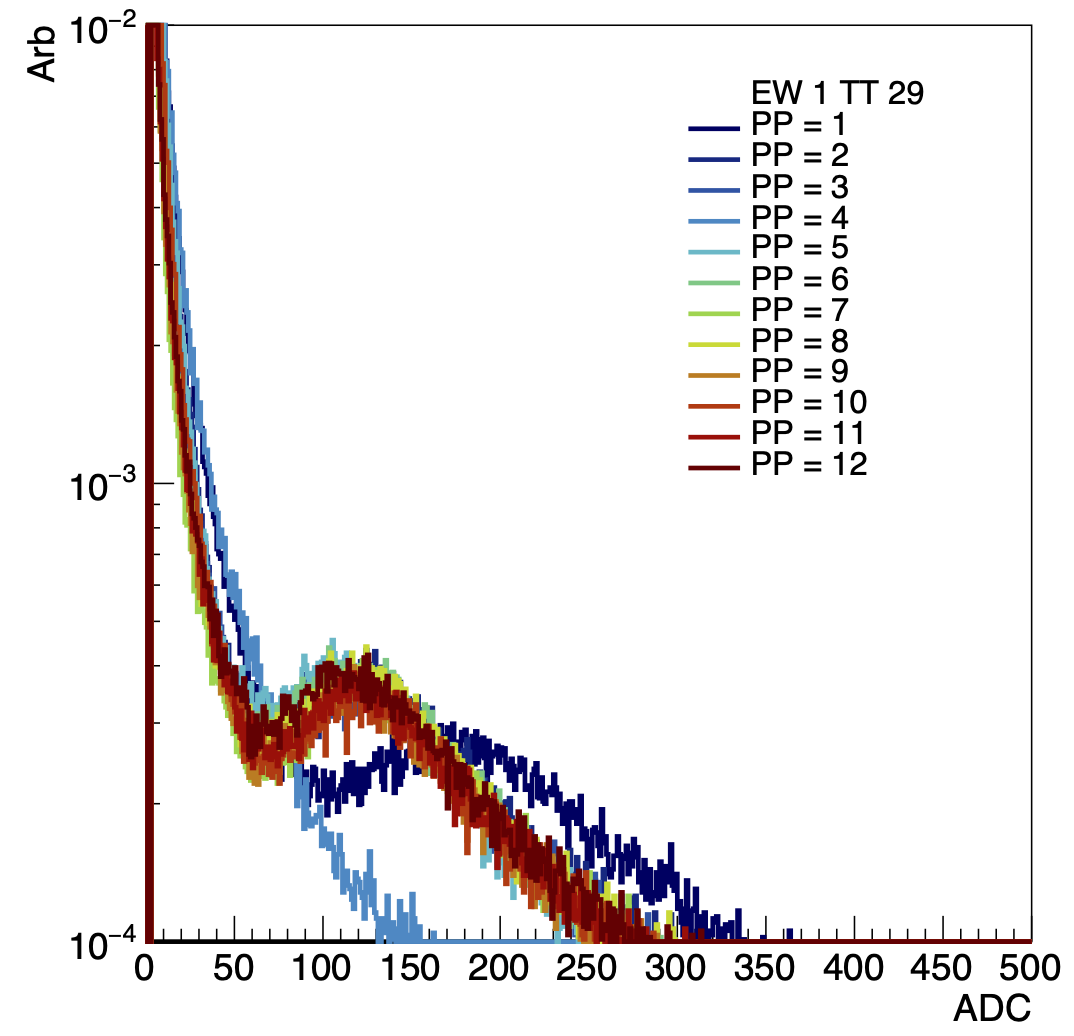
Figure 13: West TT29. We see here an issue with PP1 and PP4. (EW1PP1TT29-> EQ1 BD0 CH5, EW1PP4TT29 -> EQ1 BD0 CH29). For PP1 the fit simply failed for the first 2 scans, but things look ok. PP4 also failed - but in a way that is very strange. The signal wasn't there and then all of a sudden is with a turn on. The fit happened to fail for all of them so for some reason I set it to 63V which is way too high. (In fact, the peak for this is ~ADC 600 or so).
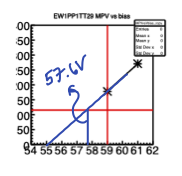
Figure 14: West PP1 TT29 - fit to the data, the voltage should be reduced from 49V to 57.6.
.png)
.png)
Figure 15: West TT30 and TT31. The same issue with PP4 was seen in this - the difference is that the fit actually found some of the signal. Probably we should just leave these channels for the time being. (EW1PP4TT30 -> EQ1 BD0 CH30, EW1PP4TT31 -> EQ1 BD0 CH31) Then the last of this type of weirdness, EW1PP1TT31 -> EQ1 BD0 CH7, had an extremely weird evolution with bias voltage....
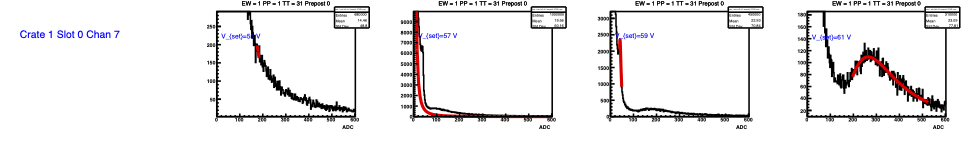
Figure 16: Evolution of signal of EW1PP1TT31 - The autoscaling on the Y axis makes this a little hard - it has some weird structure and fit the peak strangely which is why it was given such a large value for the bias. 58 V looks about right for this.
The last weirdness that was seen were these spikes:
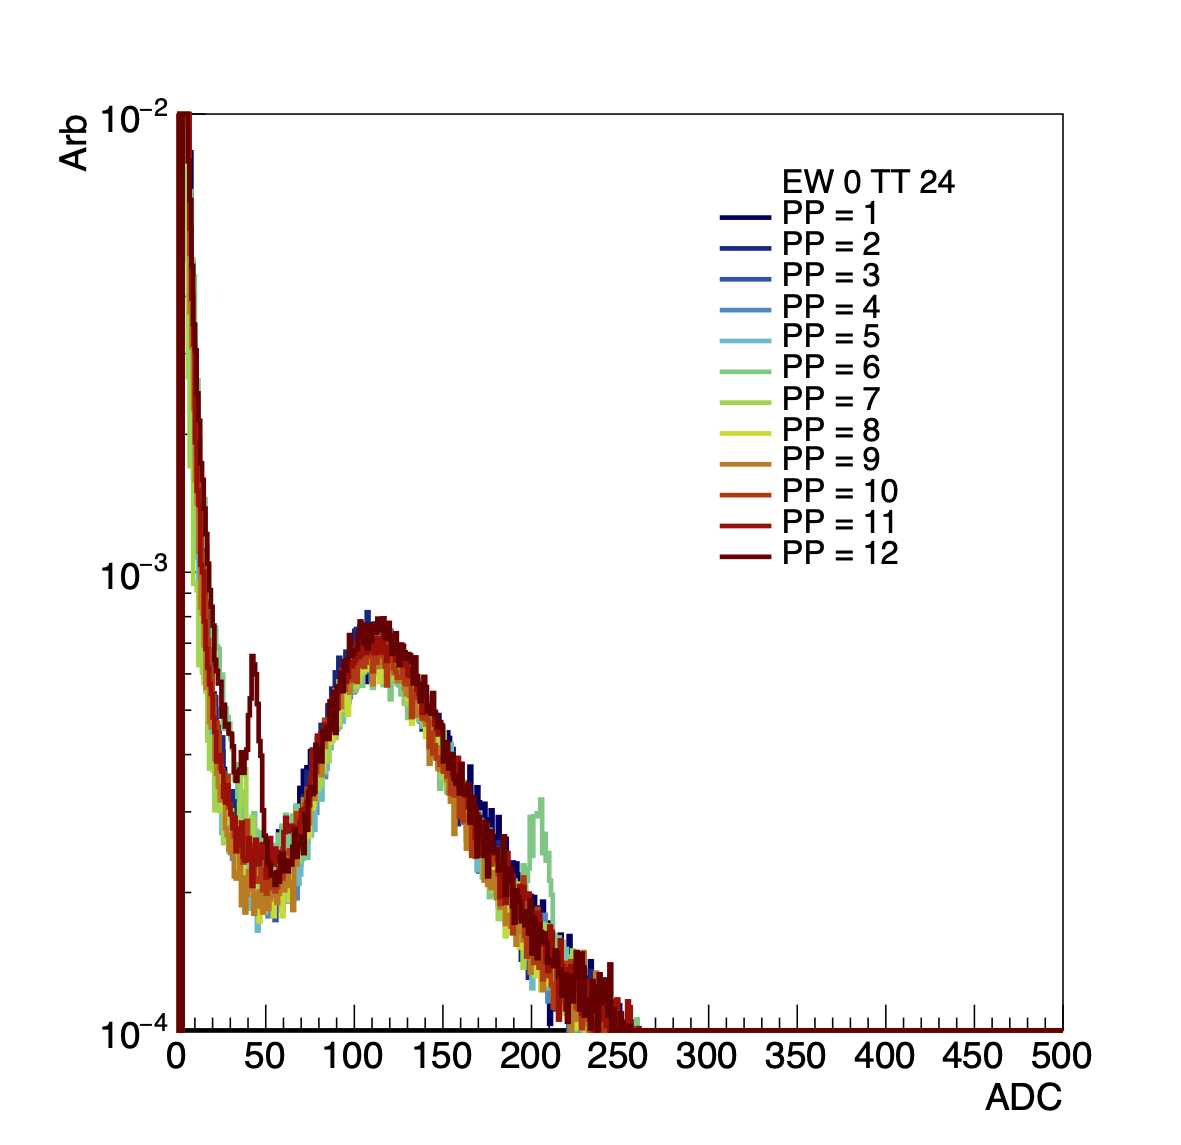
Figure 17: East TT24. These spikes seem to be in every run, and seem to be mainly this East PP6 (though most of them are on the low side). This probably represents some sort of board issue. List is PP6 TT19, 20, 22, 24, 25, 27, 29(?) and PP12 TT19, 22, 24, 29(?). This corresponds to EQ2 BD6 Ch 11,12,14, EQ2 BD1 CH 8,9,11,13(?) for PP6 - so not all the same board. The other corresponds to EQ1 BD7 CH27, 28, 30 and EQ2 BD3 CH 24, 29.
Perhaps it is not worth switching out the boards with the low side spikes.....
Looking through the bias scan it doesn't seem like this is absolutely consistent - though one thing is clear that the spikes appear in some channels as vbias increases, indicating that it might be better to drop the bias of the QT32Bs in general......
Turns out it is even less needed since I don't see the spikes in today's data... :-/ (See drupal.star.bnl.gov/STAR/system/files/TileByTile_22053046.pdf and drupal.star.bnl.gov/STAR/system/files/TileByTile_22053047.pdf )
- rjreed's blog
- Login or register to post comments