Run9 500 GeV BTOW Relative Gains
The relative gains for the BTOW in the run9 500 GeV running were calculated using "Scott's Method" based on the slopes of the ADC spectra. Since the data set has not been produced yet and there is a need for an initial calibration for the W result, one single fill of the data was produced, Fill #10471.
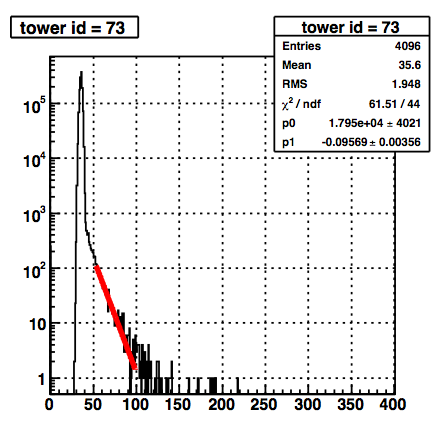
Section 1) Relative gains based on fill #10471 - Only the minbias triggered events in the data were used for this analysis. Using Scott's Method between fractions 1e-3 and 5e-5 (adjusted the parameters looking for a good fit), the slopes of the ADC spectra were calculated by fitting an exponential to the slope between the two aggregate fractions. An example of a fit can be seen in the following figure.
Figure 1
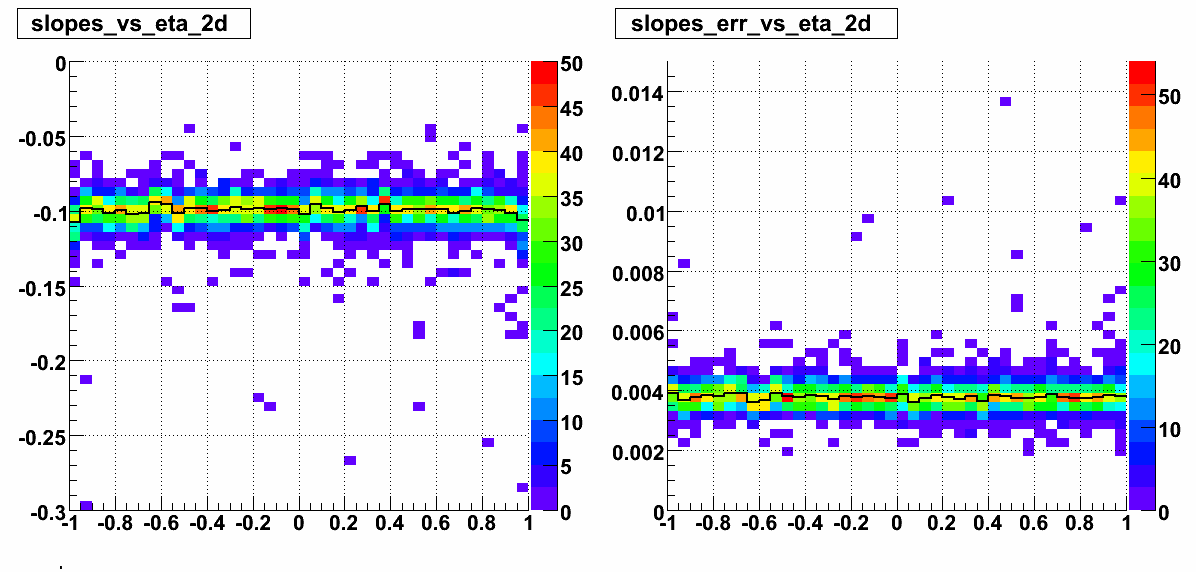
Histograms of all the slopes and their errors are shown in the following figure. The slopes and their errors can also be seen in a 2d histogram so you can see any problems that have geometrical correlations. They are shown after the 1d histogram.
Figure 2
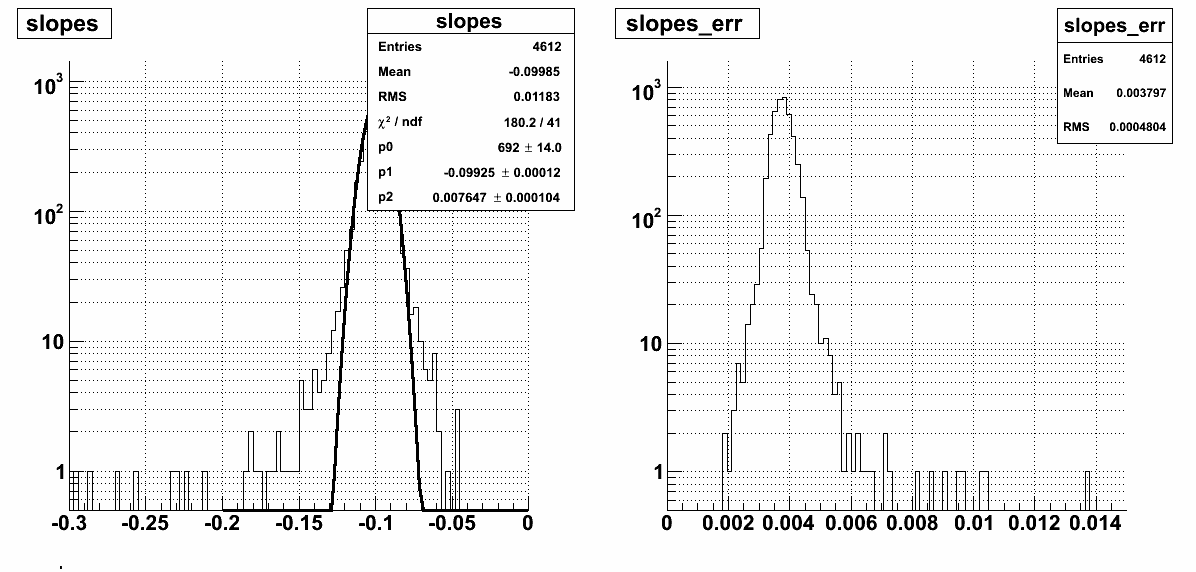
Figure 3
.png)
There is an obvious problem that an entire module was not in the data stream during this fill. There are also a few other places where the slopes look like there is a geometrical problem. Because of this, the BTOW relative gains will also be calculated using the L2W dataset and then any place where the relative gain has a problem in this fill, the relative gain from the L2W data will be used. For a complete set of the spectra and the fit that was obtained see the attached pdf (ps_combined.pdf) where they are organized by the tower softID.
The average of the slopes in each eta ring is then calculated. In order to avoid outliers which most likely have problems the calculation of the average was restricted to slopes that lie in the range [-0.15,-0.05]. You can see the distribution of slopes versus eta as well as the average (the black line) in the following plot.
Figure 4
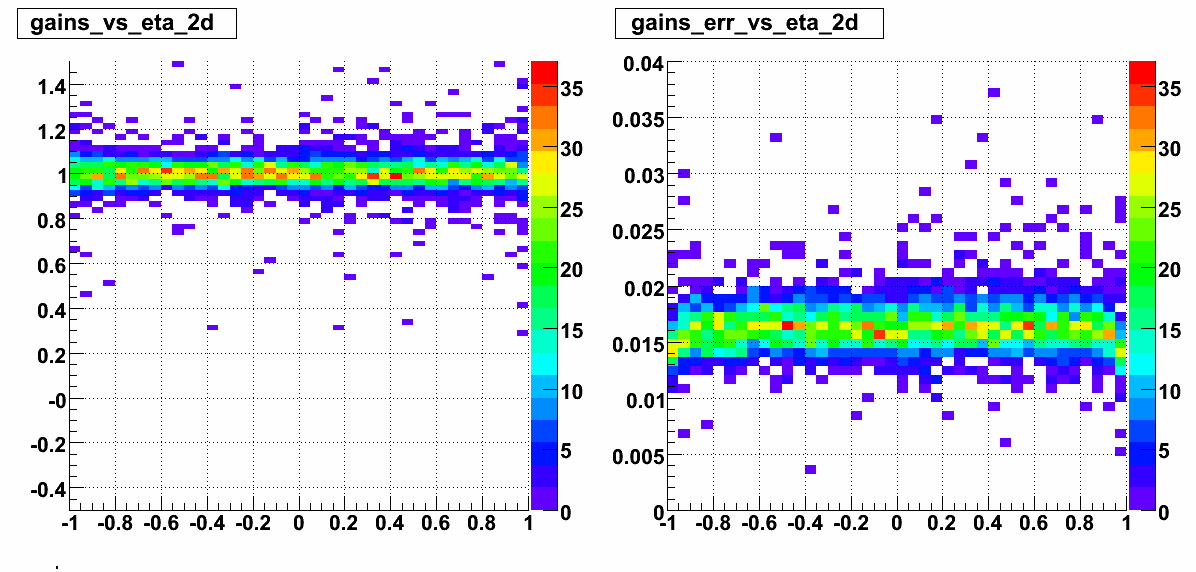
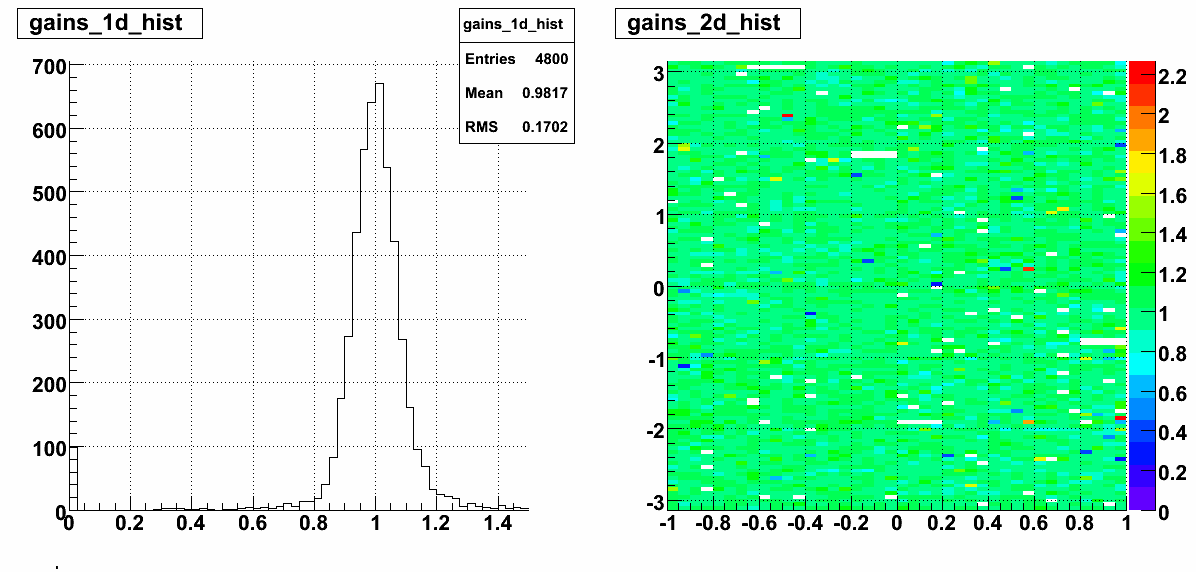
To calculate the relative gains, the slopes of each tower were divided by the average of the eta ring that the tower exists in. The relative gains from this fill can be see in the following plot.
Figure 5
The relative gains and their uncertainties (only the uncertainties from the fit) can be found in the file, BTOW_fill10471_gains.txt, that is attached at the end of this blog where in the file you have (softID, relative gain, relative gain unc.) The number in that file, which has an average of ~1, is the average slope in the eta ring divided by the slope of the tower. The average slopes for each eta ring can be found in the file BTOW_fill10471_avg_gains.txt (eta bin from -1->+1, mean slope, mean slope unc.).
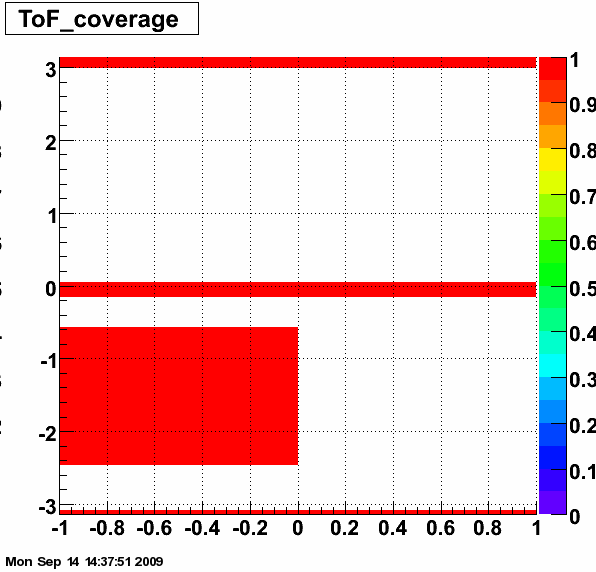
Section 2) Location of ToF trays - There were a number of modules in the BEMC where there are not ToF trays either because they won't fit there or because they haven't been installed there yet. They are NOT in front of BEMC modules 13, 14, 43, 44, 102, 103, 72, 73, 80-97. Below you can see where they are not (the red is where there are no trays and the white is where there are installed trays). The eta-phi of this graph line up with the eta-phi of the slopes/slopes-errs from Section 1.
Figure 6
Section 3) Relative gains based on the L2W adc spectra - All the same calculations that were done for the calculation done with the fill #10471 data were again done here. Similar figures to what was shown in section 1 are shown below for the L2W data.
Figure 7
.png)
Figure 8
.png)
Figure 9
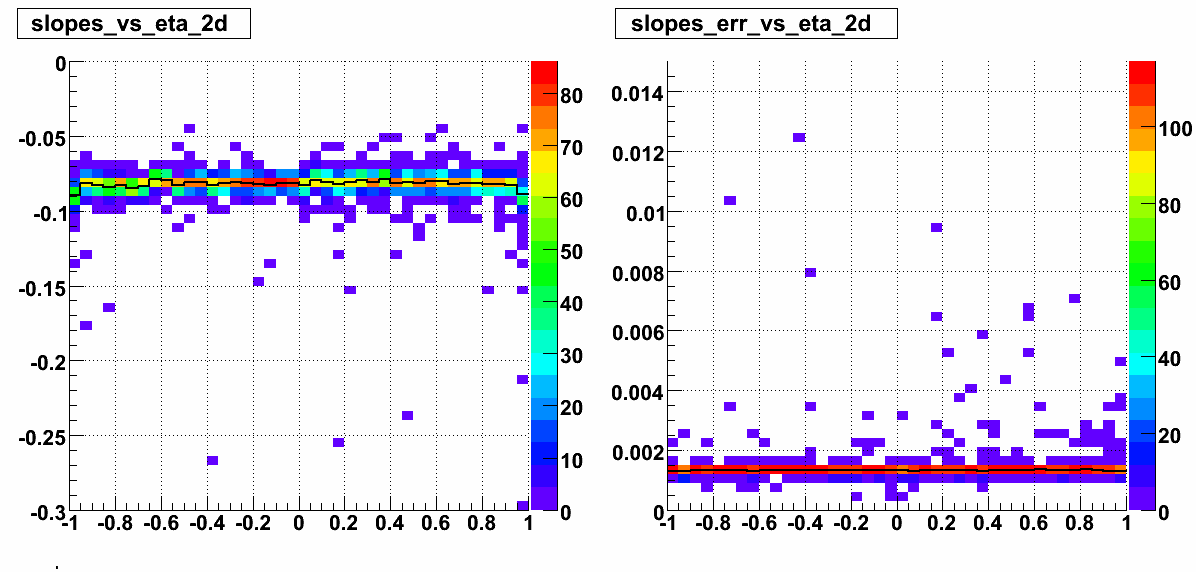
Figure 10
The same files can also be found as attached but for this L2 data set, but with the L2 in the name of the file.
Section D) The final run9 BTOW relative gains - The final relative gains can be found in BTOW_tot_gains.txt. The distributions can be seen in the following figure.
Figure 11
Update - 10/27/2009) - Recall that Matt had performed the same relative gains analysis using MIPs and we found that there were a number (~60) towers where Matt could not find a MIP peak in the data, but I found a slope that looked reasonable when I calculated the relative gains using the slopes method described above. I looked at all the spectra for the cases where Matt did not a MIP but where I found a reasonable slope and they look like they were essentially low gain towers where for one reason or another the MIP got "eaten-up" by the pedestal peak. You can see all the spectra for those towers in the mipless.pdf file in the attachments (a list is in mipless.txt). There look to be a few cases where it was just a low gain (e.g. tower id 561), some where there was a "shoulder" at the intersection of the tail and the pedestal peak (e.g. tower id 953,3679) and some where perhaps the pedestal peak was a bit broader (e.g. tower id 857). I am not sure what the cause of the "shoulder" is, but being that the slopes look reasonable I think these towers are fine to use in the W analysis as long as we calculate their relative gains using the slopes method.
With this, a final list of bad towers was also compiled (~100). The spectra for all those towers can be seen in bad.pdf in the attachments. And a simple list of all the bad towers can be found in bad.txt. There are some towers that are obviously giving no signal and there are some towers that just seem to have a low gain which could possibly be recovered.
- seelej's blog
- Login or register to post comments