- seelej's home page
- Posts
- 2011
- 2010
- December (2)
- November (3)
- October (3)
- September (3)
- June (2)
- May (3)
- April (2)
- February (9)
- January (1)
- 2009
- December (1)
- October (3)
- September (4)
- August (1)
- July (1)
- June (6)
- May (1)
- April (4)
- March (5)
- February (1)
- January (4)
- 2008
- My blog
- Post new blog entry
- All blogs
Relative Luminosity Studies - I
Picking up from where James Hays-Wehle stopped, I started to perform my own investigations into the problems in the data. Inspired by some of the statements from Hal Spinka (talk) I decided to look at a lower level in the data to see if it agreed with my expectations. First I broke up the data into the 4 spin patterns (P1, P2, P3, P4) and looked at the ratio of the corrected zdcx to the corrected bbcx versus the bunch crossing number.

There is clearly something not quite right/understood about some of these bunches. There is a decrease in this ratio in the bunch right after the abort gaps (0,1,2,3,40,41,42). There is also an odd pattern that occurs in 3 bunches later on (78,79,80). It isn't clear what is going on in these bunches, but it has to be something that affects the distribution of protons within a bunch in such a way as to change the acceptances of the ZDC and BBC. In addition to the steep rise in the ratio after a abort gap there also appears to be a smaller rise (in a logarithmic type manner).
Just to pursue some studies, I cut out any of the bunches that looked odd (the ones listed above), but this has no large affect on the large shifts from 0 that we have been seeing in the delta-Rs. This may solve some of the oddities that Hal has been seeing that are correlated with the spin pattern, but this has not been investigated yet, as the large shifts are still present and I want to figure out these large shifts before pursuing the smaller effects.
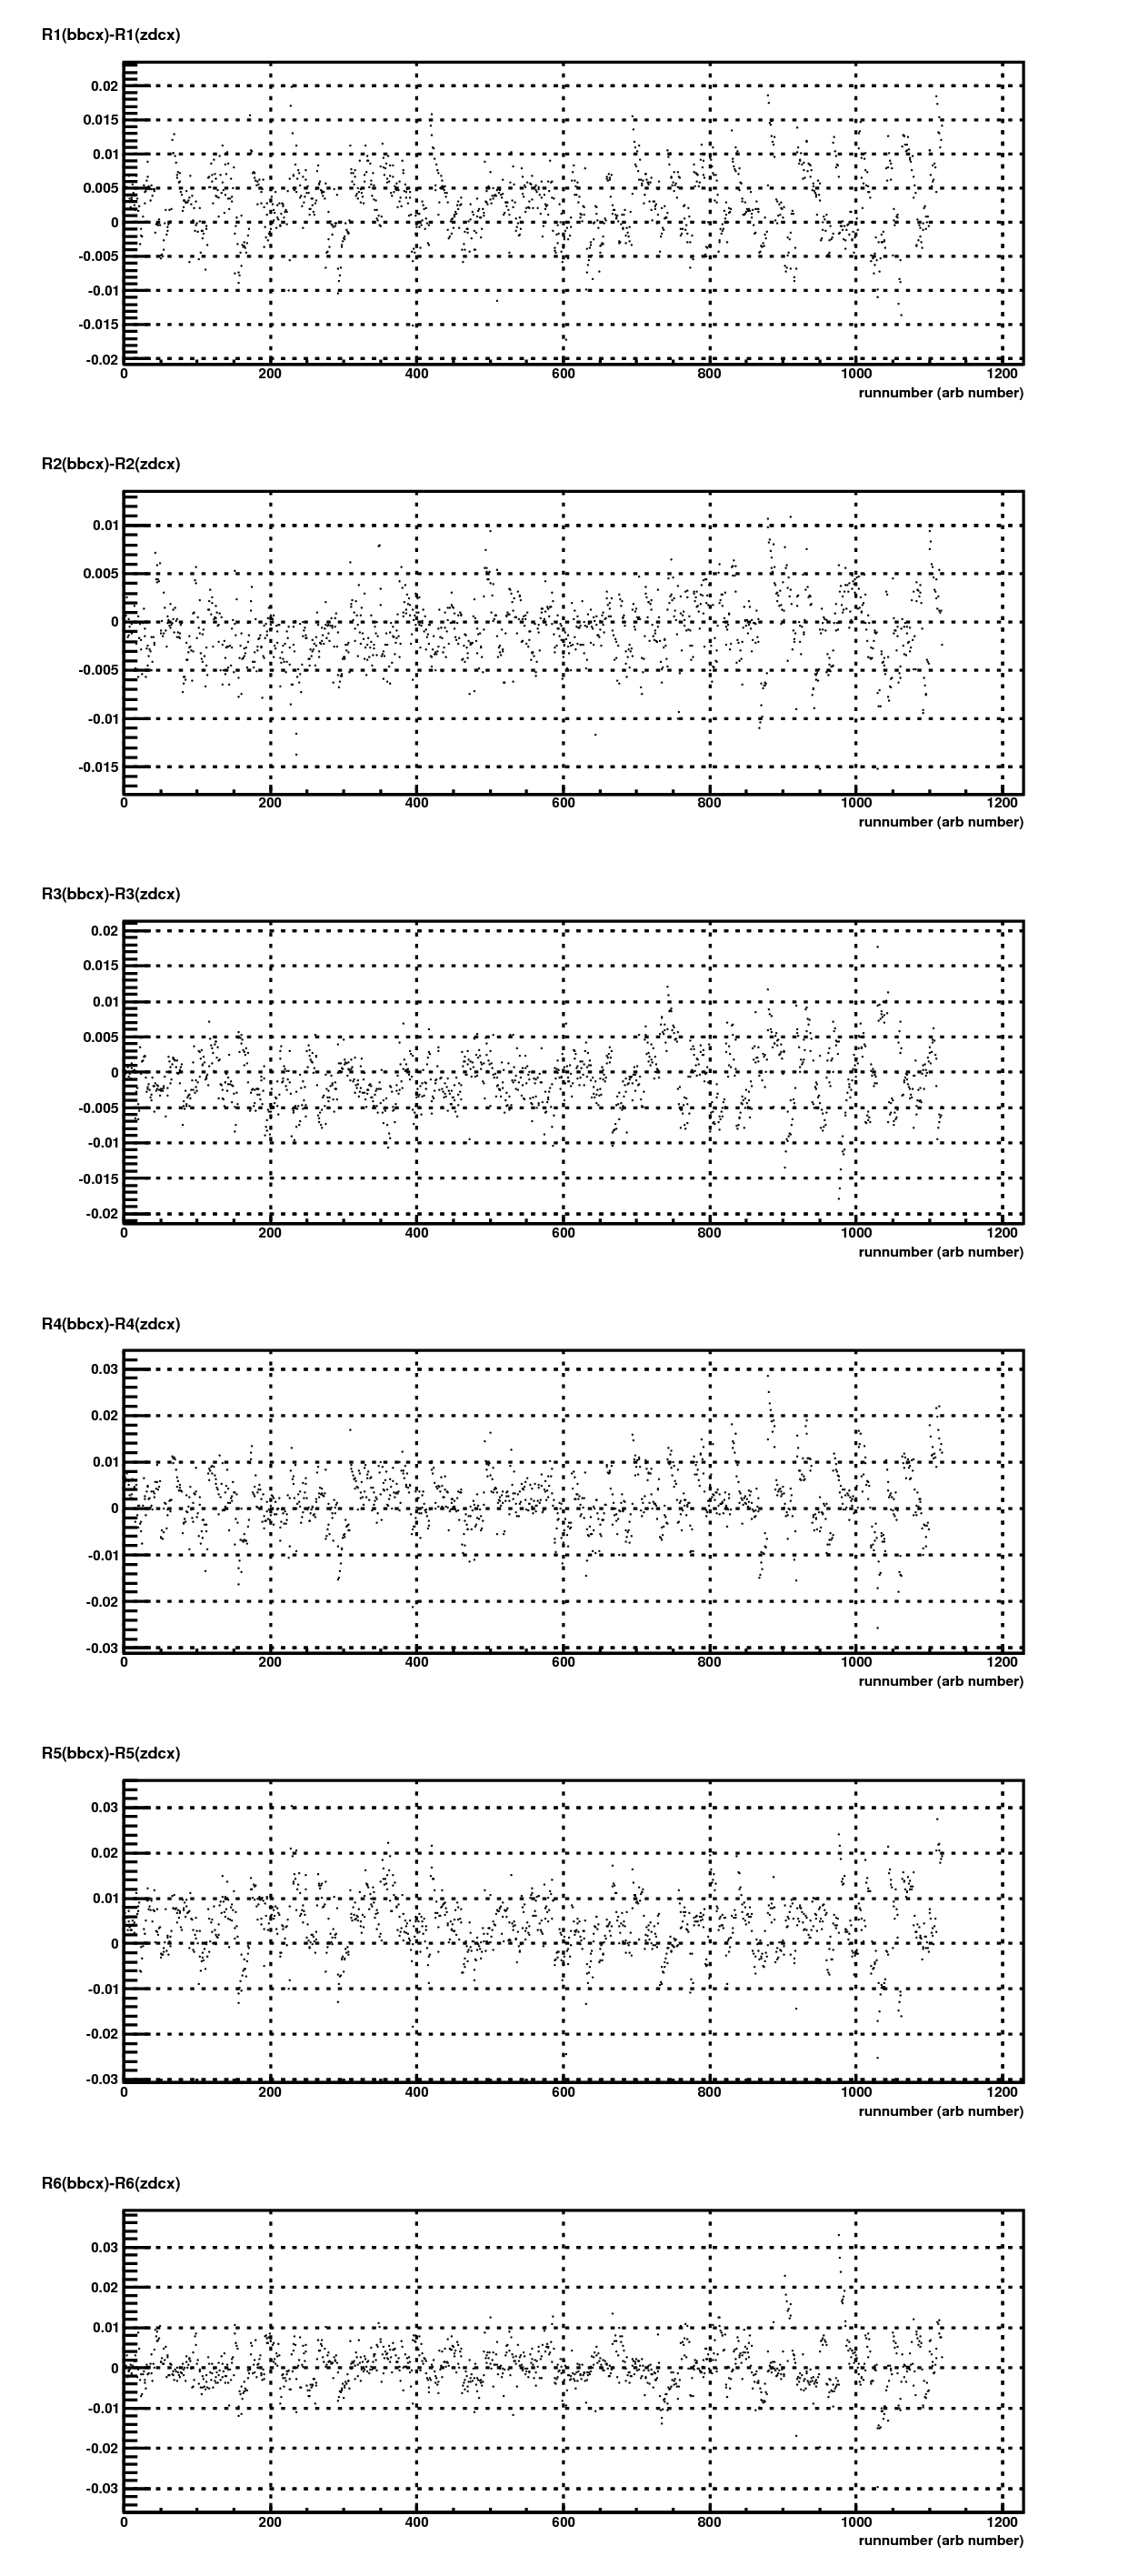
My next idea is to look at all the delta-R's versus # of run in the data taking (arbitrary count in run9) to see if their shifts from 0 appear to be statistical or not. Plotted below are all the delta-R's versus runnumber.

This data has clear non-statistical patterns. There is a characteristic "zig-zag"ing in the data. Unsure of where this is coming from (but concerned about various corrections) I decided to go to an even lower level in the data to see if the simple ratios look normal. Next is plotted the ratio of the corrected zdcx to the corrected bbcx again versus runnumber and separated by the spin pattern of the bunching crossing (++, -+, +-, -- or 5,6,9,10).
.png)
Again in this data you see clear non-statistical fluctuations for something that should be flat. And the fluctuations appear to be in a striated form such that the ratio decreases as time in a fill progresses. This hints that the nonlinear corrections are either incorrectly implemented in their current form or there is another bias in the data that is not being properly taken into account. There are even longer wavelength changes in the data as well which may be caused from the change in the voltages of the detectors as time in run9 progresses.
The next thing I plan on looking at is if the nonlinear corrections are properly done by doing the calculation myself and then going from what I see there.
- seelej's blog
- Login or register to post comments
