- seelej's home page
- Posts
- 2011
- 2010
- December (2)
- November (3)
- October (3)
- September (3)
- June (2)
- May (3)
- April (2)
- February (9)
- January (1)
- 2009
- December (1)
- October (3)
- September (4)
- August (1)
- July (1)
- June (6)
- May (1)
- April (4)
- March (5)
- February (1)
- January (4)
- 2008
- My blog
- Post new blog entry
- All blogs
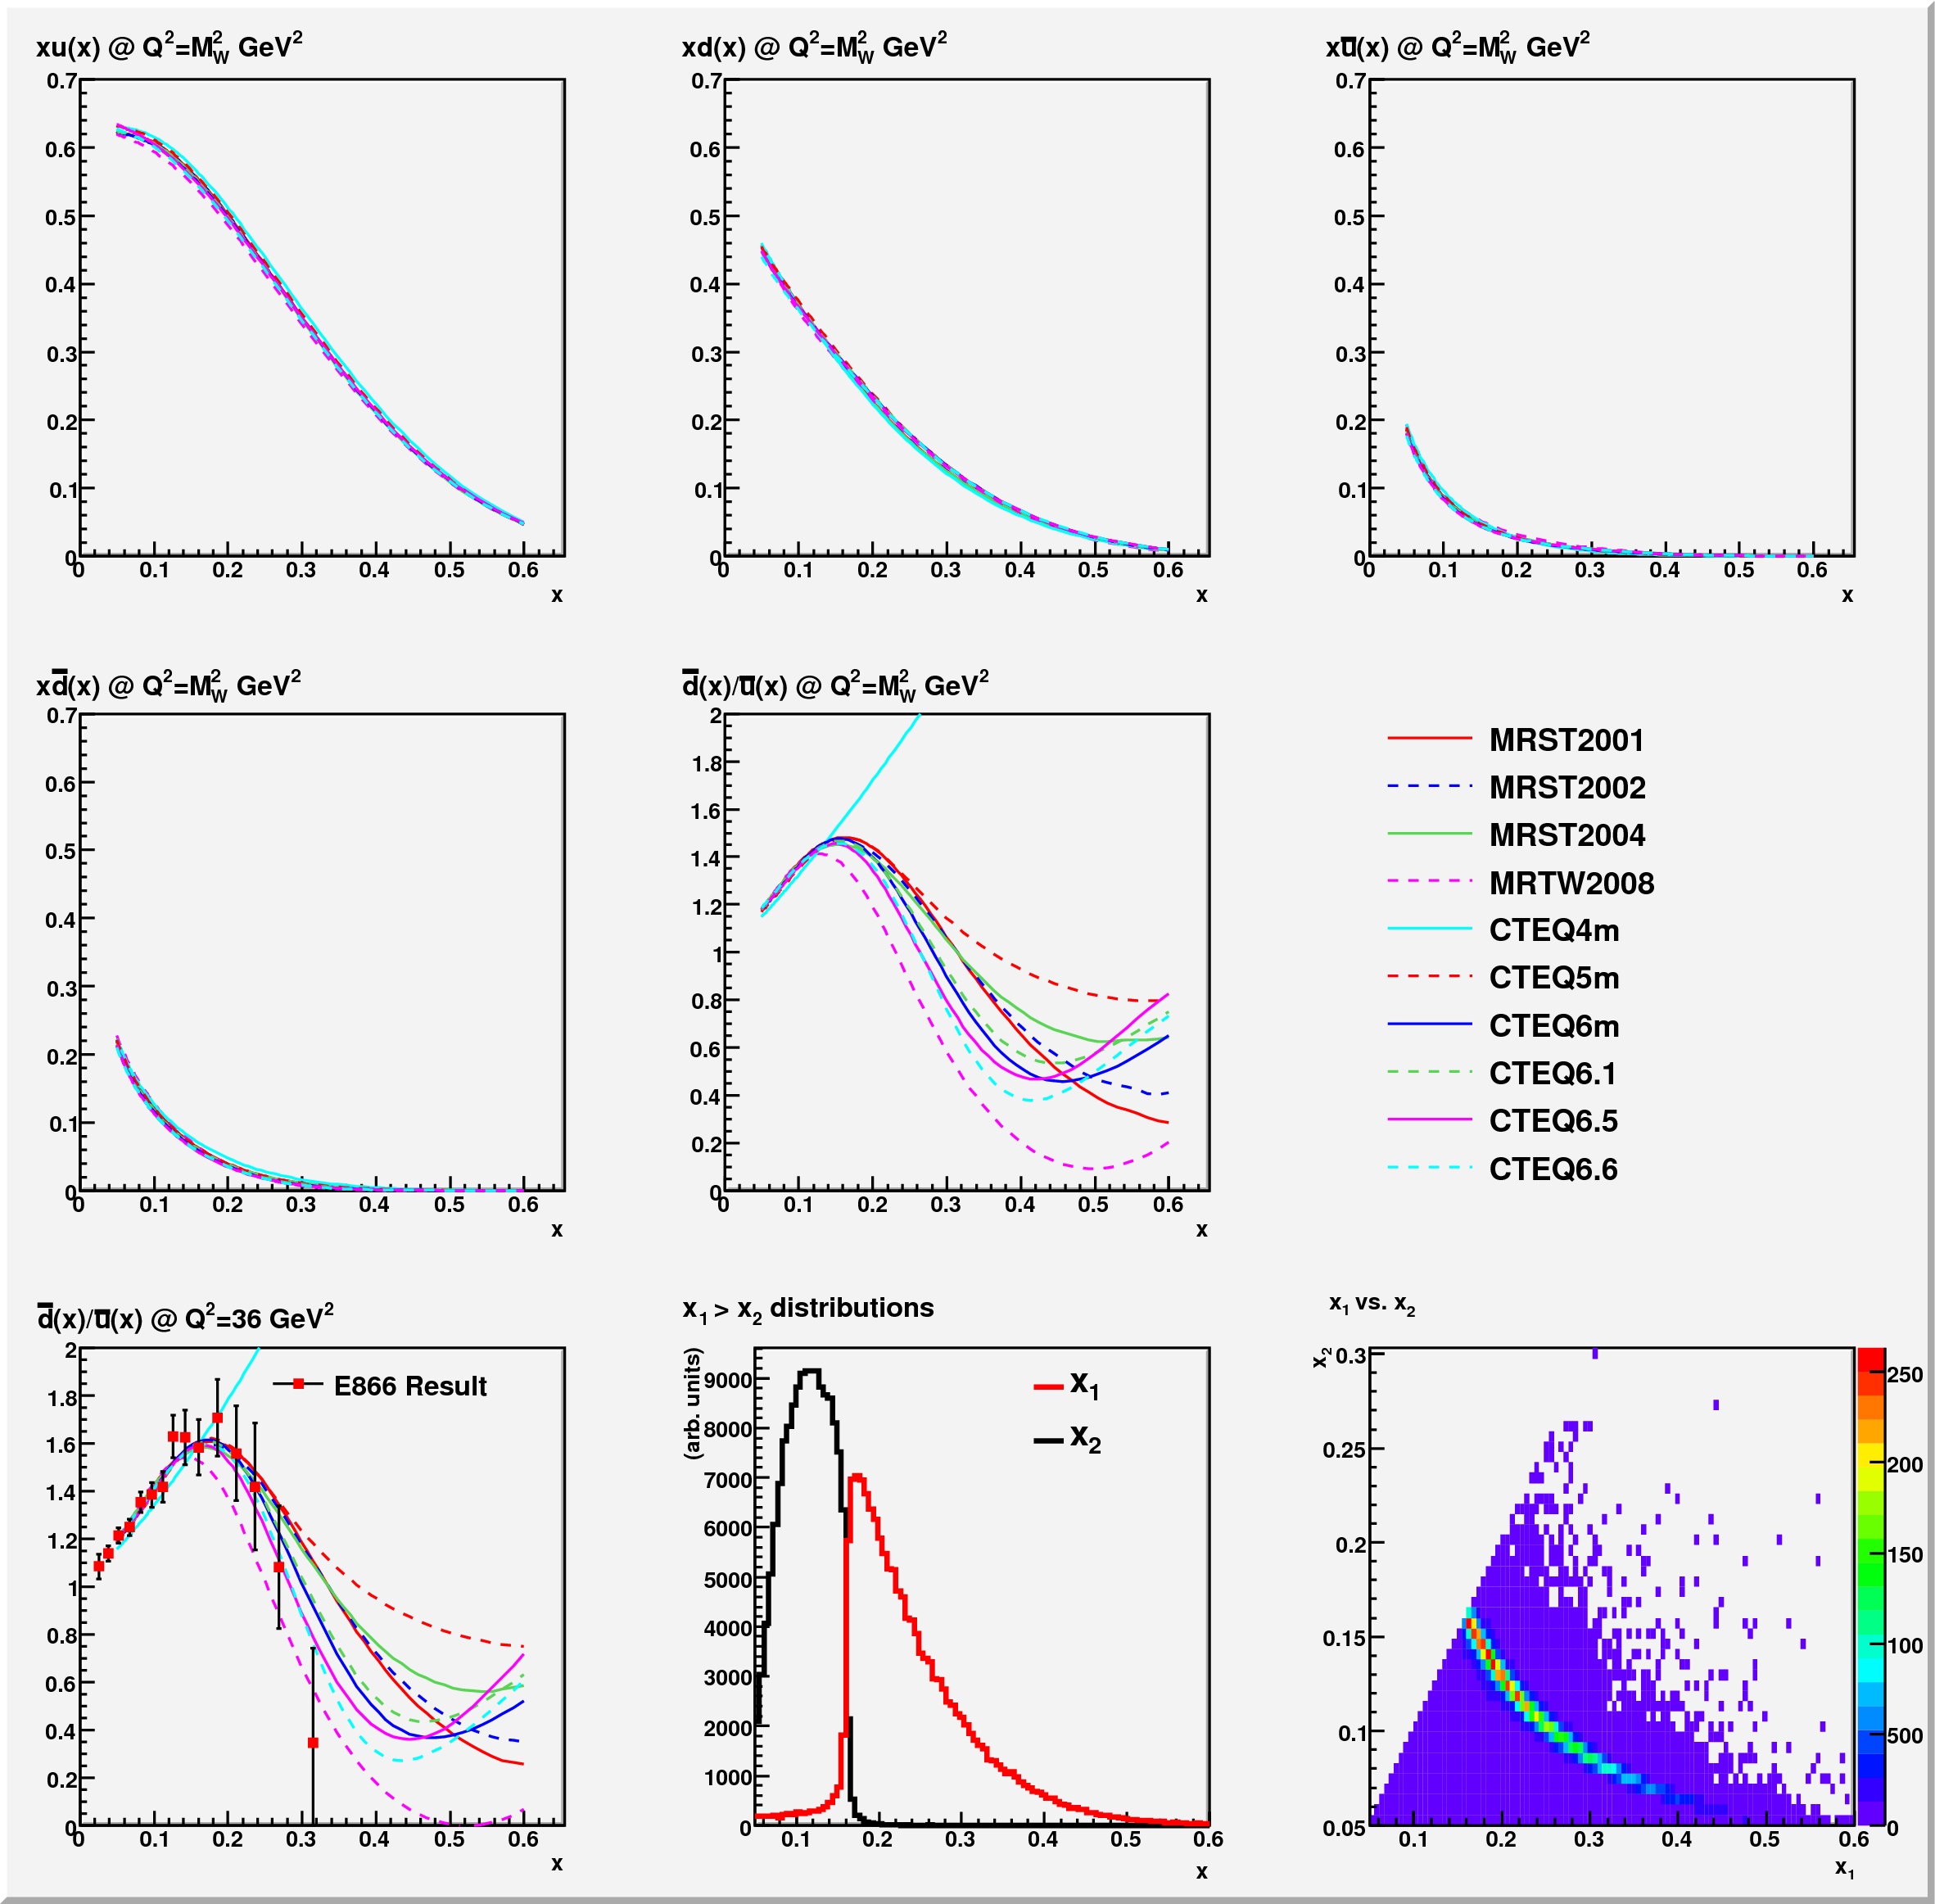
Amassed PDFs and E866 Data
I have amassed a large amount of pdf information and put it together in the following plot.
x*u(x)
x*d(x)
x*ubar(x)
x*dbar(x)
dbar(x)/ubar(x) at Q^2=Mw^2
legend of pdfs
dbar(x)/ubar(x) at Q^2=36 (~avg e866 Q^2) with e866 data points
x1 and x2 distributions from pythia (x1 is always greater than x2 in my definitions)
x1 vs x2 distribution from pythia (again x1 is always greater than x2)
Groups:
- seelej's blog
- Login or register to post comments