- seelej's home page
- Posts
- 2011
- 2010
- December (2)
- November (3)
- October (3)
- September (3)
- June (2)
- May (3)
- April (2)
- February (9)
- January (1)
- 2009
- December (1)
- October (3)
- September (4)
- August (1)
- July (1)
- June (6)
- May (1)
- April (4)
- March (5)
- February (1)
- January (4)
- 2008
- My blog
- Post new blog entry
- All blogs
New Background Subtraction Method for the W and Systematic Uncertainties
Physics Backgrounds in the W Signal and QCD Background Shape
There are a number of potential sources of calculable backgrounds (a la Pythia) in both the nominal W signal region and in the background that we subtract from the signal to get our final cross section signal. To illustrate the potential sources that we can calculate the following plot shows the a number of plots. Each column represents a different signal that is calculable in pythia. From left to right we have W+->e++nu, W-->e-+nubar, W->tau+nu,W+jet,Z->e+e-,Z->any. And each row represents its contribution to a the signal or a background shape. From top to bottom we have the W signal region (plotted over the true data W signal for scale), the EEMC background from the missing endcap background, and the QCD background shape calculated by inverting the awayside jet type cuts.

From the plots you can see that there is a small contamination from the W->tau signal in the W signal region at low ET and essentially no contamination from the Z decays in the W signal region. The EEMC background has no contamination (outside of a few scattered counts from Zs) from any of the signals. The QCD background shape does have a reasonable level of contamination from the Z signal at higher ET.
Before normalization and subtraction, the W->tau contamination will be subtracted from the W signal and the Z contamination will be subtracted from the QCD background shape (with the proviso that the background will always be kept to be >= 0).
New Background Subtraction Method
This is done after the missing endcap and physics backgrounds have been subtracted from the W signal and the QCD background shape.
Because we are normalizing the QCD background shape in a region with a non-negligible amount of W signal contamination (10% or more) we should take into account the amount of W signal in those bins when normalizing the QCD background shape to W signal histogram. Because we can't a priori know how much is in the region we will use an iterative fitting method to estimate the amount of signal in the normalization bins. The algorithm is as follows
1) Estimate the amount of background in the normalization bins using the linear fit to the signal (in the first iteration assume it is zero). If the fit gives negative W signal in a bin, set it equal to 0 signal in that bin.
2) Subtract the estimated W signal from the normalization bins.
3) Normalize the QCD background shape to the normalization bins
4) Subtract the background estimate from the W signal to get W shape.
5) Fine a 1st order polynomial (line) to the W shape in the region ET = [21,39]
6) If < N iterations go back to step #1, else quit.
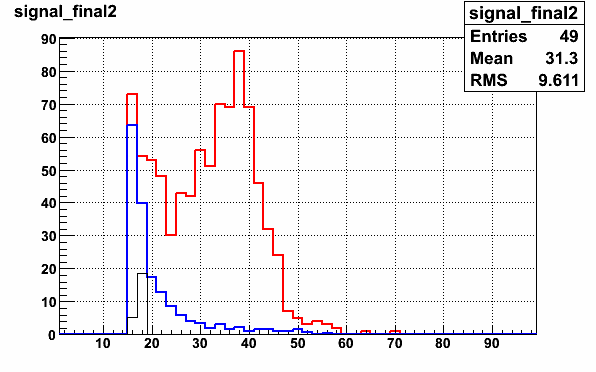
Just to be sure I used 20 iterations even though it converged quite rapidly (plot of line converging coming soon...) The resulting subtracted signal is shown in the next figure (this version was done without subtracting the physics background though)

Background Subtraction Systematic Uncertainty
In order to get an idea of how "right" our QCD background shape is I calculated a large number of QCD background shapes and looked at how much they varied. I varied the two awayside type background cuts over a large range to see what this gave. I indepedently varied the pTBalance from [5,25] in bins of 1 and the awayside pT from [10-50] in bins of 2 which gives 400 total QCD background shapes. Then I normalized the curves using the same W signal subtraction method described above (again without subtracting the physics background). The 400 QCD background shapes then look like the following

The plan for the systematic uncertainty is to take the maximum extent in each bin and use that as the systematic uncertainty due to the QCD background shape. Pretty much all the shapes have good chi2 values when the chi2 is calculated over the first 3 normalization bins.
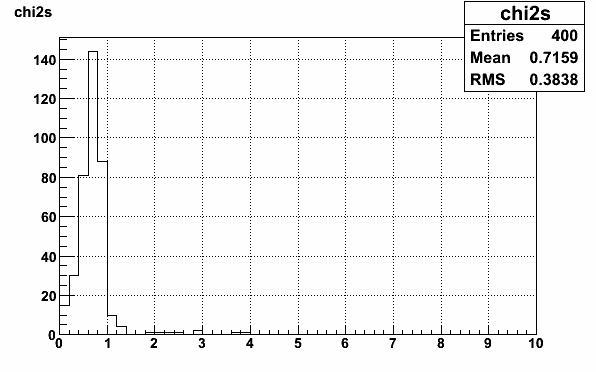
There are a few outliers, but they will just be included in the maximum extent uncertainty on the QCD background shape. I further plan to vary the normalization window to see how that affects the maximum extent uncertainty.
Groups:
- seelej's blog
- Login or register to post comments