- seelej's home page
- Posts
- 2011
- 2010
- December (2)
- November (3)
- October (3)
- September (3)
- June (2)
- May (3)
- April (2)
- February (9)
- January (1)
- 2009
- December (1)
- October (3)
- September (4)
- August (1)
- July (1)
- June (6)
- May (1)
- April (4)
- March (5)
- February (1)
- January (4)
- 2008
- My blog
- Post new blog entry
- All blogs
some TPC studies in pp500
Starting from the studies of Justin Stevens on the run9 pp500 data (http://drupal.star.bnl.gov/STAR/blog/stevens4/2010/jun/07/more-tpc-distributions-l2w-stream-sl09g) I decided to look at little deeper into the data on a number of fronts.
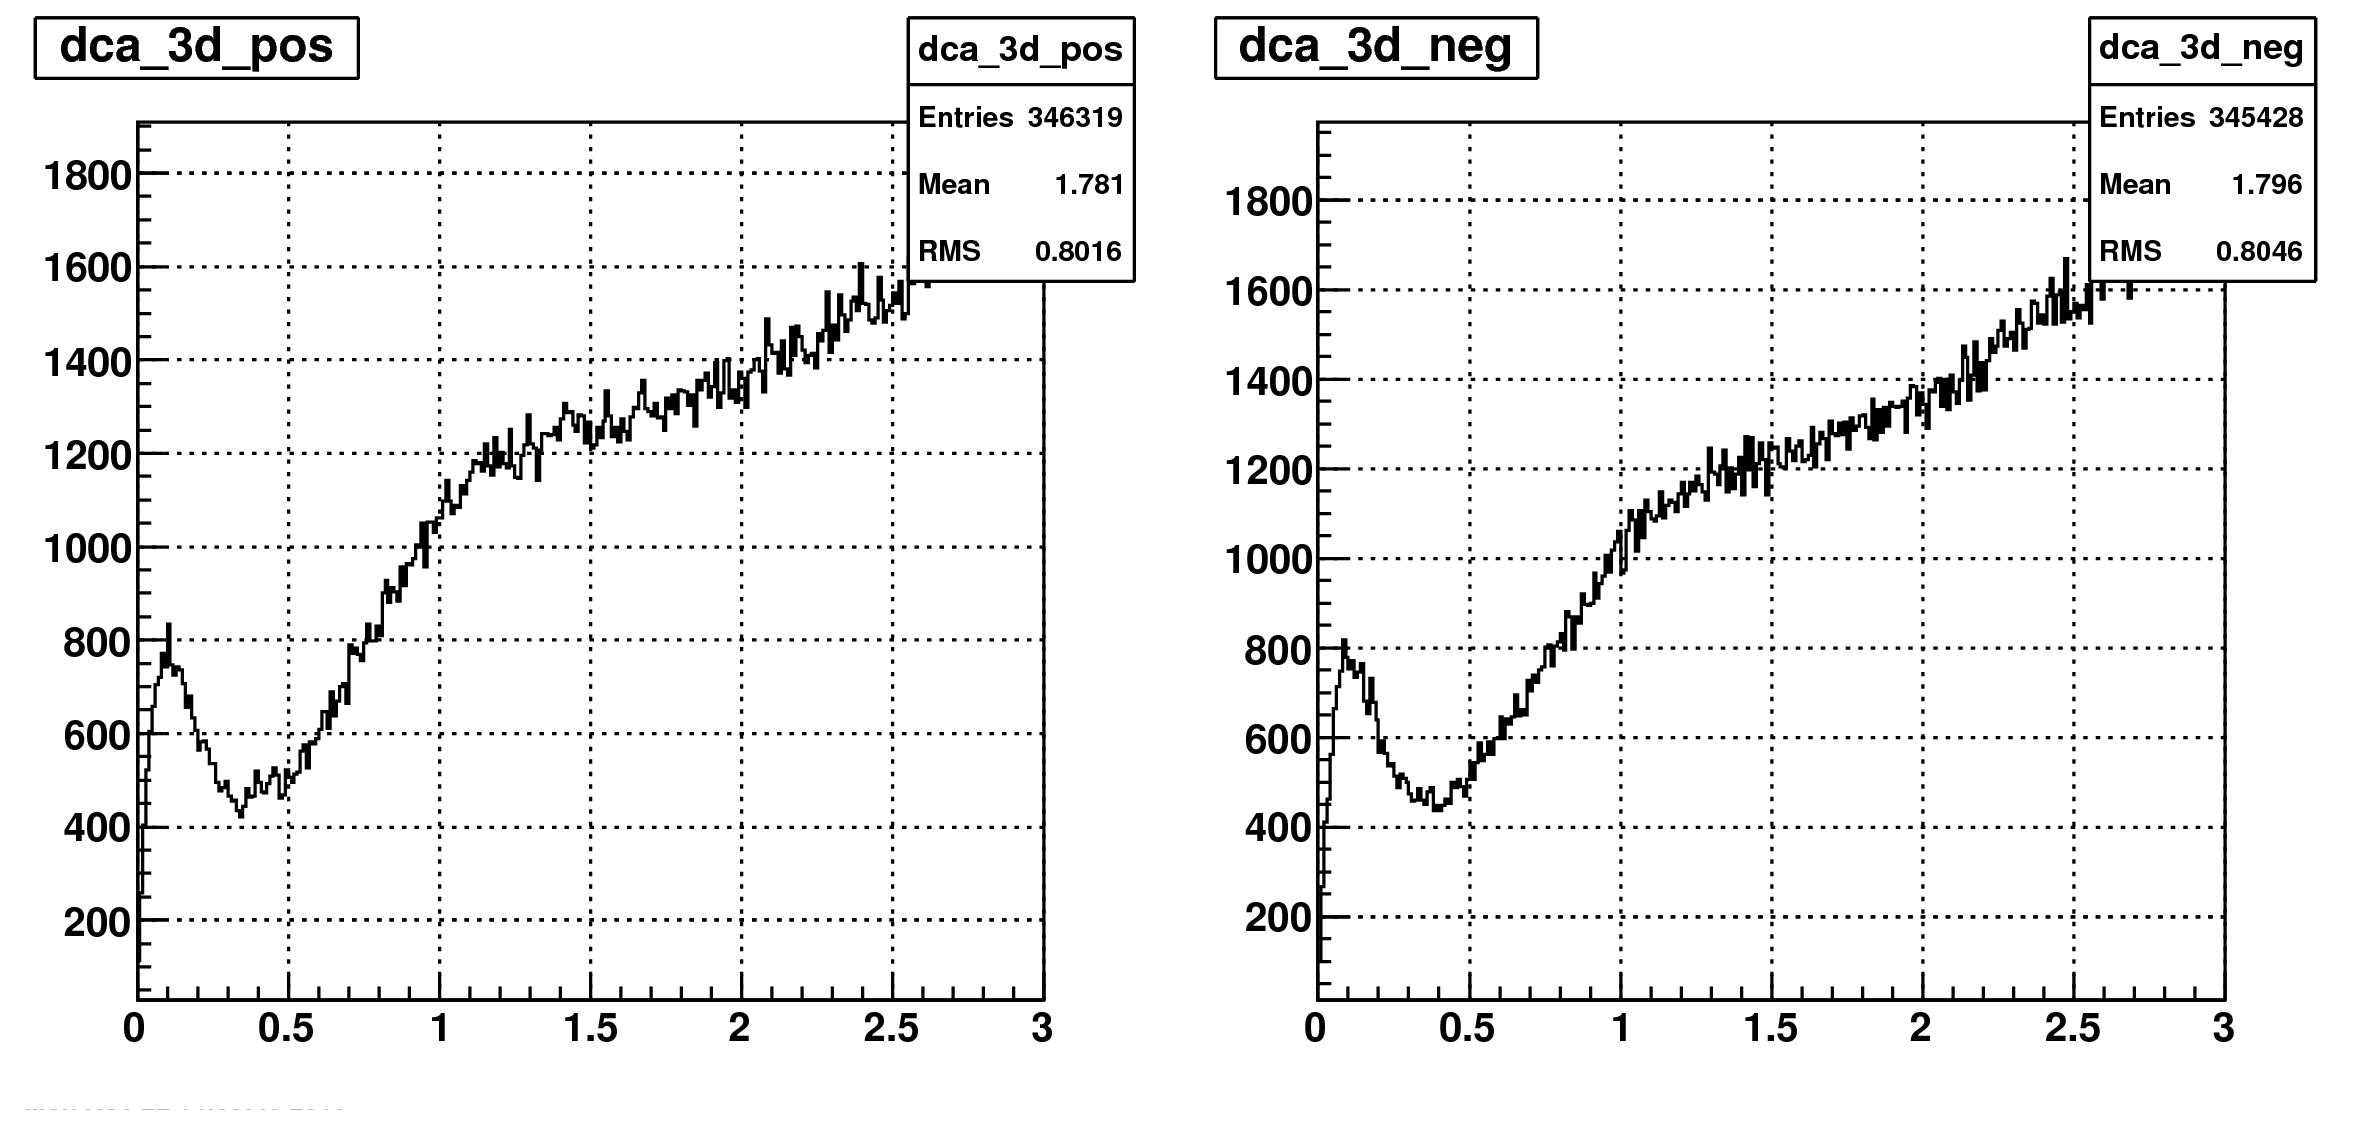
Central Membrane Crossing Tracks - For tracks crossing the central membrane, does the tracker find any hit points on the other side of the TPC? To test this I looked at all tracks that cross the central membrane and have at least 10 outer hit points on one side of the TPC and then starting from the side of the track that is at larger radius I looked across the central membrane to see which hit points are close to the projected track for the possibility that the hits are getting eaten up by another track somewhere and this is causing odd behavior. In the first image you can see the hits that were found versus their 3d dca to the track. You see a clear peak near dca3d=0 which is the hits points associated with a real track (i.e. not a pileup track.. these should not exist for pileup) and underneath it you see randomly associated background which is due to pileup and other tracks in the even and which naturally increases with the allowed distance to the track. To illustrate what we are looking at see the following image.
.png)
Then performing this search for the two halves of the TPC (called pos and neg here) you can see that by looking from either half of the TPC to the other half it is clearly finding hit points that are due to real tracks.

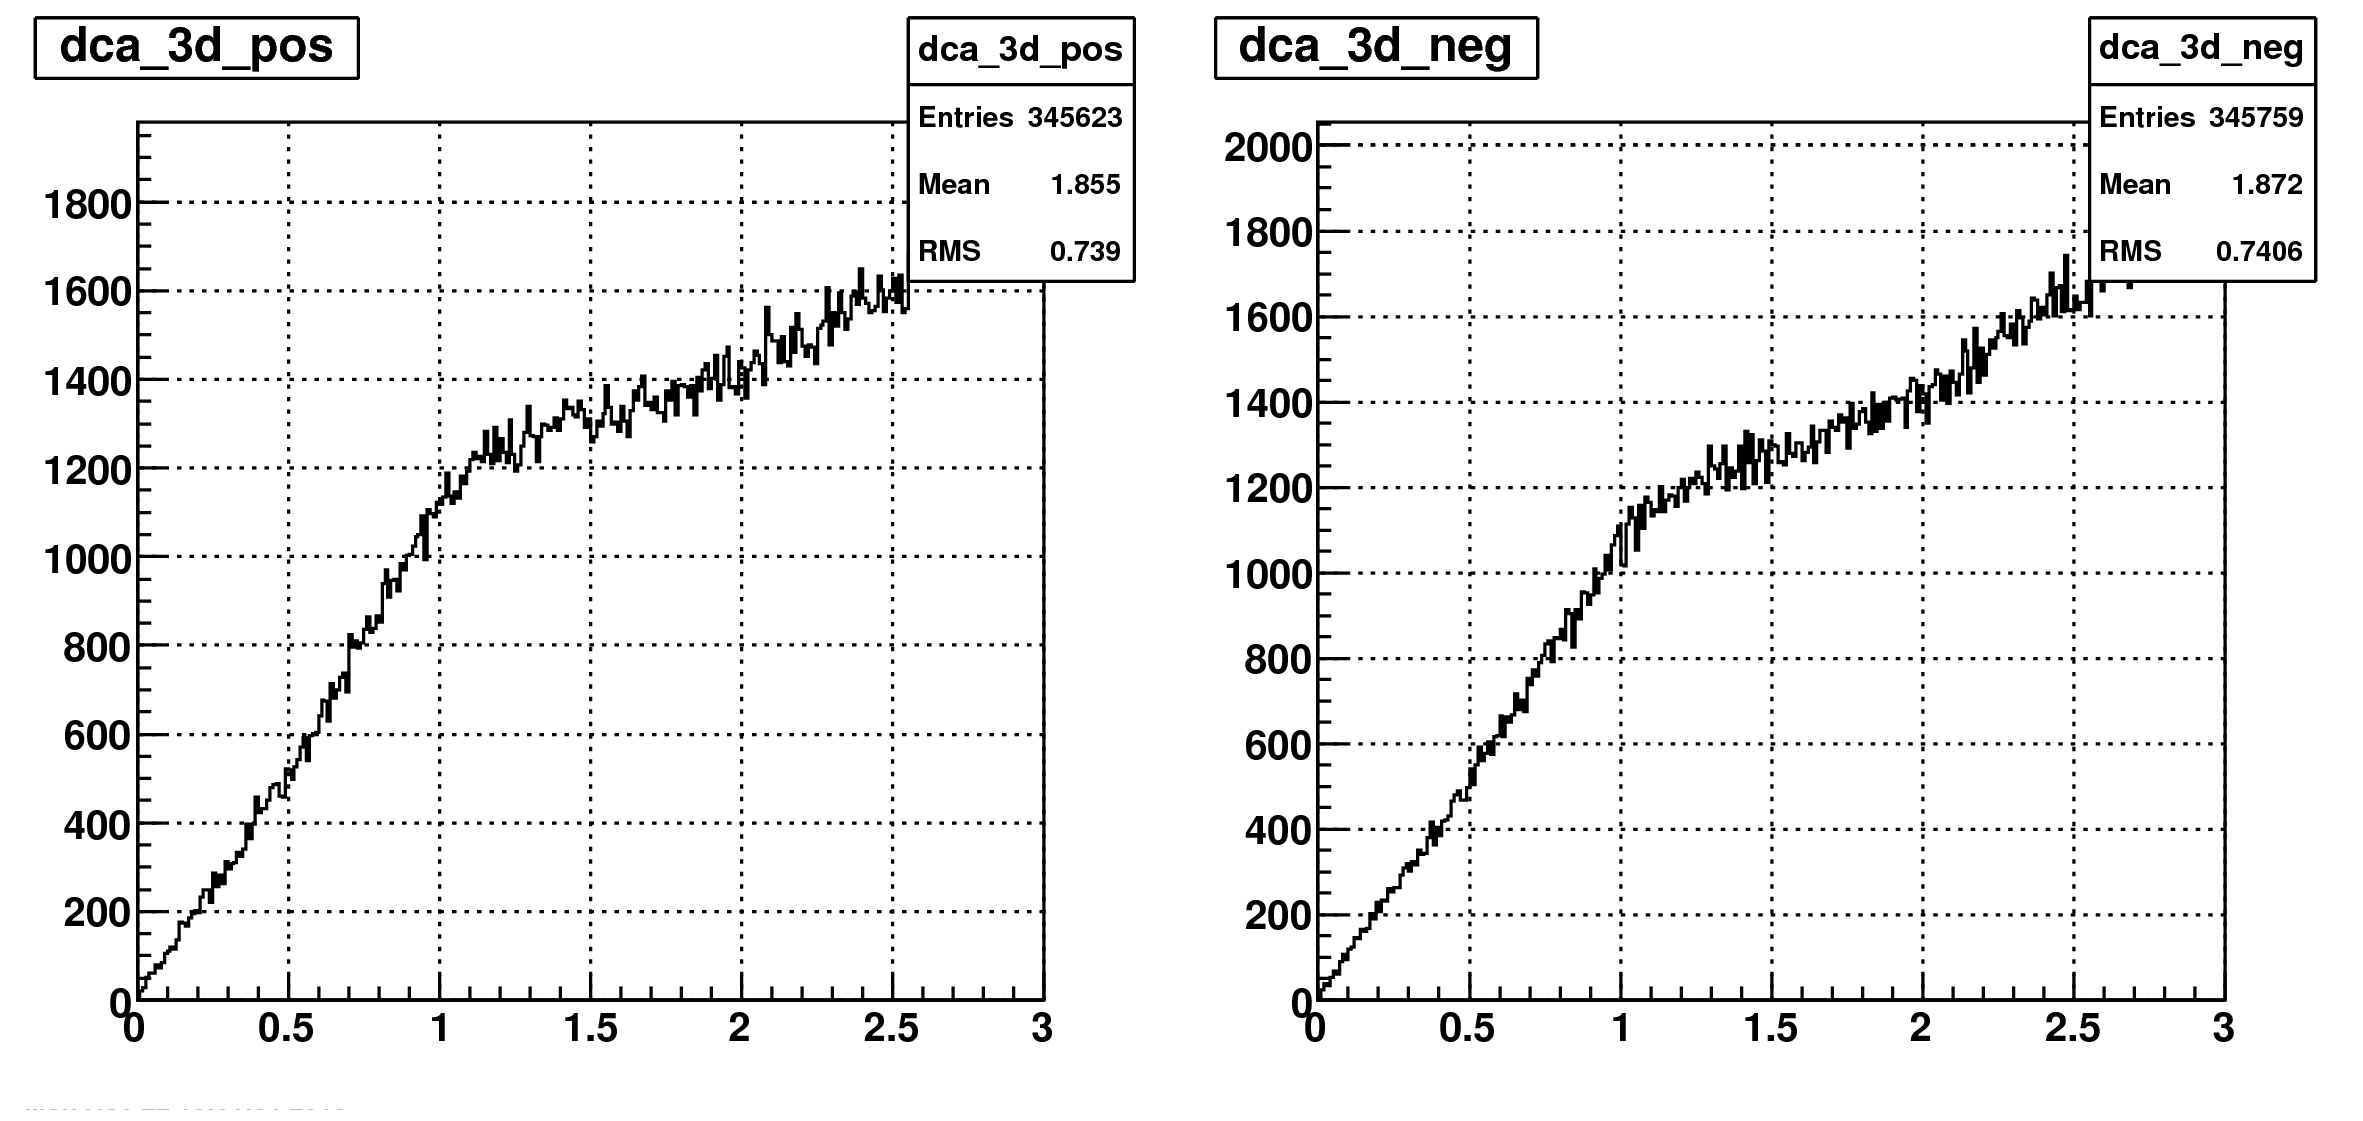
And Just to make sure that the hit points that are found by this code are the hit points that are actually associated with the track in the tracker, we veto all hit points that are associated with the track that is being looked at and you see that the peak near dca3d=0 goes away and all we are left with is the randomly associated pileup.

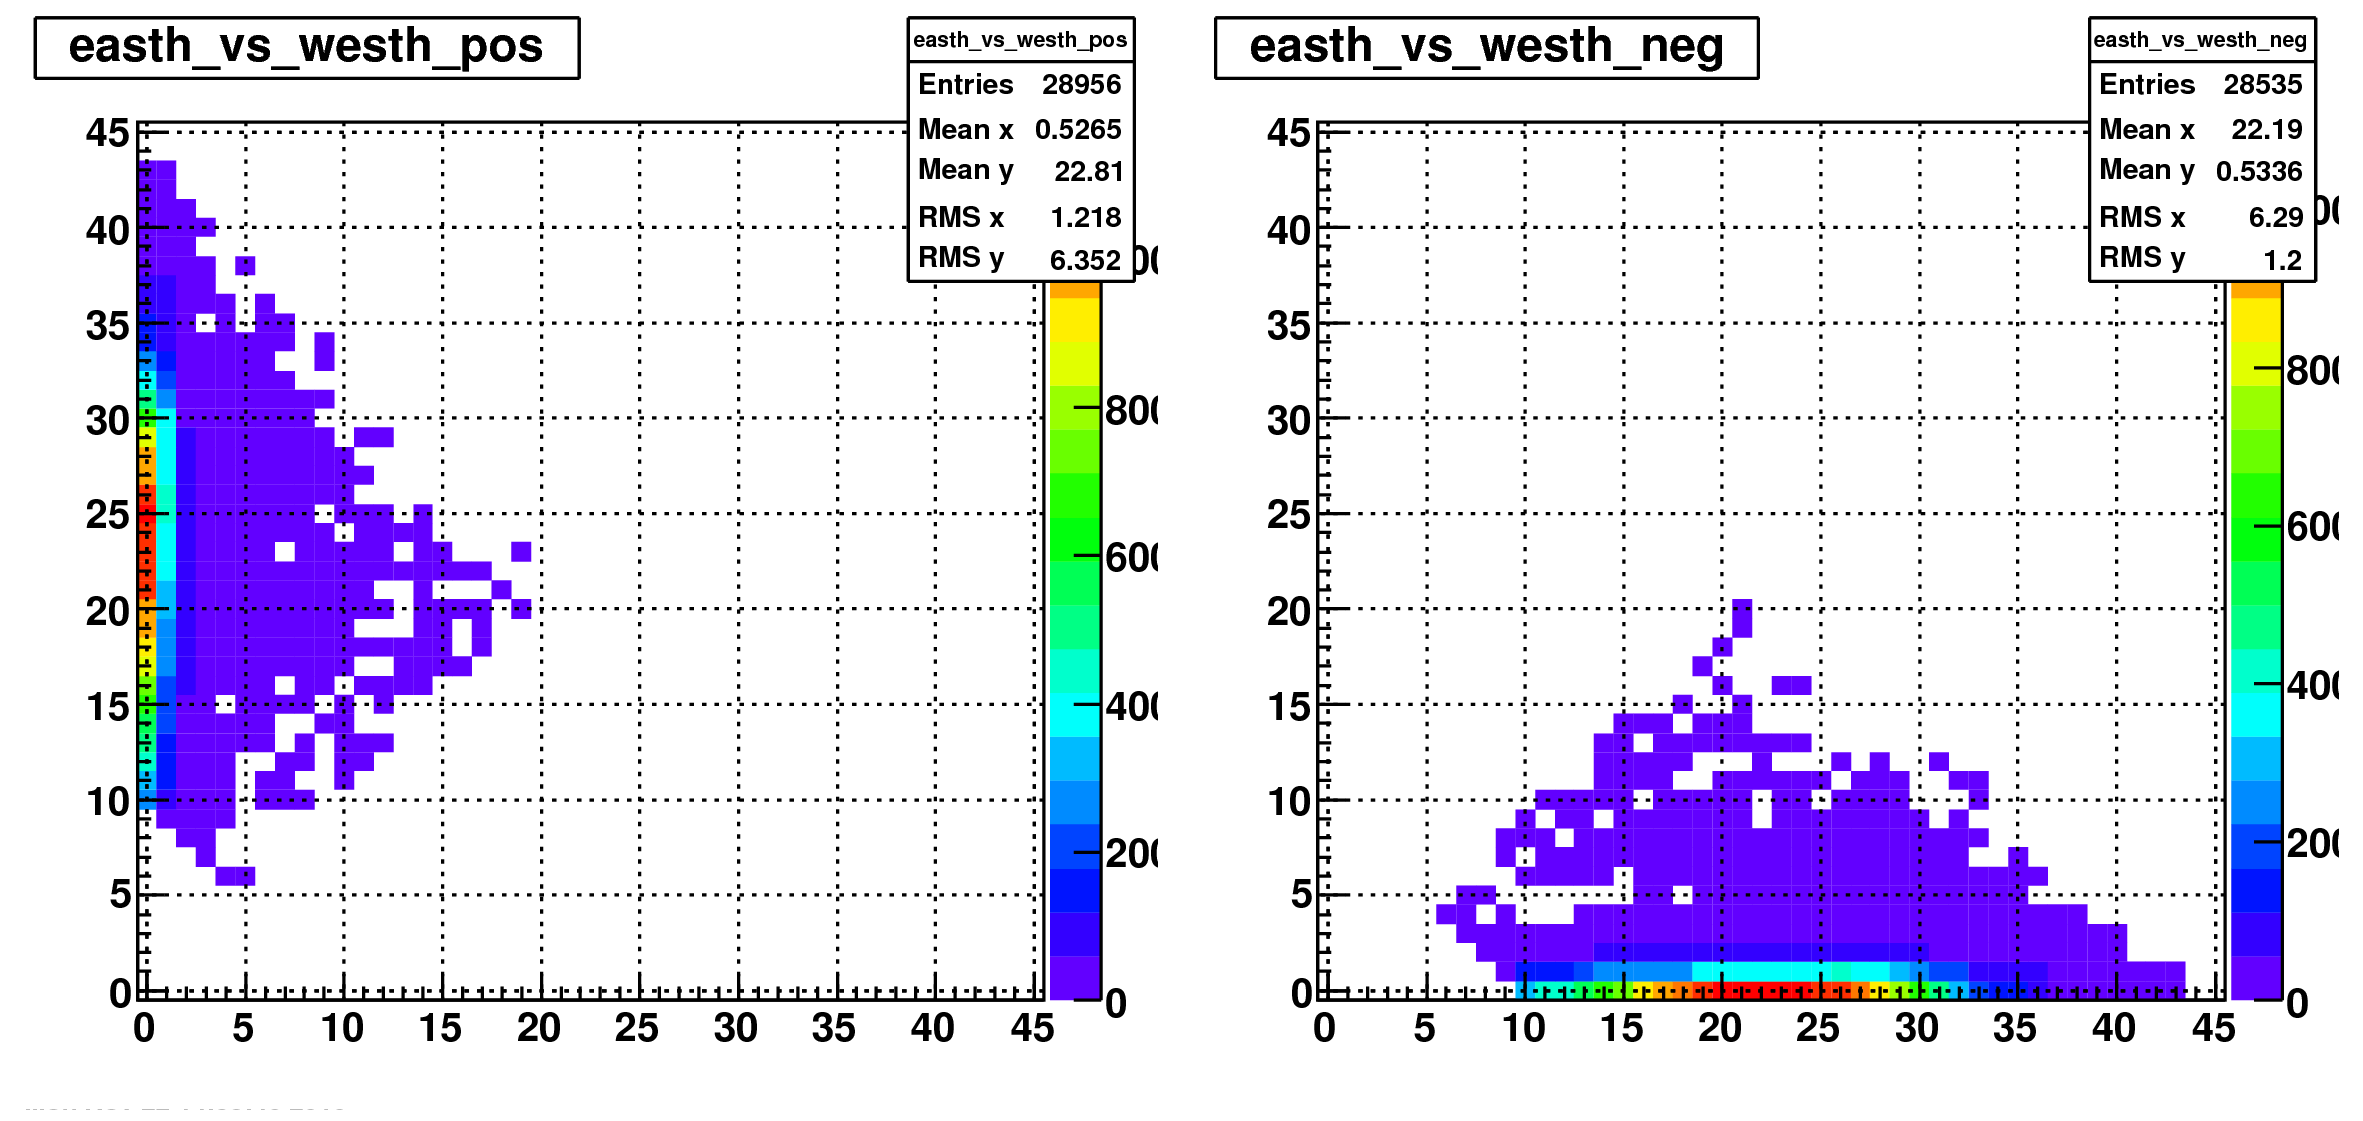
Next we ask how many of the tracks have a reasonable number of hit points associated with them on the opposite half of the TPC versus the pileup tracks which should really not have any hit points associate with them on the other side. In the following plot you can see this quantity (note that is a requirement that makes east hit points > west hit points in one half and the opposite in the other half). You see that there are many tracks that have no or very few hits points associated with them on the opposite side of the TPC and many that have hit points associated with them.

- seelej's blog
- Login or register to post comments
