- seelej's home page
- Posts
- 2011
- 2010
- December (2)
- November (3)
- October (3)
- September (3)
- June (2)
- May (3)
- April (2)
- February (9)
- January (1)
- 2009
- December (1)
- October (3)
- September (4)
- August (1)
- July (1)
- June (6)
- May (1)
- April (4)
- March (5)
- February (1)
- January (4)
- 2008
- My blog
- Post new blog entry
- All blogs
A resolution to the "dip" problem in pp500
Spurred on by my study of central membrane crossing tracks (http://drupal.star.bnl.gov/STAR/blog/seelej/2010/nov/22/some-tpc-studies-pp500) I formulated a new working hypothesis, that the dip in the eta spectrum is not actually the problem, the two peaks are the problem and that they are due to pileup. This basically arises from the fact that the central membrane is a very efficient rejector of pileup even when using very simple tracking cuts like number of track hits or requiring a hit beyond a certain radius in the TPC. In order to investigate this lets look at two ensembles of data
1) Trigger ensemble : All global TPC tracks that have a 3d dca < 3cm to the vertex with the high rank (while simultaneously requiring > 5 tracks associated with vertex and 5 hits associated in the BEMC).
2) Pileup ensemble : All other global TPC tracks in the event that have a 3d dca < 3cm to the beamline and that also have a 3d dca > 3cm from the vertex used for the trigger tracks definition.
Because of the sheer volume and homogeneity of pileup in the pp500 data set it expected that there is a large amount of pileup in the trigger ensemble. Also it is expected that the pileup ensemble is to a large degree only pileup tracks (and we will assume it is 100% pileup for this analysis). Let us first look at the eta distribution for the trigger ensemble.
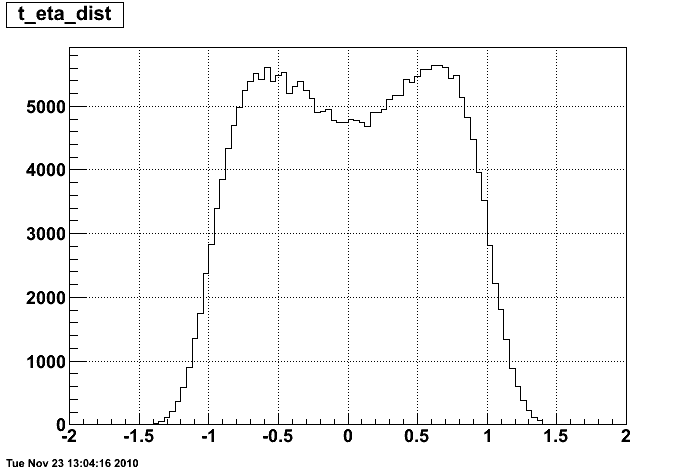
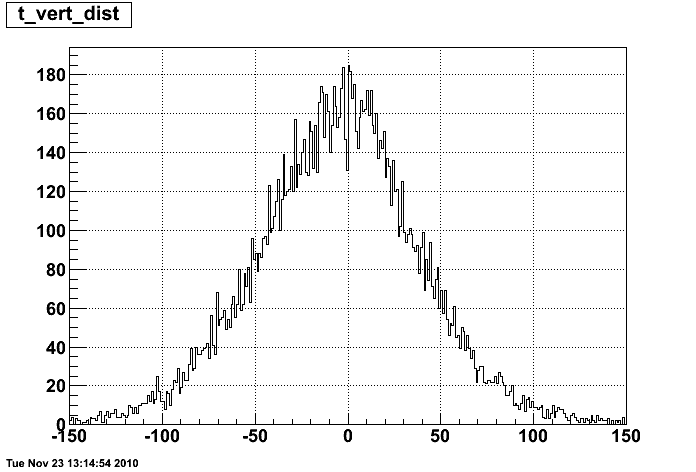
Now in order to have quantities that are on the same footing for the two ensembles we need to do a "running window" binning for the pileup ensemble since we are taking all tracks that are within 3cm for the trigger ensemble. Here is a 2d histogram of eta vs. "vertex-z" for the pileup ensemble. What is done is that for each track in the pileup ensemble, it is put in 7 z bins (one for the z of its closest approach to the beamline, and 3 for the [-1,-2,-3]cm from the closest z and then 3 for [+1,+2,+3]cm from the closest) and in the appropriate eta bin.
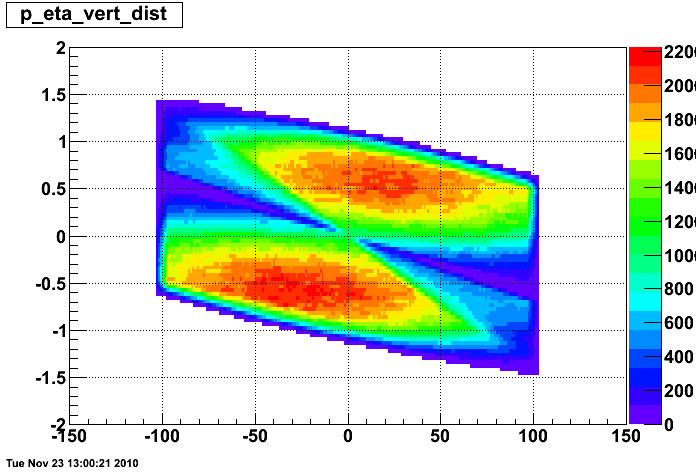
Features of this histogram should look familiar from Justin's studies (http://drupal.star.bnl.gov/STAR/blog/stevens4/2010/jun/07/more-tpc-distributions-l2w-stream-sl09g). If we then scale by the number of events this corresponds to and project on two axis we can get a feel for what the distribution looks like.
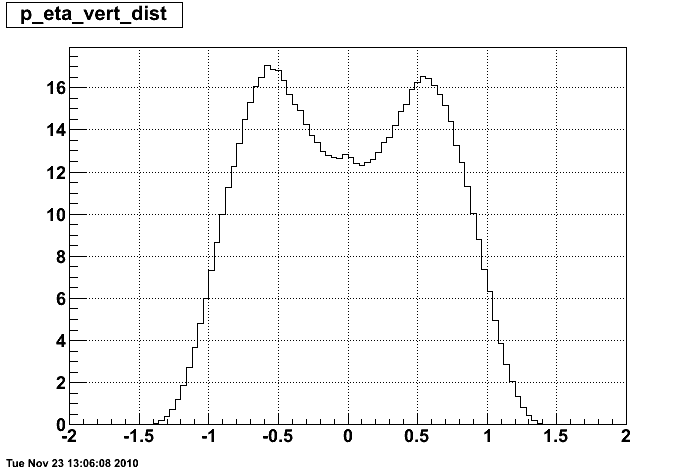
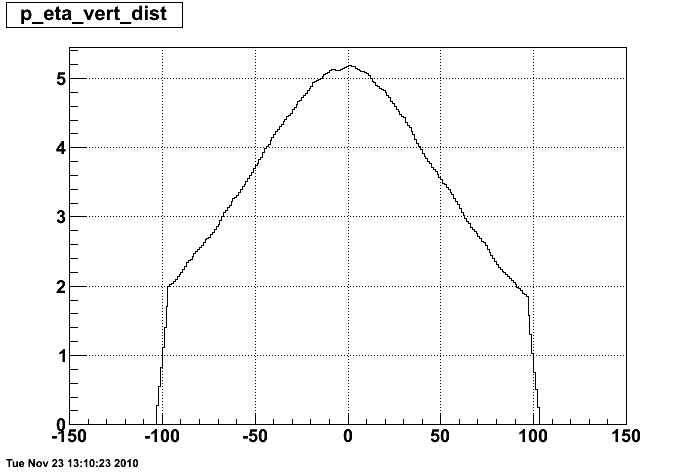
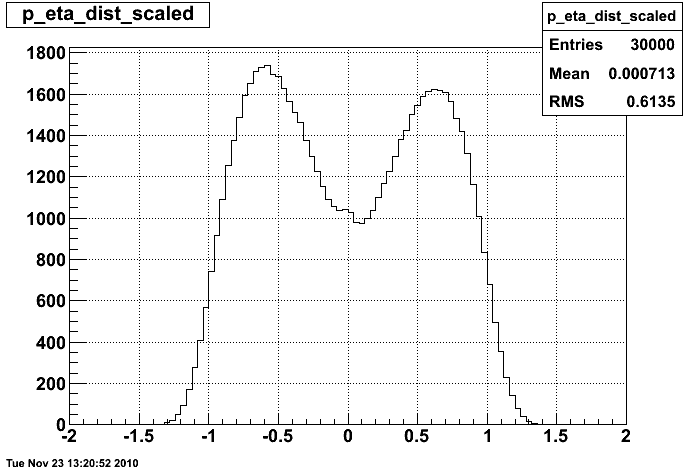
The main feature you should pick out from the above two plots is that the dip at eta is much more severe in the pileup ensemble than in the trigger ensemble. This is expected due to the natural pileup rejection capabilities of having a central membrane.
We can then use this pileup ensemble data set and formulate the correct histogram to subtract from the trigger ensemble to get the "corrected" histogram. Using the 2d histogram from the pileup ensemble, scaled by the 1/(number of events), we integrate along the "z-vertex" scaling it by the number of trigger vertices in that z-vertex bin to get the correct eta spectrum that we need to subtract from our trigger ensemble. The integrated eta spectrum is the following histogram.
And the subtracting this histogram from the trigger ensemble eta distribution we get
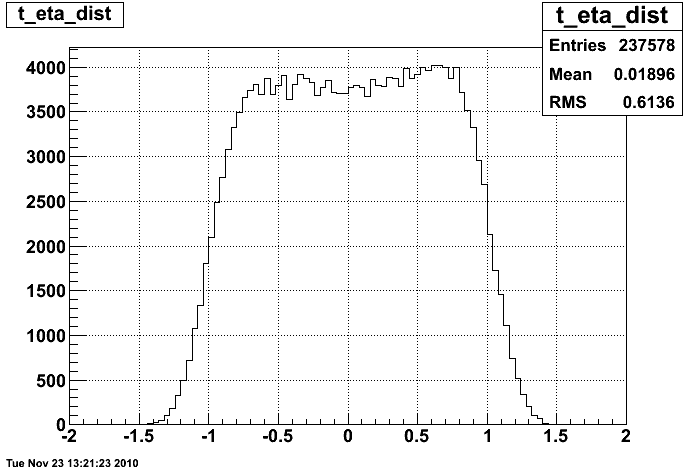
And we get something which is approximately flat in eta which is what we expect for our physics distribution. Note that this is only a rough calculation at the moment (was a late night of thinking) and there are details to be worked out (calculating the number of events properly and properly defining the trigger and pileup windows). But regardless of that, I think the above histogram shows us that there is nothing really wrong with our calibration or understanding of the TPC, just with our understanding and expectations for the pileup and more attention should be paid to how we treat it because it doesn't look like the simple rejection schemes are really doing what we thought they should.
Update : I've added the 1/R distributions at the central membrane as well so that you can see the effect that this same analysis has on that distribution. There are three histograms below. The left one is the trigger ensemble 1/R dist, the middle is the scaled pileup ensemble dist, and the right is the trigger ensemble with the scaled pileup ensemble subtracted from it.

Update (12/1/2010) - Justin asked to see the luminosity dependence of the "double peaks" in the data I was looking at. Here are three images for three different luminosities (zdcx = 92k,121k,160k). The statistics aren't great so this isn't really a powerful set of plots except that the dip does look much worse in the highest luminosity one.
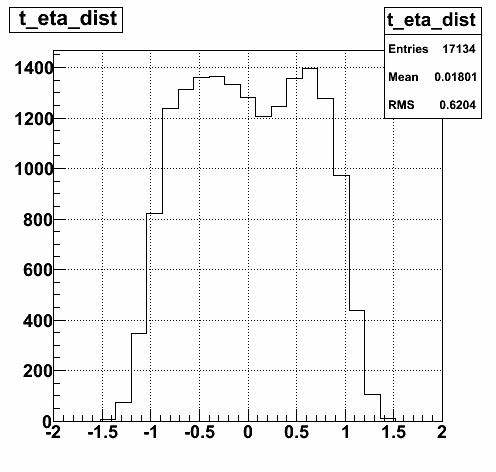
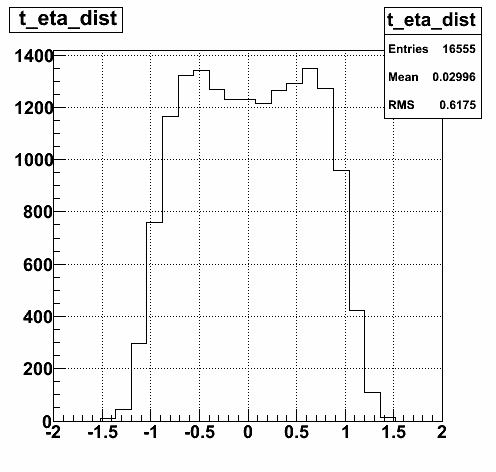
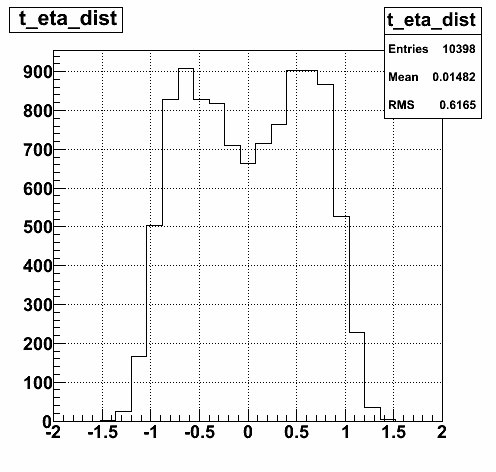
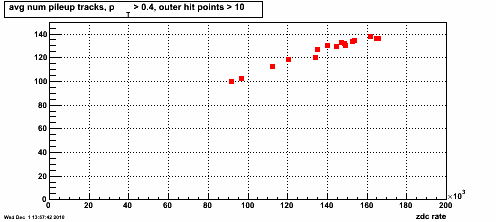
I also plotted the average number of pileup tracks in the TPC (with pT>0.4 and outer hits > 10) as a function of the zdcx rate so you get a feel for what we're looking at
Update (12/1/2010) - I added a simple BTOW matching and then re-ran the analysis to see that effect that had. And the dip is back. WTF.

But now that we are requiring BTOW things we really should be taking into account holes in the BTOW. So I ran a quick MC simulation with a map of towers that had bad status tables to get an idea of how this will affect this eta distribution and here is what I find.
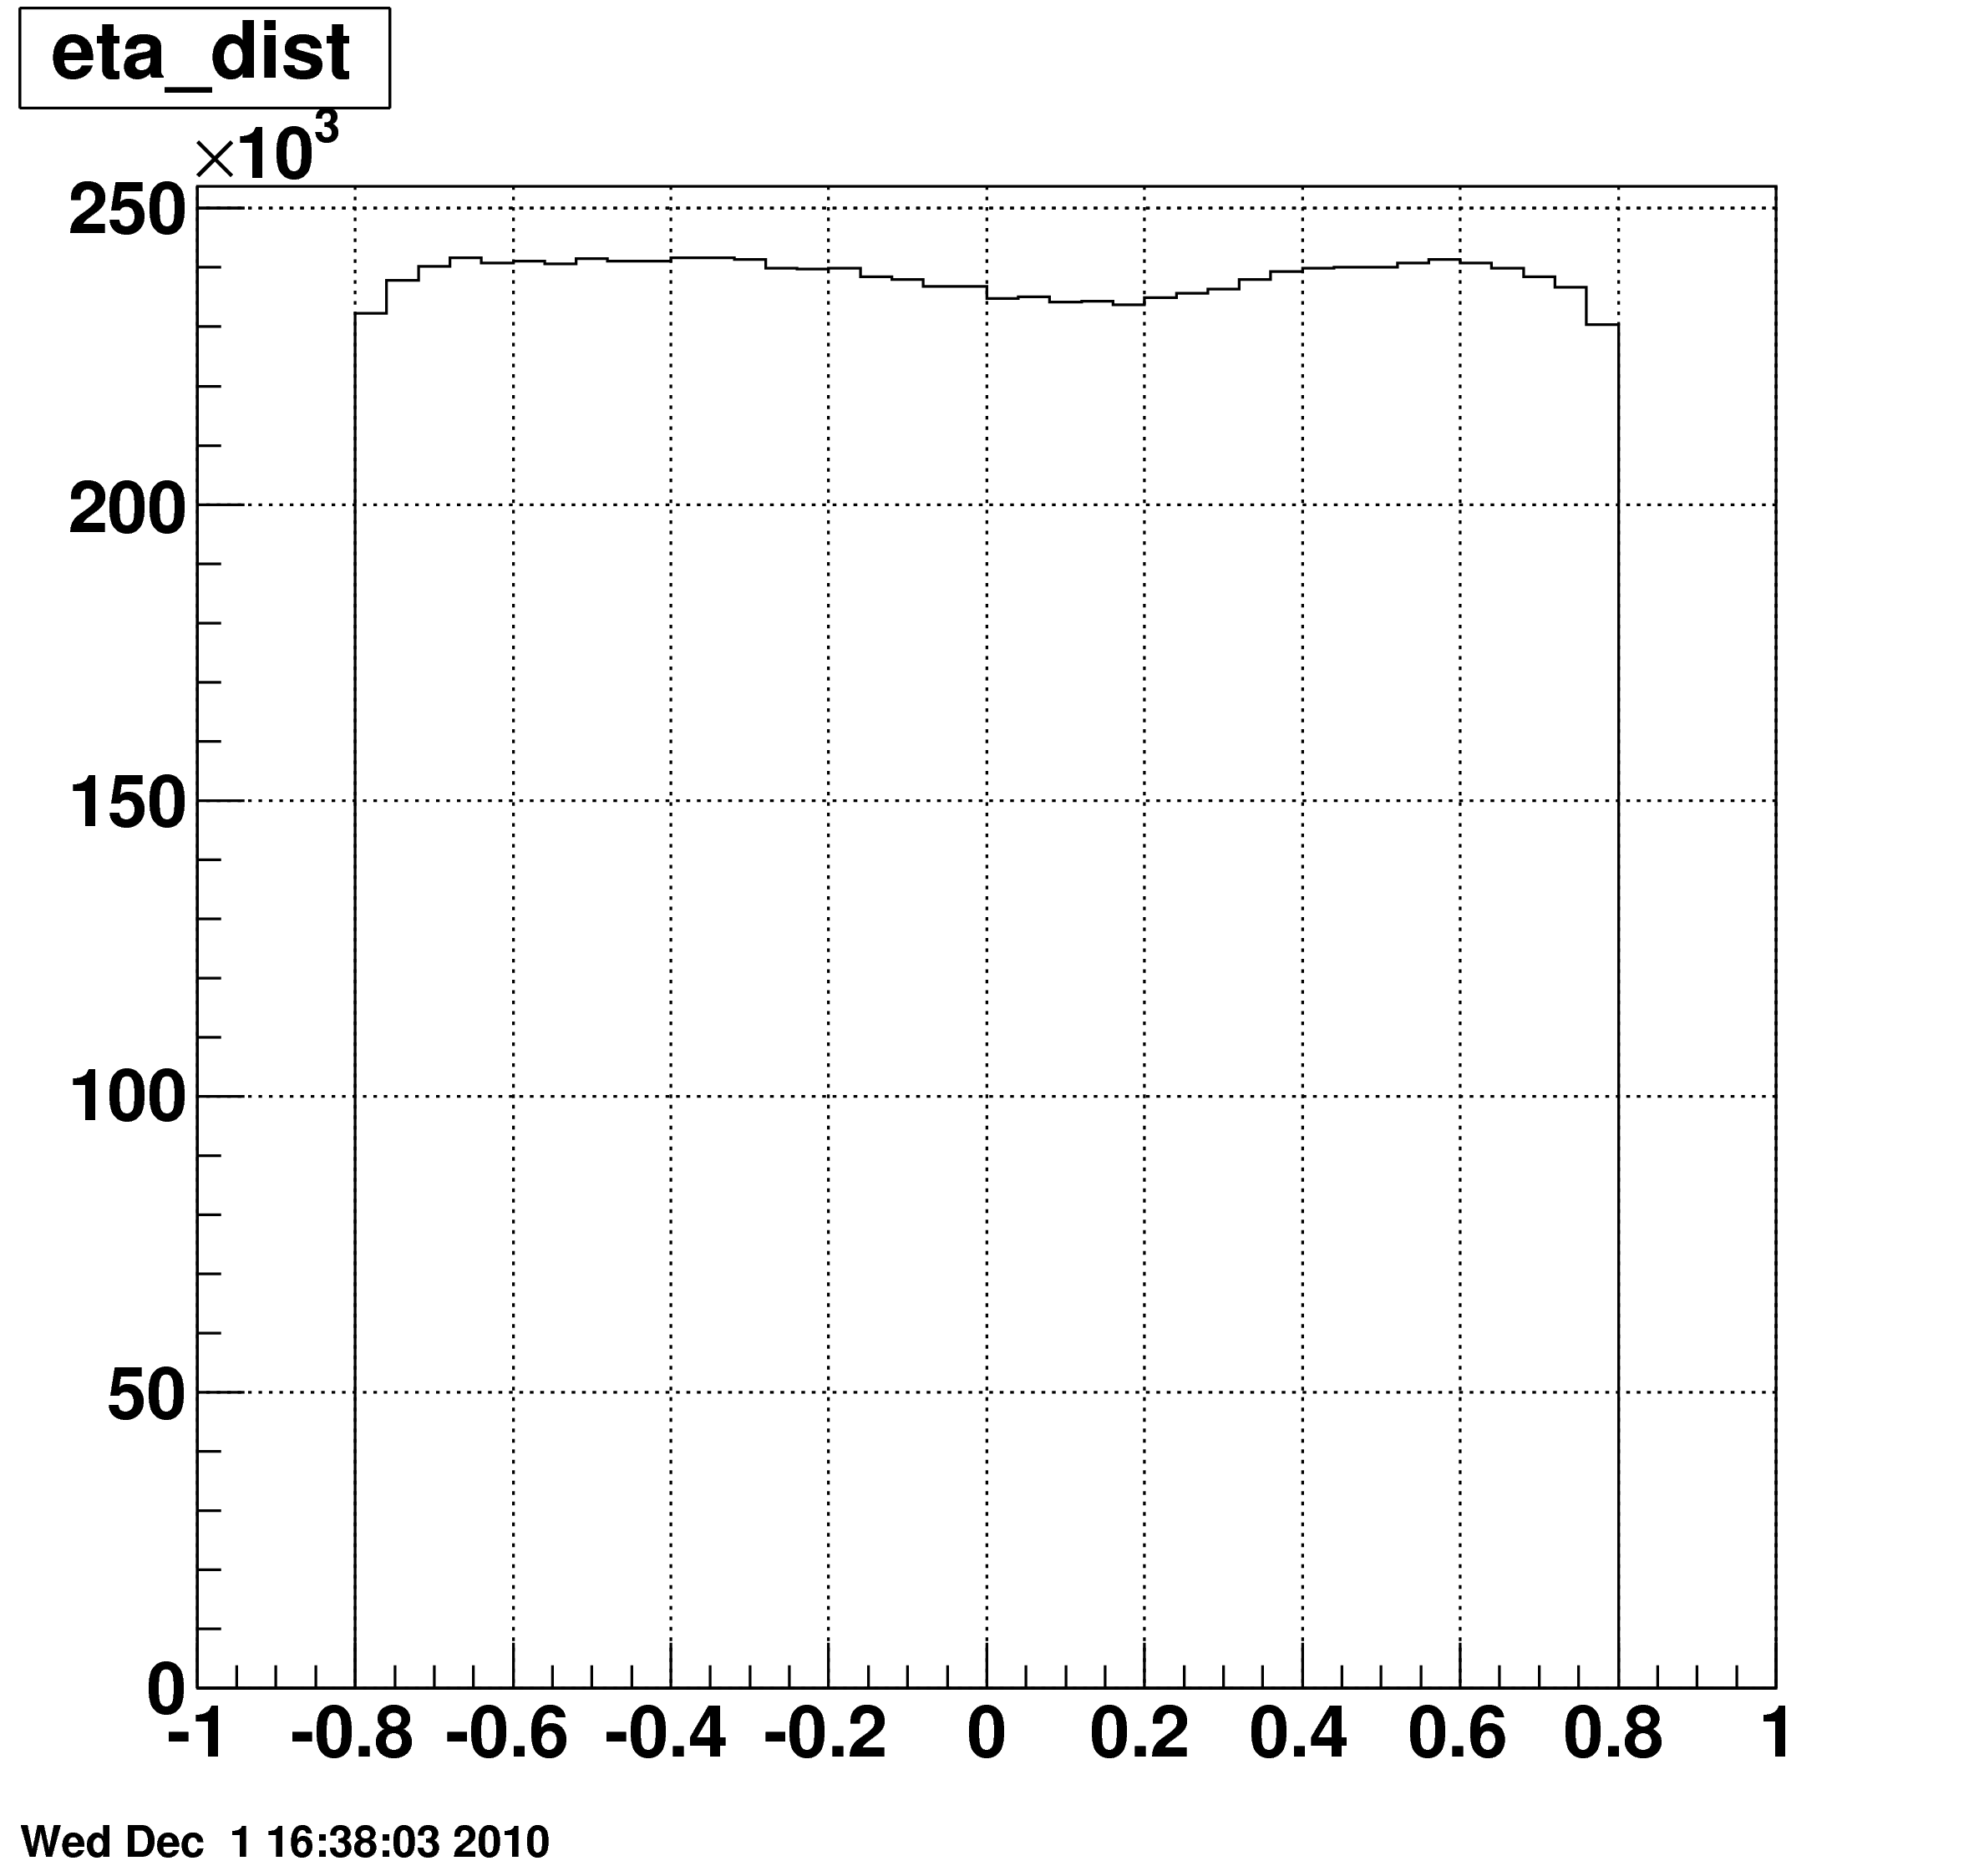
So it looks like part (maybe 5% of the total scale) of the dip is due to to the effects of bad towers in the BTOW that are killed the analysis. So a few steps forward, one backwards...
Update (12/1/2010) I then went ahead and normalized this distribution such that the largest bin is equal to 1 (a relative correction)
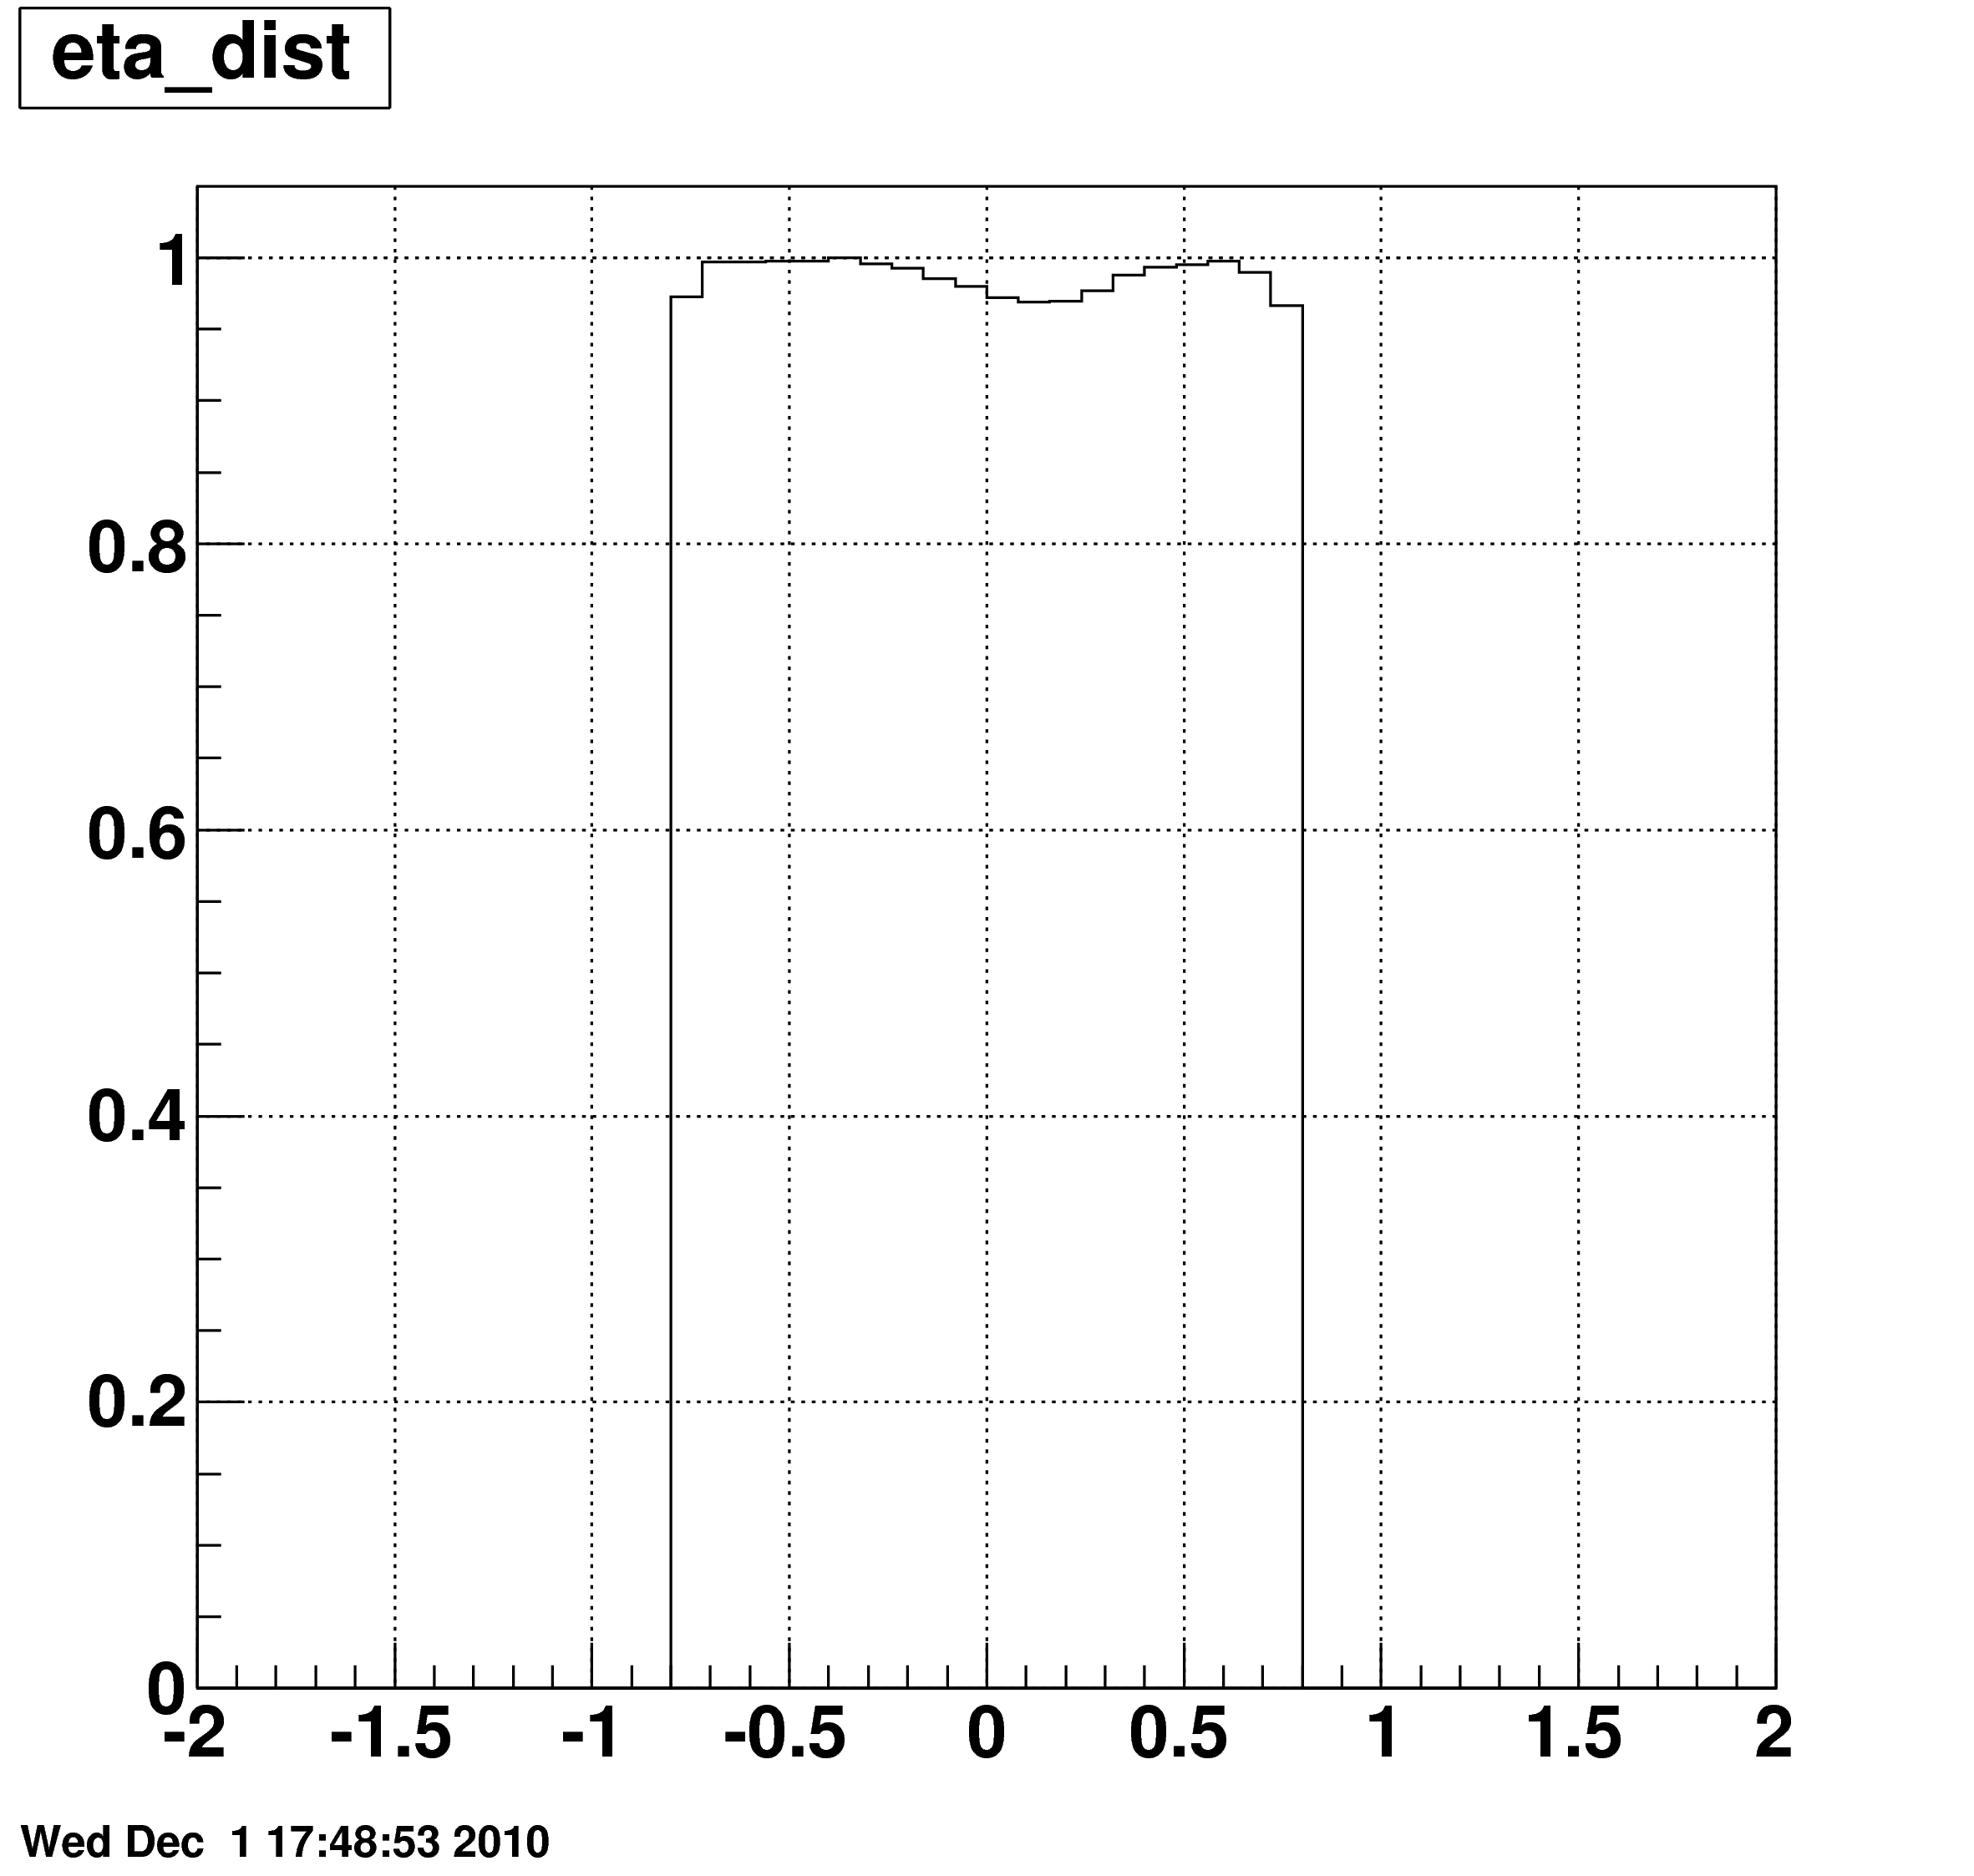
And then I correct the final subtracted spectrum in the eta distribution to see how this will look.

- seelej's blog
- Login or register to post comments
