- seelej's home page
- Posts
- 2011
- 2010
- December (2)
- November (3)
- October (3)
- September (3)
- June (2)
- May (3)
- April (2)
- February (9)
- January (1)
- 2009
- December (1)
- October (3)
- September (4)
- August (1)
- July (1)
- June (6)
- May (1)
- April (4)
- March (5)
- February (1)
- January (4)
- 2008
- My blog
- Post new blog entry
- All blogs
Shower Profiles for SMD and deposited energy at SMD layer
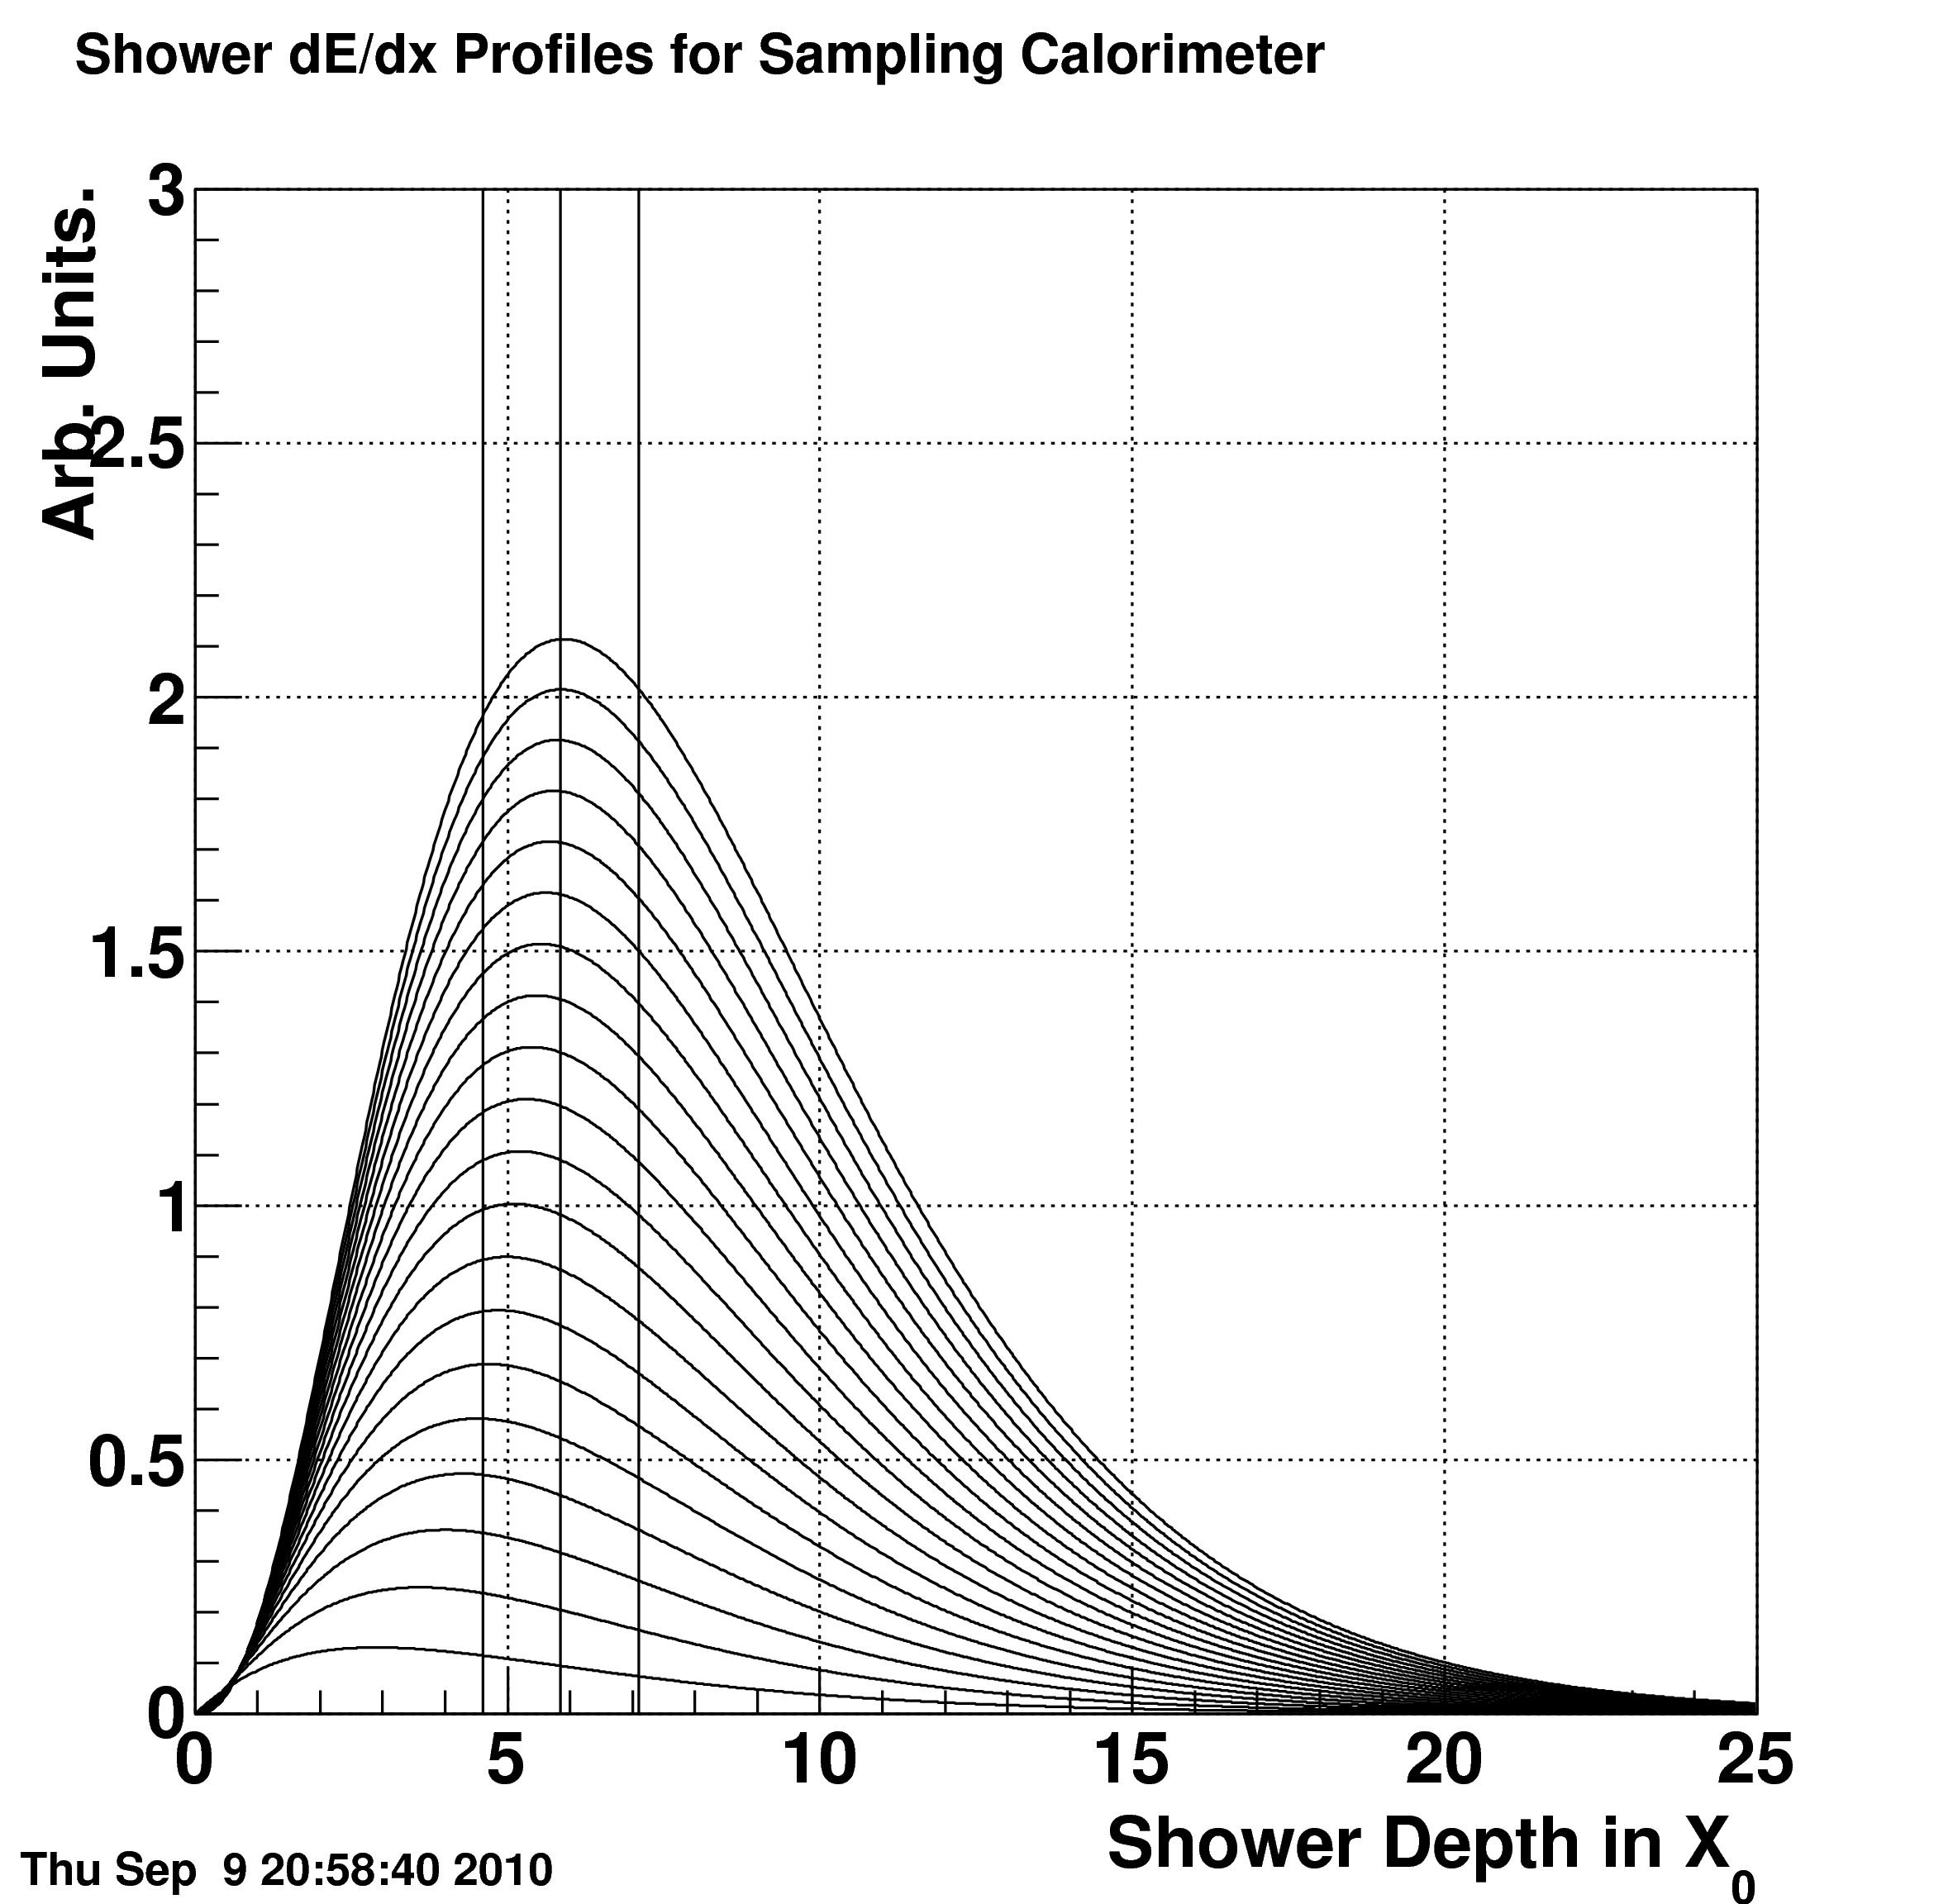
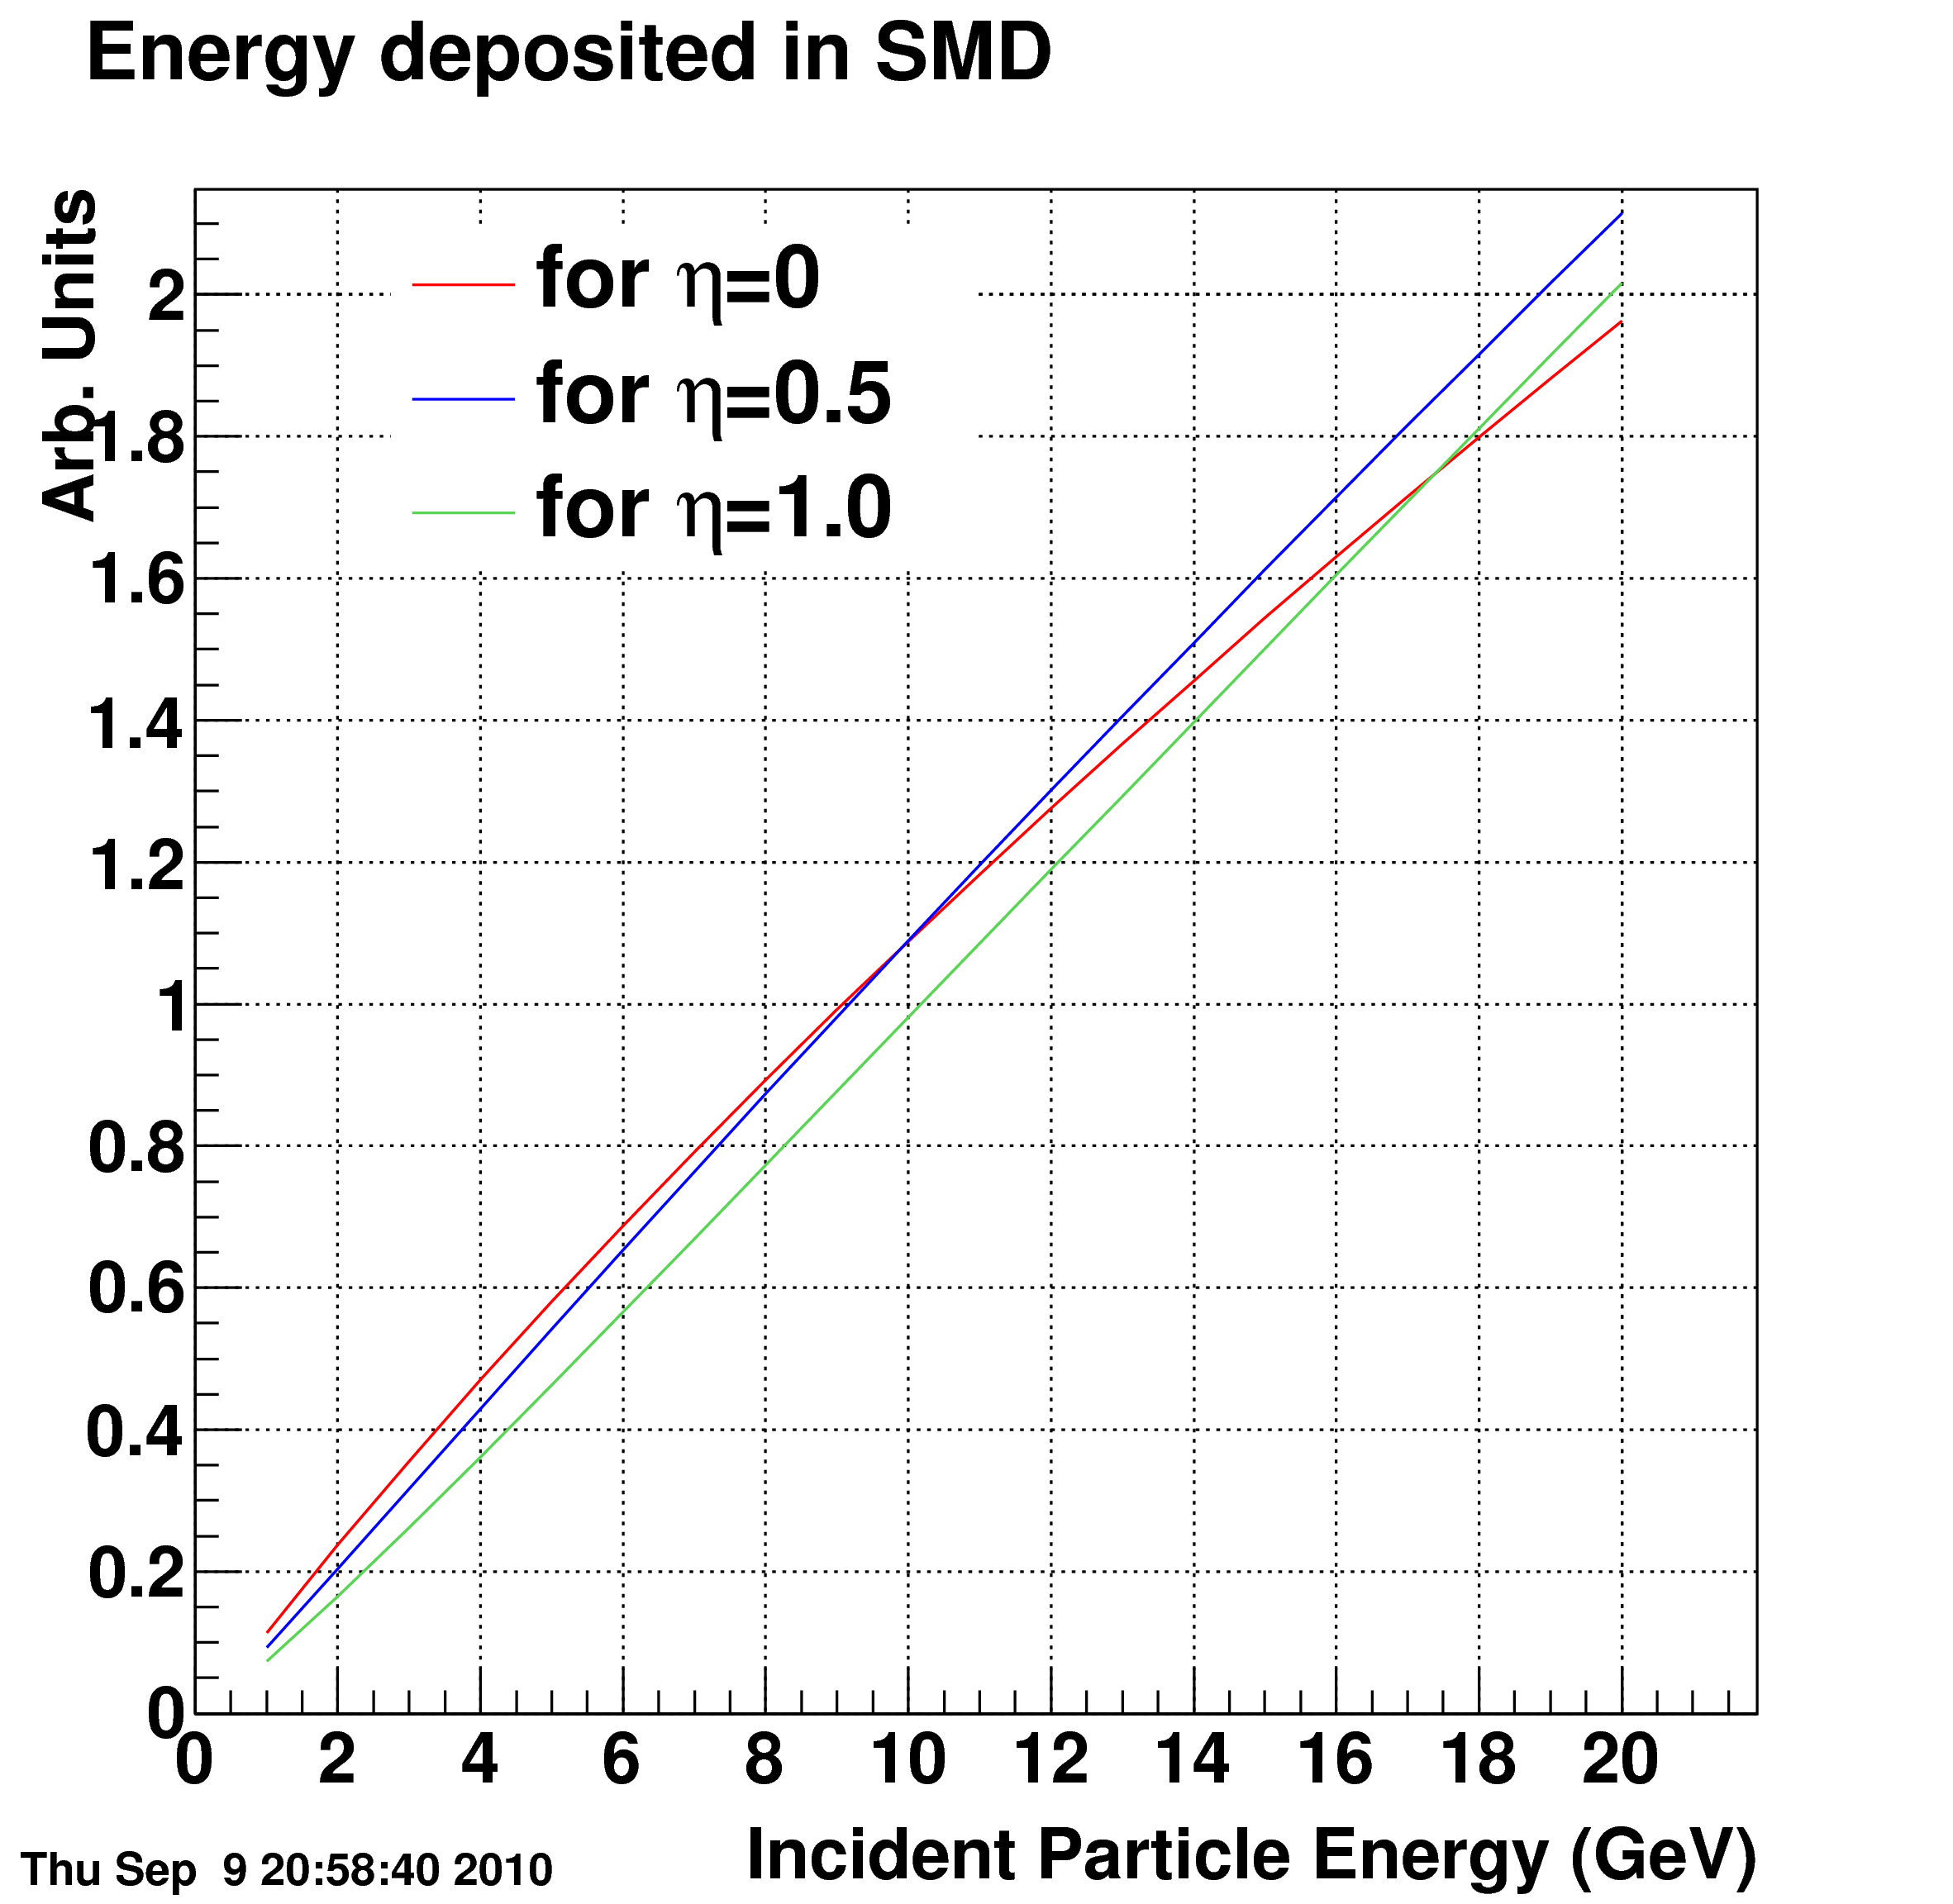
See the following two images.
The image on the left is a longitudinal shower profile for a sampling calorimeter with the configuration of the STAR BEMC. There are 20 curves corresponding to the incident particle energies {1,2,3,...,20}. The three vertical lines represent the SMD depth at eta = {0,0.5,1.0}.
The image on the right is the intercept of those vertical lines in the left plot with the 20 curves. You can see that at eta~0 you get a slight logarithmic dependence of the deposited energy versus incident particle energy. This behavior becomes more linear as you move out towards eta=1.
Groups:
- seelej's blog
- Login or register to post comments