Azimuthal Angle Studies
When using the simple ("Mickey Mouse") MC generator and y2006h geometry to produce single photons in a very small pT, eta and phi domain, a strange pattern was observed in the number of pairs meeting neutral pion cuts. The following are some plots to the related study. This was a combined effort of myself and Hal Spinka.
All data was generated with pT near 10 GeV and eta near 1.5. Data was generated with the narrow phi region centered in the central tower of each sector, as well as crossing sector boundaries. Each run consisted of 2000 events, genereated in a single, small, domain. Plots are seperated into those with just the points for the sector centers, and plots will all points generated. There are 6 types of plots presented:
- Number of pairs within neutral pion cuts, using the IU algorithm.
- Mean Energy (per phi location) of the total energy (per event) in the towers.
- Mean Energy (per phi location) of the total energy (per event) in each sector of the SMD (summed over u and v layers layers).
- Mean Energy (per phi location) of the total energy (per event) in the preshowers
- Number of events depositing non-zero energy in the preshowers
- Number of events depositing non-zero energy in the preshowers divided by the number of events with at least one reconstructed particle
Note: only plot type (1) is algorithm dependent. The rest represent basic data regarding the response of the EEMC.
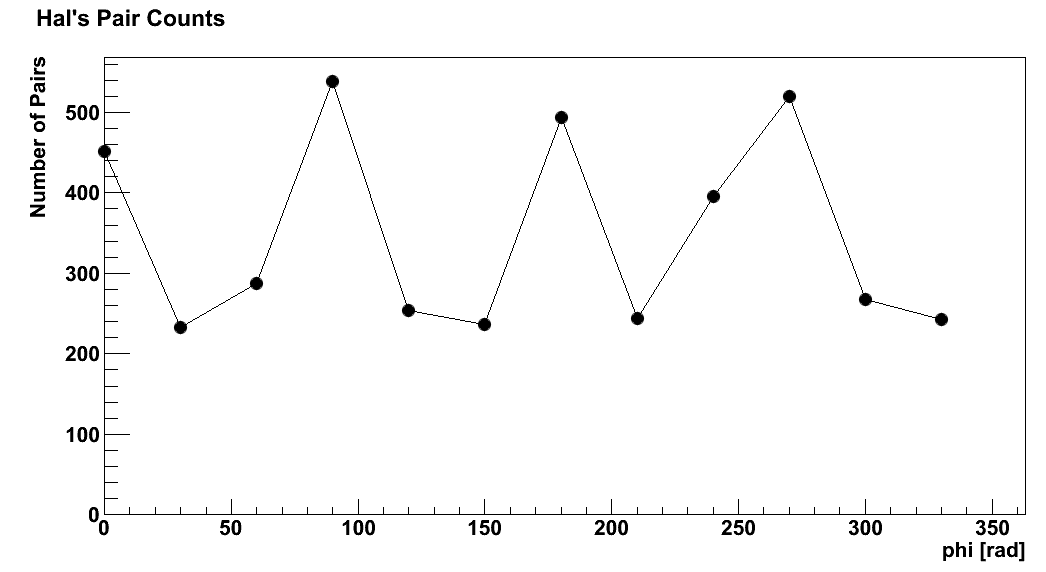
Fig. 1 Number of pairs within neutral pion cuts, using the IU algorithm, only sector centers
Note a strange cyclic pattern, in that there are more counts in the sectors corresponding to 0, 90, 180 and 270 degrees.
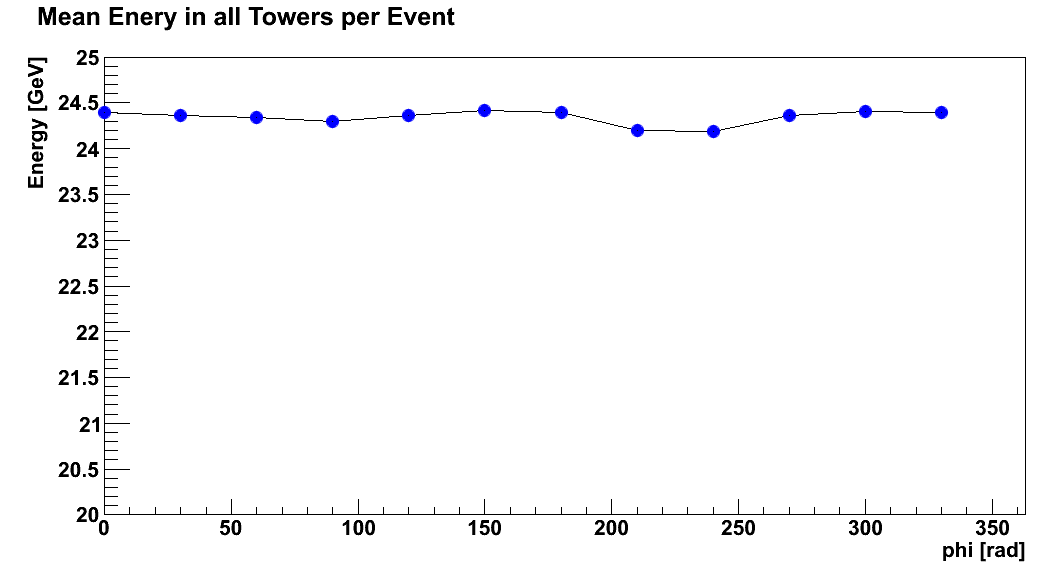
Fig. 2. Mean Energy (per phi location) of the total energy (per event) in the towers, only sector centers
While there is minor variation in the energy, the variation does not match the varation seen in the number of pairs.
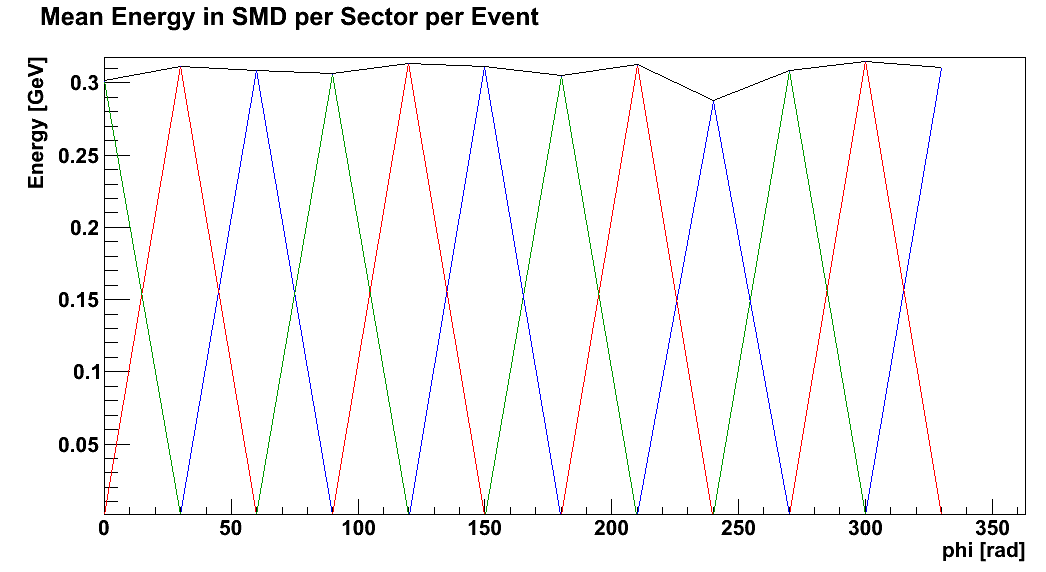
Fig. 3. Mean Energy (per phi location) of the total energy (per event) in each sector of the SMD (summed over u and v layers layers), only sector centers
Note: the energy in each sector is only non-zero when the generated particles are actually aimed at that sector. As this only happens once per sector in the above plot, the energy in each sector has a triangular shape. The black line represents the sum over all sectors. The variation seen here does not appear correlated with the variation in the number of pairs.
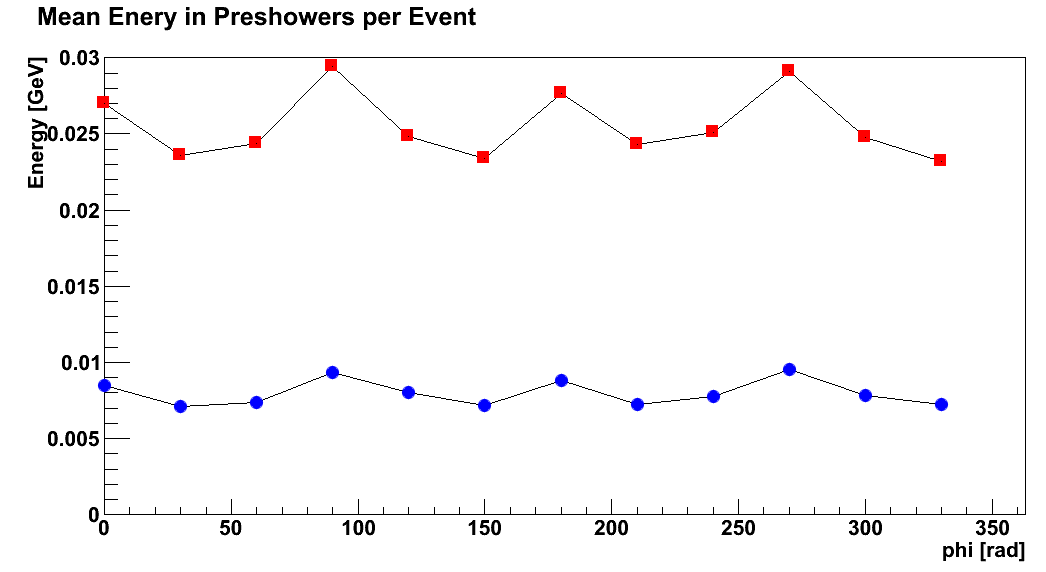
Fig. 4. Mean Energy (per phi location) of the total energy (per event) in the preshowers, only sector centers
Preshower 1 is shown with blue circles, preshower 2 with red squares. Preshower 2, as expected, has more energy deposited. Note, the cyclic pattern seen in the counts is again apperent in both the preshowers. The pattern is even more present here, as the number of pairs (Fig 1.) has the point near 240 abnormally high, which is not present here.
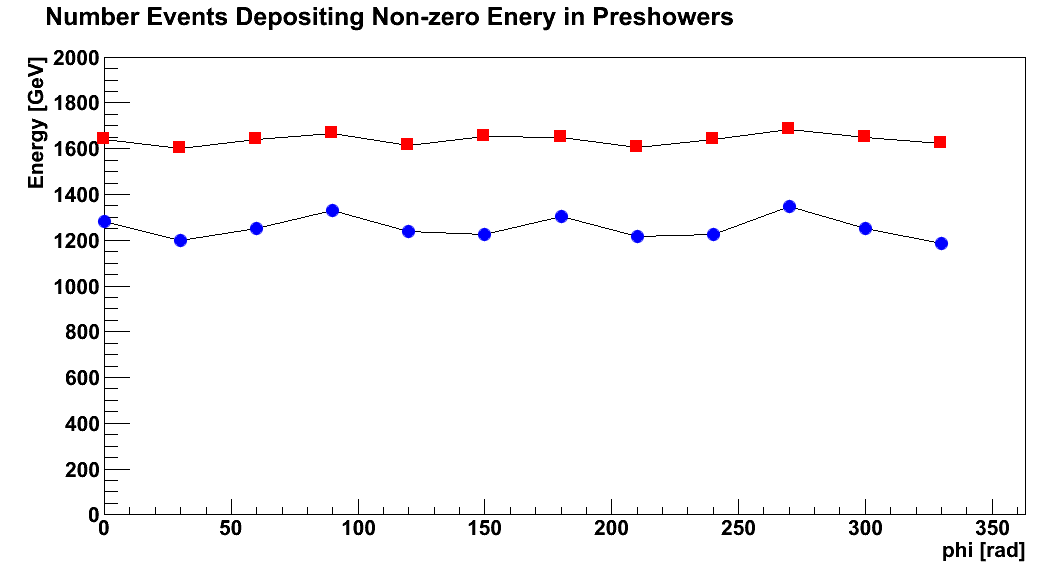
Fig. 5. Number of events depositing non-zero energy in the preshowers, only sector centers
Preshower 1 is shown with blue circles, preshower 2 with red squares. The message is the same as in Fig. 4. TYPO: the y axis is counts, not energy.
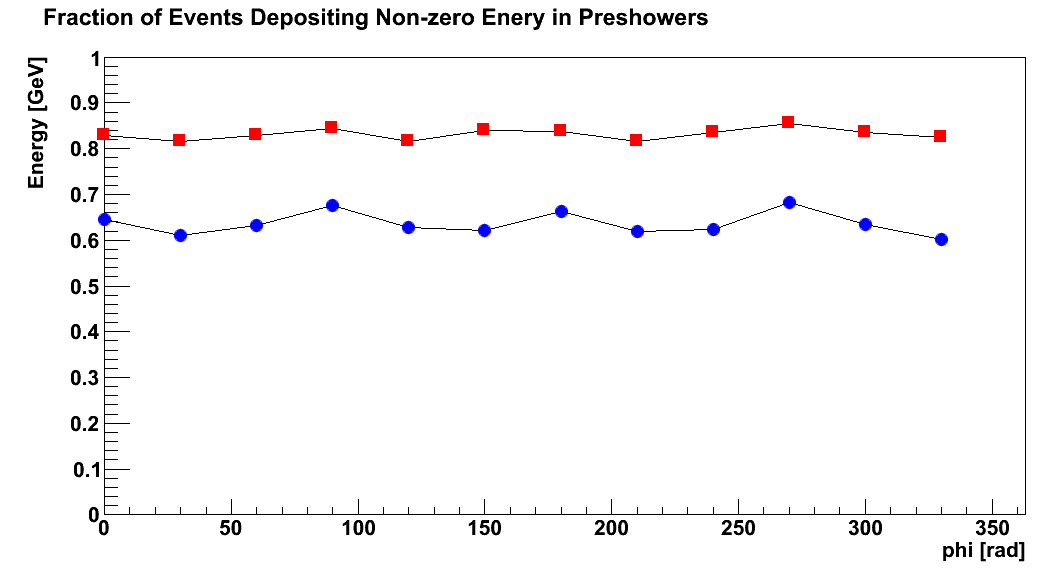
Fig. 6. Number of events depositing non-zero energy in the preshowers divided by the number of events with at least one reconstructed particle, only sector centers
Preshower 1 is shown with blue circles, preshower 2 with red squares. The message is the same as in Fig. 4. TYPO: the y axis is a ratio, not energy.
Commentary:
The towers and SMDs do not show any cyclic behavior, though both the preshowers do show the cyclic behavior. The preshower response supports the idea that the larger numbers of pairs found in every third sector are due to larger numbers of conversions in these sectors. This is most likely due to material differences upstream of the EEMC, but at present it is not known what the exact cause is.
The above plots are now reshown, including additional points crossing some of the sector boundaries at 1 degree steps.
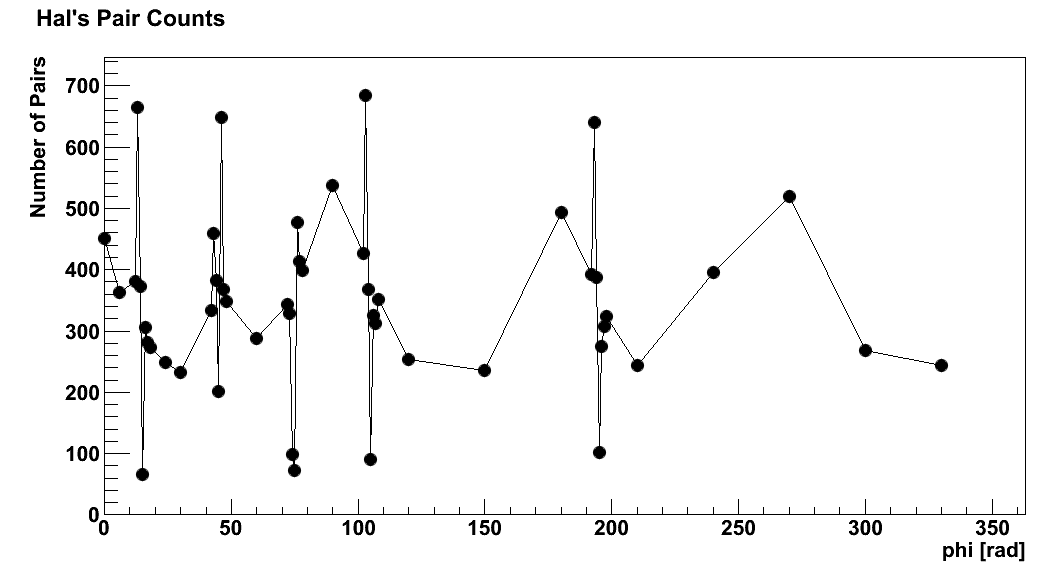
Fig. 7 Number of pairs within neutral pion cuts, using the IU algorithm, only sector centers
While it is expected the number of pairs would drop exactly between the sector boundaries, the single point high point near the sector boundary is somewhat unexpected. Note, in some cases the single high point is before the boundary, and in other cases it is after. This may be due to material effects but seems a little odd.
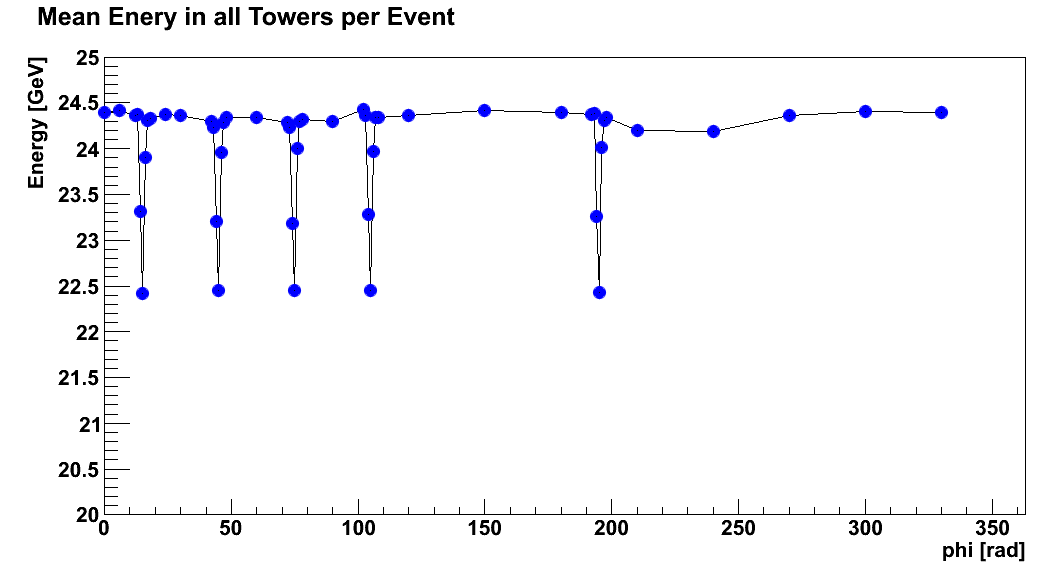
Fig. 2. Mean Energy (per phi location) of the total energy (per event) in the towers, including crossing a few sector boundaries
The total energy is less between sectors and varies fairly smoothly, as expected.
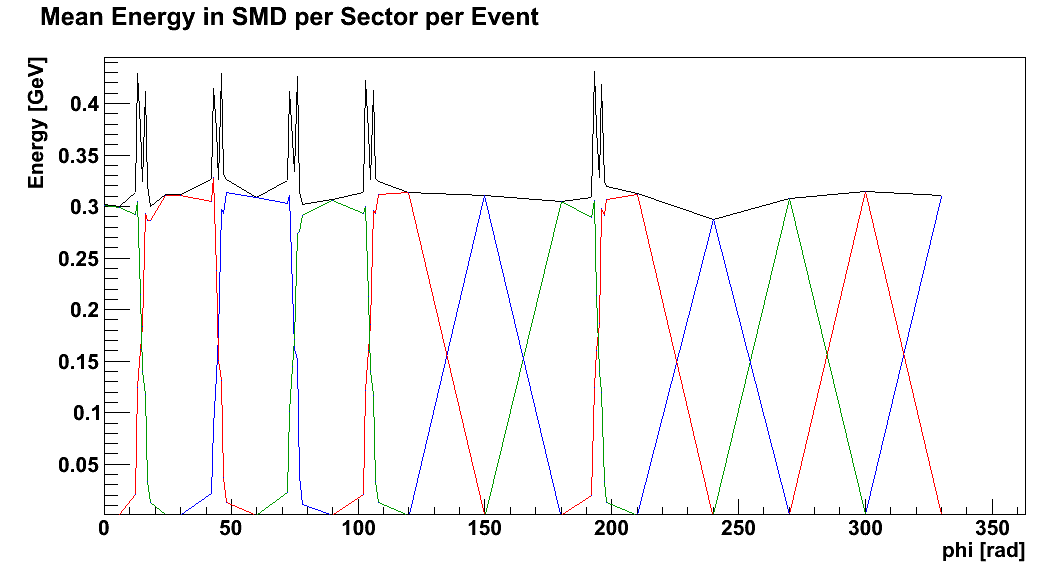
Fig. 3. Mean Energy (per phi location) of the total energy (per event) in each sector of the SMD (summed over u and v layers layers), including crossing a few sector boundaries
The total energy is less between sectors and varies fairly smoothly, as expected. Note, in the regions where the particles deposit energy in more than two layers, the total sum is significantly higher.
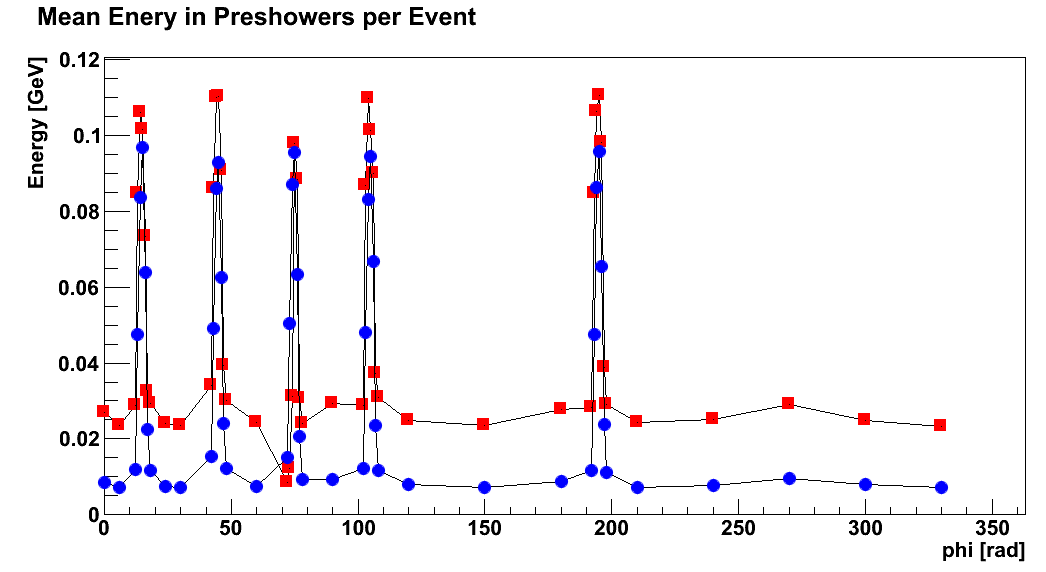
Fig. 4. Mean Energy (per phi location) of the total energy (per event) in the preshowers, including crossing a few sector boundaries
Near the sector boundaries, there is a lot more material in the TPC, and so there are a lot more conversions and in general, the showers start earlier.
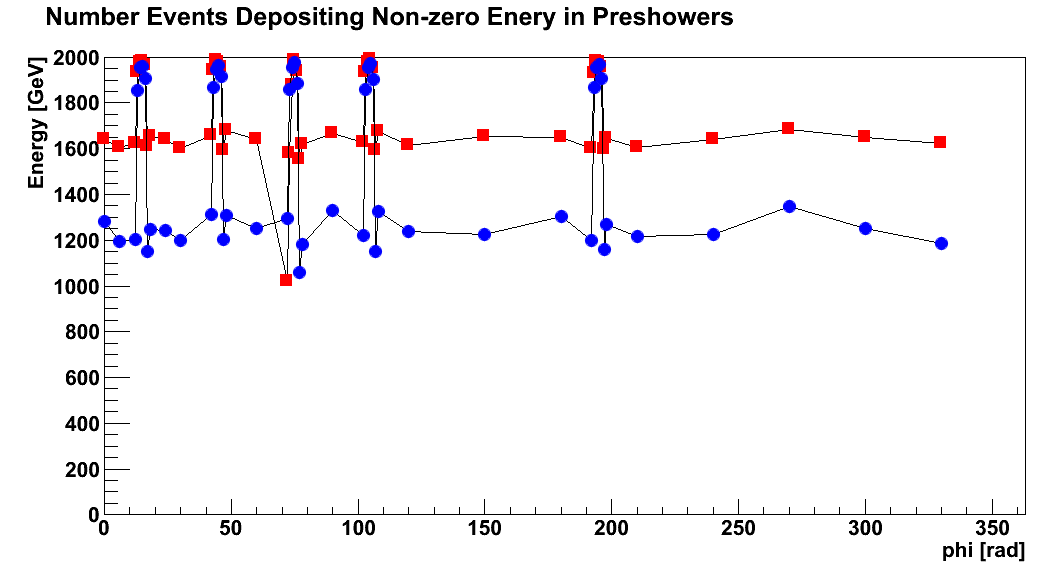
Fig. 5. Number of events depositing non-zero energy in the preshowers, including crossing a few sector boundaries
Near the sector boundaries, almost every event deposits energy in the preshowers. It seems a preshower near 60 degrees is not functioning. TYPO: the y axis is counts, not energy.
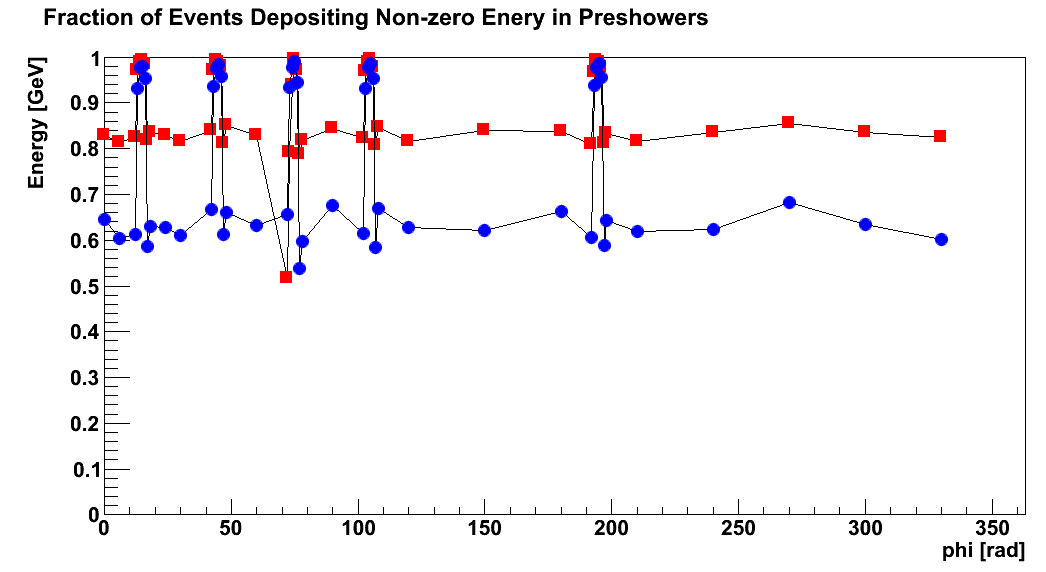
Fig. 6. Number of events depositing non-zero energy in the preshowers divided by the number of events with at least one reconstructed particle, including crossing a few sector boundaries
Same messages as Fig. 5: near the sector boundaries, almost every event deposits energy in the preshowers. TYPO: the y axis is a ratio of counts, not energy.
Commentary:
It seems the variation in counts is also likely due to differences in material, but the preshowers, towers, and SMD do not show any indication why there should be one high point in the number of pairs near each sector boundary.
- sgliske's blog
- Login or register to post comments
