Au+Au 27GeV EPD Calibration - Initial
Summary
This blog details the current state of calibration for the Au+Au, 27 GeV run of 2018. Please see drupal.star.bnl.gov/STAR/blog/skk317/epd-calibration-isobar-final for details on the process used as what I've done here is identical. Right now, I am at step 6; I have generated the X2/Ndf plots and some of them have significant disparities. It seems that most of these come from sections of tiles that are disparate from the rest of the tiles within a supersector (detailed below). All ADC peak values have been visually reviewed for the day range (days 142-150, 155-163) and found to be reasonable fits for the data. I expect that we'll mostly arrange the aberrant supersectors in groups of ADC values, as with similar issues in the last calibration process.
Work Done Thus Far
I have generated histograms for ADC vs counts per tile for the picoDST data on the 2018, Au+Au, 27 GeV run for days 142-150 and 155-163 (which are what I currently have available). These were then fit with a multi-Landau curve and the peak ADC position (with error) was extracted. These position values were then plotted by tile over the days aforementioned and an average generated along with a X2/Ndf value. The X2/Ndf values have been plotted per tile by supersector.
Here is an example of a few supersectors' X2/Ndf plots:
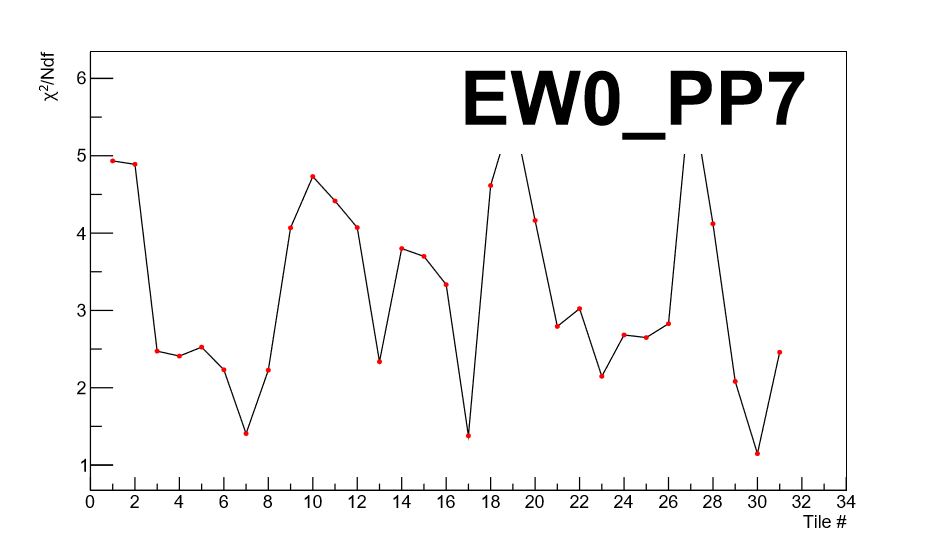
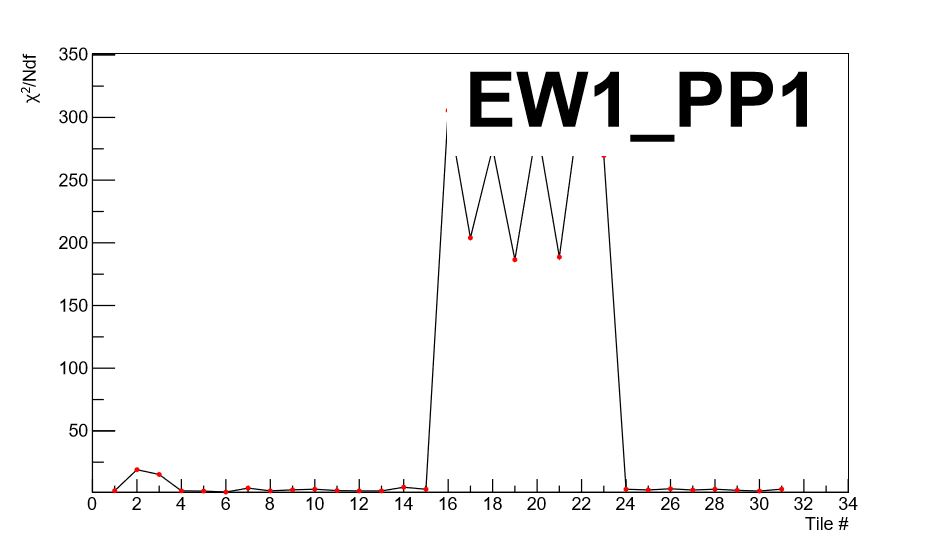
We can see that the fits for East supersector 7 are much better fits than for West supersector 1 (East is indicated by 0 and West by 1; so EW0 is East and EW1 is West). We can further see that the nonconformity for West SS1 is mainly due to tiles 16-23.
Here is an ADC plot vs day for West SS1 TT16:
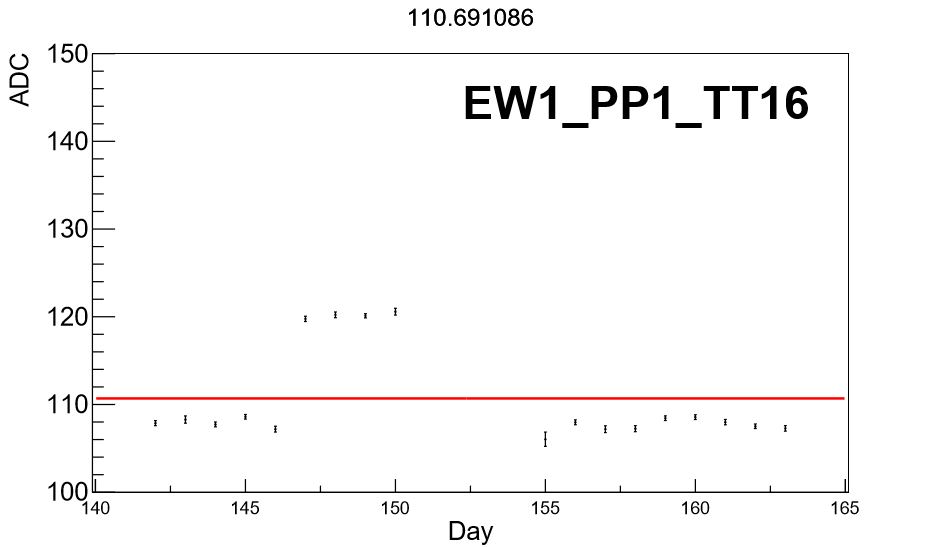
It can be readily seen that days 147-150 are a higher ADC position than the other days. I should think that we would get an average for these days, then an average for the others and use those two as our final values. This issue is prevalent in the following:
| Tiles | Days | Supersectors |
| 16-23 | 147-150 | West 01-04 |
| 06-09 | 147-150 | West 09-12 |

This phenomenon is emblematic of (anecdotally) most of the tiles. In many cases, it does not seem to overly effect the X2/Ndf values to the point of sticking out beyond the norm. I will be looking into this to see if perhaps the ADC fits are off for these tiles.
One last aberrancy is seemingly random distributions that are nonconformal. These do not have a particular day or a tile range with problems, but seem to just be off all over the place.
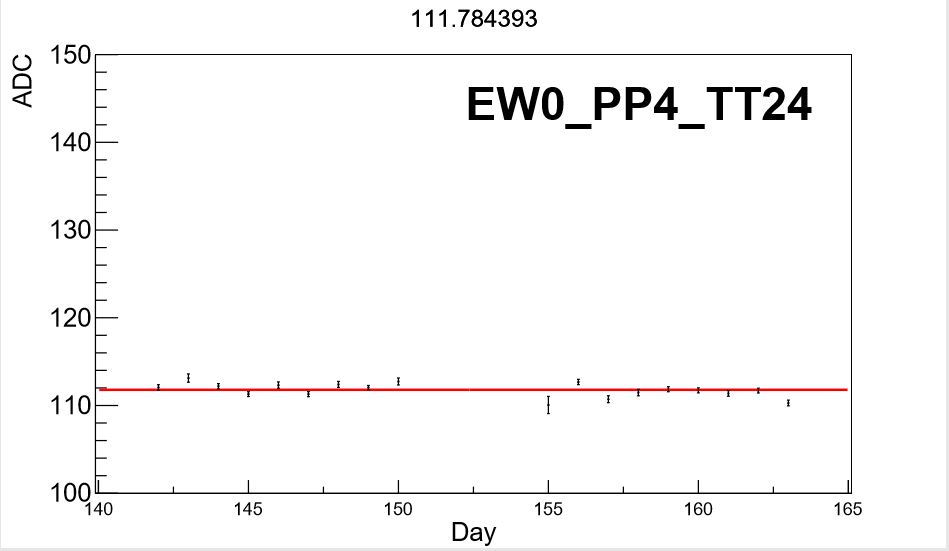
As an example, here's West PP08 TT22:

I don't see any trend here, so the best course of action may simply be to stick with the average value. It is concerning that we have such disparate values; I will be looking into this further as well to double check that the ADC Landau fits are accurate.
Next Steps
From here the next steps will be to look over every X2/Ndf that doesn't fit well and attempt to find an explanation. For tiles that have day ranges which differ, final values that fit various day ranges separately will probably be the best route. For randomly distributed nonconformities (such as the last graph; West PP08 TT22), should the values be an accurate reflection of the first peak ADC positions our only recourse might be to simply use the average value over all days.
Plots are attached.
- skk317's blog
- Login or register to post comments