Run 9 pp500 ETOW QA
Endcap Tower QA
Gain Study
The ETOW gains for pp500 had to be adjusted since the TCD phase was misset for this portion of Run 9. The new gains were determined by a study linked here. Since the timing was not optimal (not on stable flat-top), the gains are more sensitive to particle TOF, or other timing issues. For instance, in Figure 0 you see the particle path lenght difference for particles originating at zVertex of -100 and 100 (the range used in W-algo). The TOF difference between these paths r1 and r2 is ~6 ns for the eta ring near 2, and ~2.5 ns for the eta ring near 1 (Note: these are the maximum TOF differences). When the TCD phase is set correctly (in the flat-top region) we shouldn't be very sensitive to these time differences, but since the timing was not set optimally we need to check how stable the gains to these timing shifts. To study the gain stability, I looked at the energy distributions for 4 different Z vertex regions, to sample different particle TOF.
Figure 0: Diagram of particle flight path (It's pretty lame, but you get the idea)
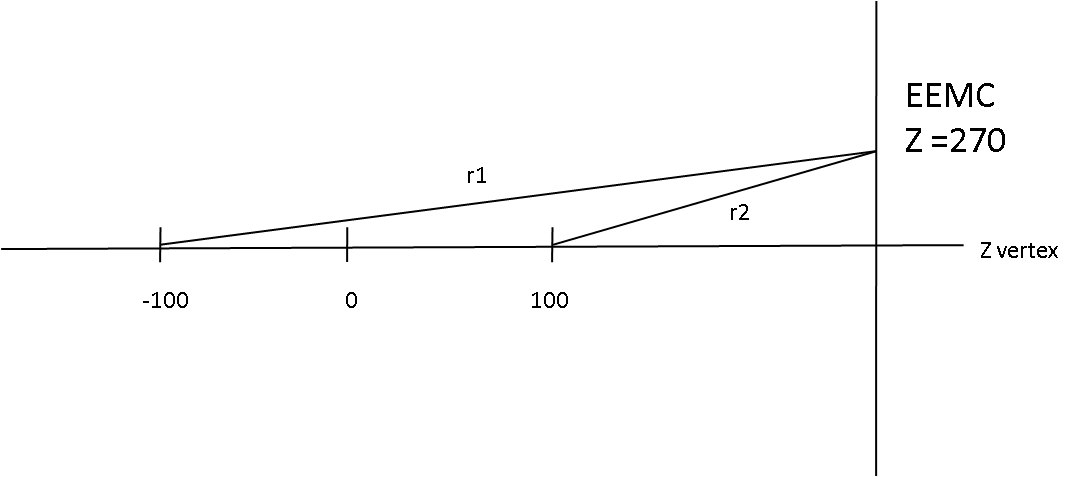
Figure 1: Energy distributions for 4 different Z vertex regions. Only Eta bin at eta~1.1 is shown.
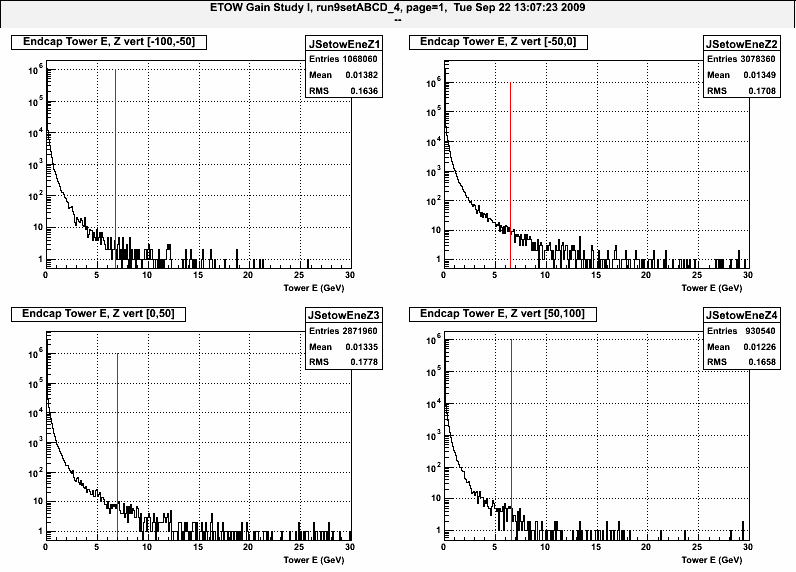
The red vertical lines are put where 0.01% of the counts (counting down in E). The table below gives the Tower energy where each fraction of the counts occurs.
| Z Vertex Range | 0.01% of counts | 0.03% of counts | 0.05% of counts |
| [-100,-50] | 6.8 GeV | 3.5 | 2.5 |
| [-50,0] | 6.5 GeV | 3.5 | 2.6 |
| [0,50] | 7.0 GeV | 3.6 | 2.6 |
| [50,100] | 6.6 GeV | 3.6 | 2.5 |
It is nice to see that the energy where X% of counts occurs is stable over different Z vertex regions.
Figure 2: All Z vertex regions shown (normalized using z-vertex yields). Again only Eta bin at eta~1.1 is shown.
.gif)
These 2 figures above give us an indication that the gains may not be that sensitive to timing issues near eta~1. The next figure looks at the same distributions farther forward in eta.
Figure 3: Energy distributions for 4 different Z vertex regions. Only Eta bin at eta~1.9 is shown.
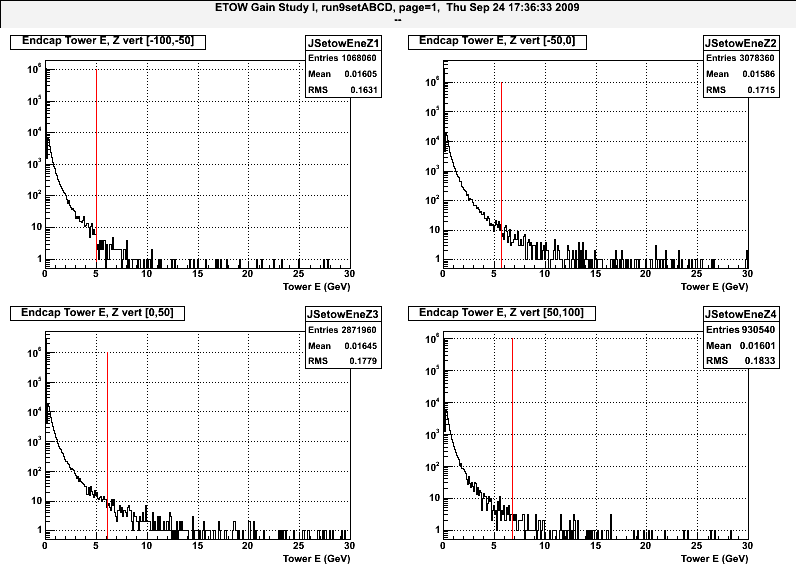
The red vertical lines are put where 0.01% of the counts (counting down in E). The table below gives the Tower energy where each fraction of the counts occurs.
| Z Vertex Range | 0.01% of counts | 0.03% of counts | 0.05% of counts |
| [-100,-50] | 5.0 GeV | 3.3 | 2.6 |
| [-50,0] | 5.7 GeV | 3.4 | 2.7 |
| [0,50] | 6.1 GeV | 3.5 | 2.8 |
| [50,100] | 6.8 GeV | 3.7 | 2.9 |
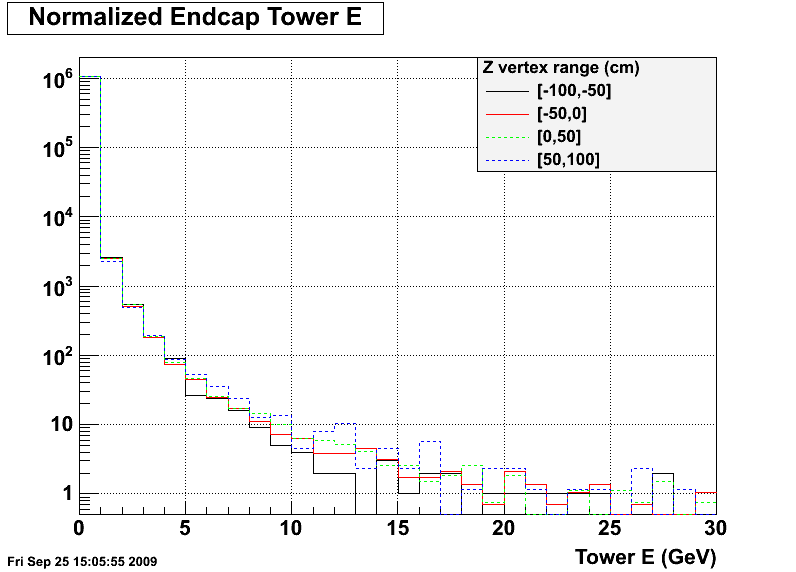
The effect should be larger at this eta ring near eta~1.9 since the particle TOF difference is the largest here. As we expect, moving from the farthest away to the closest in Z from the endcap the energy is increasing because the integration window should be getting closer to the flat top the closer in Z vertex you get to the endcap.
Figure 4: All Z vertex regions shown (normalized using z-vertex yields). Again only Eta bin at eta~1.9 is shown.
Tower Hit Frequency: Look at the rate towers are above some threshold to check for "hot spots." These histograms are filled at different points in the W-algo (check title for when it is filled). Compare to Poisson distribution of what we expect statistically for tower hit frequency if gains are well matched.
Figure 5: Look at endcap towers with E > 5 GeV distribution across detector and events. Filled before Near Jet veto in W-algo verB4.3.
Red=Poisson Distribution; Black=Data
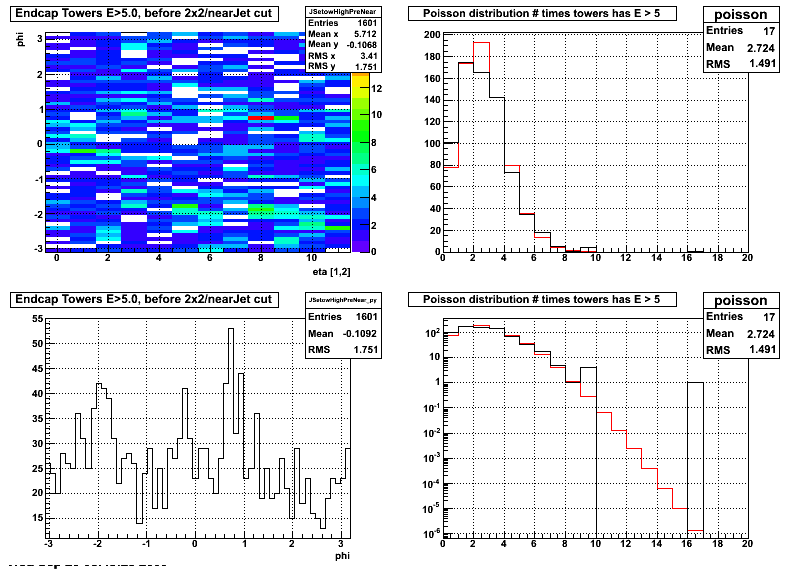
Poisson predictions and data points from distribution above:
Poisson = 77.9167 and data = 101
Poisson = 173.256 and data = 175
Poisson = 192.627 and data = 165
Poisson = 142.776 and data = 142
Poisson = 79.3697 and data = 73
Poisson = 35.2975 and data = 35
Poisson = 13.0813 and data = 18
Poisson = 4.15539 and data = 5
Poisson = 1.155 and data = 1
Poisson = 0.285363 and data = 4
Poisson = 0.0634535 and data = 0
Poisson = 0.0128269 and data = 0
Poisson = 0.00237684 and data = 0
Poisson = 0.000406551 and data = 0
Poisson = 6.45722e-05 and data = 0
Poisson = 9.57224e-06 and data = 0
Poisson = 1.33031e-06 and data = 1
Figure 6: Look at endcap towers with E > 5 GeV distribution across detector and events. Filled before Away Jet veto in W-algo verB4.3.
Red=Poisson Distribution; Black=Data
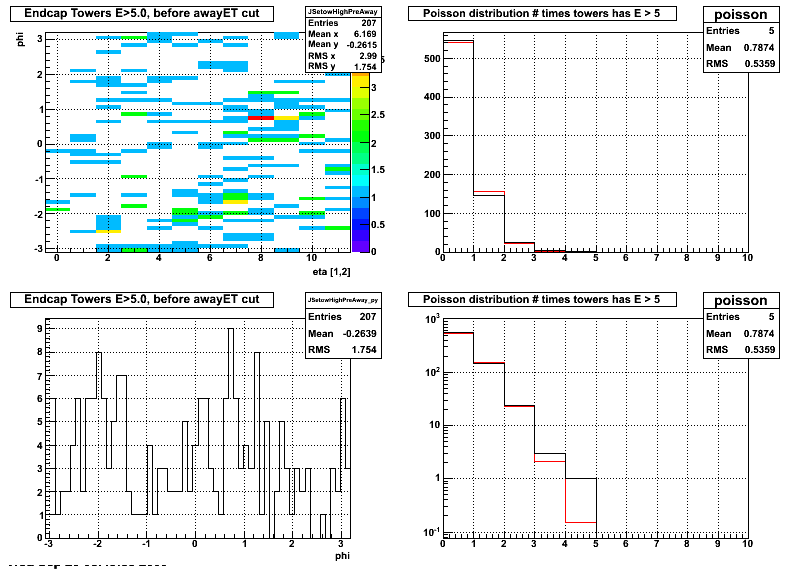
Poisson predictions and data points from distribution above:
Poisson = 540.098 and data = 546
Poisson = 155.278 and data = 146
Poisson = 22.3213 and data = 24
Poisson = 2.13912 and data = 3
Poisson = 0.153749 and data = 1
Looks like very good agreement between distribution of hits in data, and what we would expect from randomly thrown "hits." This indicates that the relative gains are reasonable since the distribution of towers with E>5 are what we expect from statistics.
Using E vs ET for threshold
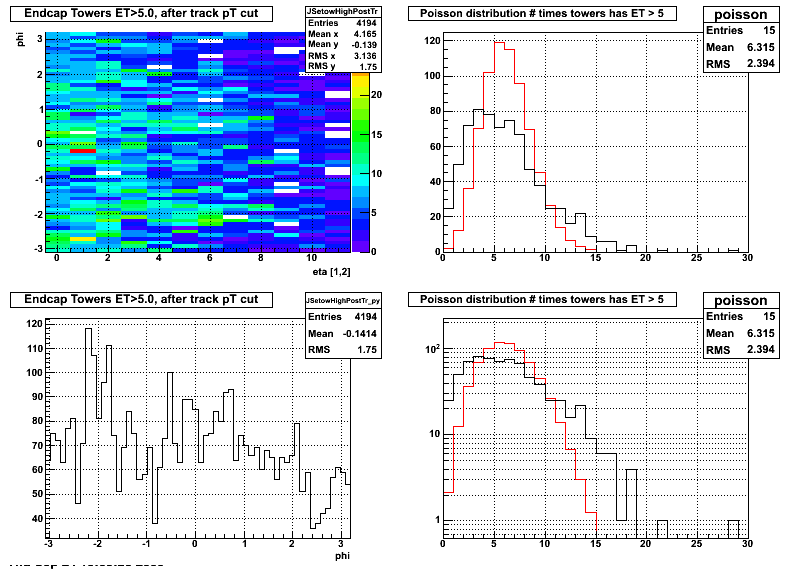
For Figures 5 and 6 I was filling the 2D (eta,phi) histogram if tower E > 5 GeV. However, since towers are matched in ET, maybe this was the wrong variable to use. Below is a plot for ET > 5 GeV, and a test of weather it matches the poisson distribution as well.
Figure 7: Look at endcap towers with ET > 5 GeV distribution across detector and events. Filled after Track pT cut in W-algo verB4.3.
Red=Poisson Distribution; Black=Data
- stevens4's blog
- Login or register to post comments
