OLP disk performance notes - PowerEdge 2950 - Seagate ST2000NM0001
I was going to do testing on onl04, using sdc, sdd, sde, and sdf, all of which are Seagate model ST2000NM0001. All were manufactured in week 31 of 2012. [Note: The drives are newer than the Dell PowerEdge 2950s - onl04 was shipped by Dell on July 21, 2008].
Manufacturer spec sheet for these drives:
http://www.seagate.com/www-content/product-content/constellation-fam/constellation-es/constellation-es-1/en-us/docs/100650925g.pdf
In the general performance characteristics section, the "sustained transfer rate" is given as "62 to 152MB/s". Presumably the highest rate is achieved in the outermost cylinders, slowing down for the inner cylinders.
Well that didn't last long - after only a few minutes I noticed an unexpected drop in performance - a couple HTCondor jobs landed on the node, noticeably reducing the performance of the basic tests I was initially trying by hand. In fact, looking at onl01-onl05, all but onl01 have loads on them from online monitoring tasks, so not a great idea to be testing on them.
Will check with Mike to see if there is a host where I won't interfere with his activity, but where user logins, condor and cron are all disabled at the moment.
Mike suggested using starcloud1 and stopping the ceph cluster while I run some tests. "[Mike] formatted /dev/sdc with xfs (same as storage nodes) and mounted the disk onto /media/sdc"
The sdc disk in starcloud1 is the same model, same week of manufacture as noted above.
Just how fast can the disk heads access the data on the platters? Quick test:
Results (MB/s): 151.72,152.17,151.30,151.31,151.74,152.17,152.17,151.74,151.74,152.18
mean: 151.82, std. dev. 0.34
That transfer rate is in agreement with Seagate's maximum claim.
Now move inward about half-way between the inner and outer cylinders:
Results (MB/s): 123.41,123.42,123.42,123.42,123.43,123.42,123.43,121.73,123.77,123.43
mean: 123.29, std. dev. 0.56
And now near the innermost cylinders:
mean: 73.98, std. dev. 0.74
Less than half the speed of outermost cylinders.
This is somewhat biased towards higher performance than can generally be expected since all activity is taking place near the outer cylinders. That has two performance benefits - first, as seen above, the heads interact with more bits on the platters in a given time interval, and second, seek times to move the heads will be smaller than if data were being written with a wider distribution of cylinders involved.
Here are the initial results for consideration (did not get into terribly large write sizes yet - but not sure it is worthwhile)
.png)
I have some manual tests of higher write sizes that indicate it very soon reaches a plateau of about 144MB/s (but I don't want to take the time to run the full multiple trials and get it all in here, now at 3:30 am).
A bit of speculation - could the slow performance numbers seen when writing small chunks be attributable to XFS overhead? I speculate this because 2500 writes takes about 21 seconds whether writing in chunks of 512B, 1KB, 4KB, 8KB, or 32KB. At 128KB, the time for 2500 writes increases slightly to about 22.8 seconds, then to 29 seconds for 512K.
I would like to get an unformatted drive and write directly to the device to see if these write speeds improve. Could also try ext4 (and/or other file systems) on one of the drives out of curiousity (shouldn't take long).
The speculation about the XFS overhead (crossed out above) was wrong. I made the same 2500 small writes to /dev/sdc (the raw device, no filesystem overhead) and it still took nearly 21 seconds. The explanation is simple - the rotational latency of the drive is 8.33 ms (7200RPM = 120 rev/sec -> 1 revolution = 8.33ms). 8.33x2500 = 20.83, precisely the time taken for 2500 writes in the tests above.
(side note: back of the envelope calculation gives about 1.5MB/track at the outer cylinders. For single write tests like this with sizes less than 1.5MB, the write speed is proportional to the write size (not visible in the graph above because of the vertical scale "crushing" all the small write points, but the actual numbers match this very well.))
Would be interesting to try multiple processes (at least one per CPU) writing to random locations on the drive simultaneously to be closer to real-world, heavy load performance. That will reduce the average rotational latency (by about 1/2 in the case of a single write process), but add seek time, so might not help much (might even be worse since full stroke seek time is 18ms). With simultaneous processes writing to essentially random locations (even if still using direct_IO), the OS and/or drive can do some command shuffling of simultaneous pending write commands to reduce seek and rotational latency, so would expect a significant increase in the measured rates.
A question about the small writes kept bugging me: "why aren't they going into the drive write cache, which should allow them to appear much faster, at least as measured by dd?". Apparently it is because the write-cache on these drives is disabled:
The output above is a bit cryptic, so here's a quick explanation:
"WCE 0" means the current state of WriteCacheEnabled is 0 (disabled).
"cha: y" means the WCE bit is changeable.
"def: 0" means the manufacturer's default state is disabled.
"sav: 0" means the the saved state (the state to be expected after a reboot for instance) is disabled.
Which leaves the questions, "why is write-caching disabled by the manufacturer?" and "under what loads would write caching improve or hurt performance?"
Addendum, early April 2015. I improved a bit on the chart above, with larger write sizes and better rejection of measurements that were interferred with by other processes. Here is the updated graph:
The data points:
Manufacturer spec sheet for these drives:
http://www.seagate.com/www-content/product-content/constellation-fam/constellation-es/constellation-es-1/en-us/docs/100650925g.pdf
In the general performance characteristics section, the "sustained transfer rate" is given as "62 to 152MB/s". Presumably the highest rate is achieved in the outermost cylinders, slowing down for the inner cylinders.
Well that didn't last long - after only a few minutes I noticed an unexpected drop in performance - a couple HTCondor jobs landed on the node, noticeably reducing the performance of the basic tests I was initially trying by hand. In fact, looking at onl01-onl05, all but onl01 have loads on them from online monitoring tasks, so not a great idea to be testing on them.
Will check with Mike to see if there is a host where I won't interfere with his activity, but where user logins, condor and cron are all disabled at the moment.
Mike suggested using starcloud1 and stopping the ceph cluster while I run some tests. "[Mike] formatted /dev/sdc with xfs (same as storage nodes) and mounted the disk onto /media/sdc"
The sdc disk in starcloud1 is the same model, same week of manufacture as noted above.
Just how fast can the disk heads access the data on the platters? Quick test:
for i in `seq 1 10`; do hdparm -t --direct /dev/sdc; done(10 samples, reading for 3 seconds each, without any filesystem or page caching overhead)
Results (MB/s): 151.72,152.17,151.30,151.31,151.74,152.17,152.17,151.74,151.74,152.18
mean: 151.82, std. dev. 0.34
That transfer rate is in agreement with Seagate's maximum claim.
Now move inward about half-way between the inner and outer cylinders:
for i in `seq 1 10` ; do hdparm -t --direct --offset 1000 /dev/sdc; done
Results (MB/s): 123.41,123.42,123.42,123.42,123.43,123.42,123.43,121.73,123.77,123.43
mean: 123.29, std. dev. 0.56
And now near the innermost cylinders:
for i in `seq 1 10` ; do hdparm -t --direct --offset 1850 /dev/sdc; doneResults (MB/s): 73.54,72.32,73.75,73.95,73.95,74.16,74.16,74.57,75.18,74.21
mean: 73.98, std. dev. 0.74
Less than half the speed of outermost cylinders.
Write tests
Now going to use dd, with commands such as this:for i in `seq 1 10` ; do dd bs=1k count=2500 if=/dev/zero of=/media/sdc/ddtest oflag=direct; rm -f /media/sdc/ddtest; sync; doneRates will be taken directly from the dd output and averaged (full results kept in a spreadsheet, not included here).
This is somewhat biased towards higher performance than can generally be expected since all activity is taking place near the outer cylinders. That has two performance benefits - first, as seen above, the heads interact with more bits on the platters in a given time interval, and second, seek times to move the heads will be smaller than if data were being written with a wider distribution of cylinders involved.
Here are the initial results for consideration (did not get into terribly large write sizes yet - but not sure it is worthwhile)
I have some manual tests of higher write sizes that indicate it very soon reaches a plateau of about 144MB/s (but I don't want to take the time to run the full multiple trials and get it all in here, now at 3:30 am).
I would like to get an unformatted drive and write directly to the device to see if these write speeds improve. Could also try ext4 (and/or other file systems) on one of the drives out of curiousity (shouldn't take long).
The speculation about the XFS overhead (crossed out above) was wrong. I made the same 2500 small writes to /dev/sdc (the raw device, no filesystem overhead) and it still took nearly 21 seconds. The explanation is simple - the rotational latency of the drive is 8.33 ms (7200RPM = 120 rev/sec -> 1 revolution = 8.33ms). 8.33x2500 = 20.83, precisely the time taken for 2500 writes in the tests above.
(side note: back of the envelope calculation gives about 1.5MB/track at the outer cylinders. For single write tests like this with sizes less than 1.5MB, the write speed is proportional to the write size (not visible in the graph above because of the vertical scale "crushing" all the small write points, but the actual numbers match this very well.))
Would be interesting to try multiple processes (at least one per CPU) writing to random locations on the drive simultaneously to be closer to real-world, heavy load performance. That will reduce the average rotational latency (by about 1/2 in the case of a single write process), but add seek time, so might not help much (might even be worse since full stroke seek time is 18ms). With simultaneous processes writing to essentially random locations (even if still using direct_IO), the OS and/or drive can do some command shuffling of simultaneous pending write commands to reduce seek and rotational latency, so would expect a significant increase in the measured rates.
A question about the small writes kept bugging me: "why aren't they going into the drive write cache, which should allow them to appear much faster, at least as measured by dd?". Apparently it is because the write-cache on these drives is disabled:
[root@onl04 ~]# sdparm --get=WCE /dev/sdf
    /dev/sdf: SEAGATE   ST2000NM0001      PS06
WCE         0  [cha: y, def:  0, sav:  0]
The output above is a bit cryptic, so here's a quick explanation:
"WCE 0" means the current state of WriteCacheEnabled is 0 (disabled).
"cha: y" means the WCE bit is changeable.
"def: 0" means the manufacturer's default state is disabled.
"sav: 0" means the the saved state (the state to be expected after a reboot for instance) is disabled.
Which leaves the questions, "why is write-caching disabled by the manufacturer?" and "under what loads would write caching improve or hurt performance?"
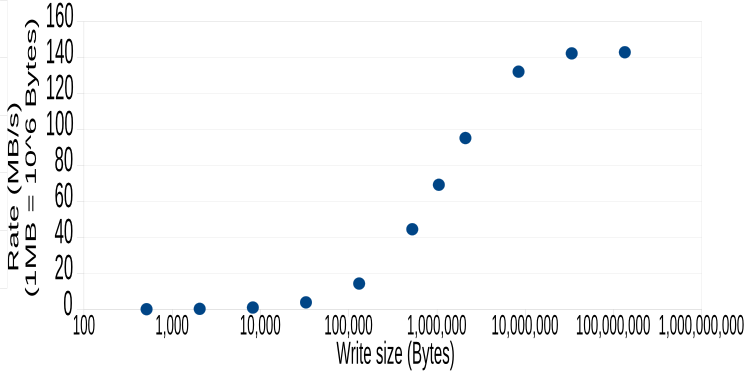
Addendum, early April 2015. I improved a bit on the chart above, with larger write sizes and better rejection of measurements that were interferred with by other processes. Here is the updated graph:
The data points:
| write size (Bytes) | rate (MB/s) |
| 512 | 0.0614 |
| 2048 | 0.2457 |
| 8192 | 0.9797 |
| 32768 | 3.8427 |
| 131072 | 14.2980 |
| 524288 | 44.4792 |
| 1048576 | 69.1849 |
| 2097152 | 95.1698 |
| 8388608 | 132.0405 |
| 33554432 | 142.2000 |
| 134217728 | 142.8302 |
Groups:
- wbetts's blog
- Login or register to post comments