Paper Proposal: 500 GeV EEMC Dijet $A_{LL}$}
Title: Measurements of longitudinal double-spin asymmetries for dijet production at intermediate pseudorapidity in polarized pp collisions at \sqrt(s) = 510 GeV
PAs: W.W. Jacobs, J.H. Kwasizur, S.W. Wissink
Target Journal: Physical Review D Letters
Abstract: Measurements of the longitudinal double-spin asymmetry ALL are presented for dijets with at least
one jet reconstructed within the intermediate pseudorapidity range 0.9 < \eta < 1.8. The dijets are produced in
polarized pp collisions at a center-of-mass energy \sqrt(s) = 510 GeV at STAR, probing possible contributions
of gluons to the proton spin down to values of Bjorken-x ~ 0.01 in the most forward of the dijet topologies studied.
In regions of kinematic overlap, the measured asymmetries are generally consistent with predictions from global
analyses that have incorporated previous RHIC results, but will provide new constraints on the shape and magnitude
of the gluon helicity distribution, \Delta g(x), in the poorly constrained low-x region.
Paper Draft:
510 GeV EEMC Dijet A_LL v1.1 (15-Feb-2024}
Analysis Note:
Version-v1.0 (pdf)
Presentations and Links:
Run12 Endcap Dijet Asymmetries Preliminary Request Page
Run13 Endcap Dijet Asymmetries Preliminary Request Page; includes updated Run12 Endcap Dijet Asymmetries
Endcap Dijet A_LL Figures for Run12, Run13, and Run12+Run13
STAR Collaboration Meeting - Feb. 2022
DIS 2022 talk
Paper proposal to the SPIN PWG
Paper preview to PWG conveners
Analysis Code:
TBD
Supplementary Materials:
Probably not ...
FIGURES:
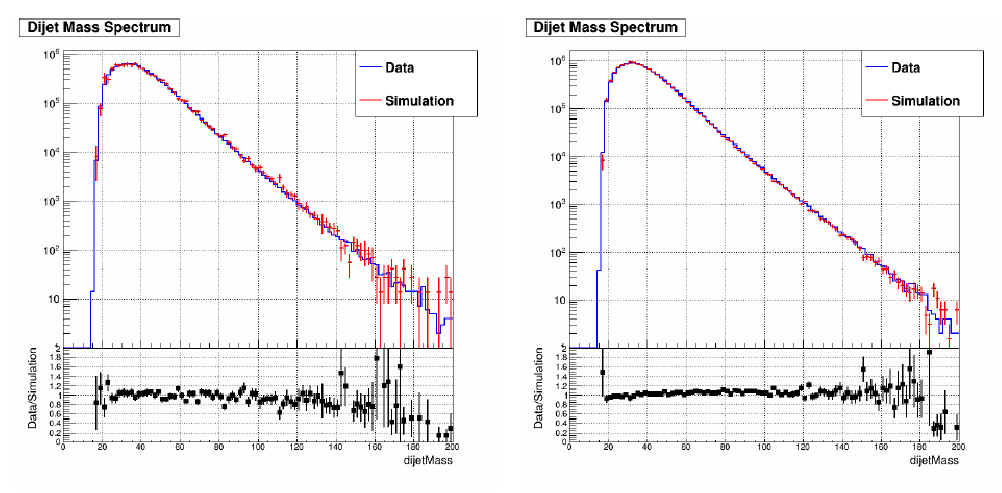
Figure. 1: Dijet invariant mass distributions compared to MC simulation for JP2 in 2012 (left) and 2013 (right).
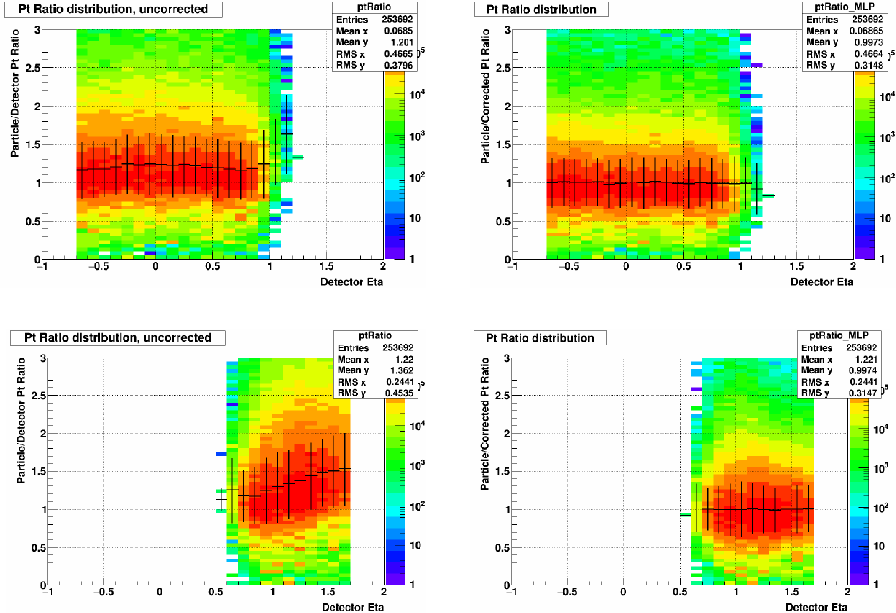
Figure. 2: Jet particle/detector pT ratio vs. detector \eta, before (left) and after (right) the machine learning pT shift for Barrel jets (top row) and Endcap-Endcap jets (bottom row). In each plot, the black symbols and vertical bars indicate the mean and RMS, respectively, of the distribution in each bin. Events are from the 2012 embedding sample.
[--- probably want to pick a just a portion of this figure, then make lines and annotation more visible]
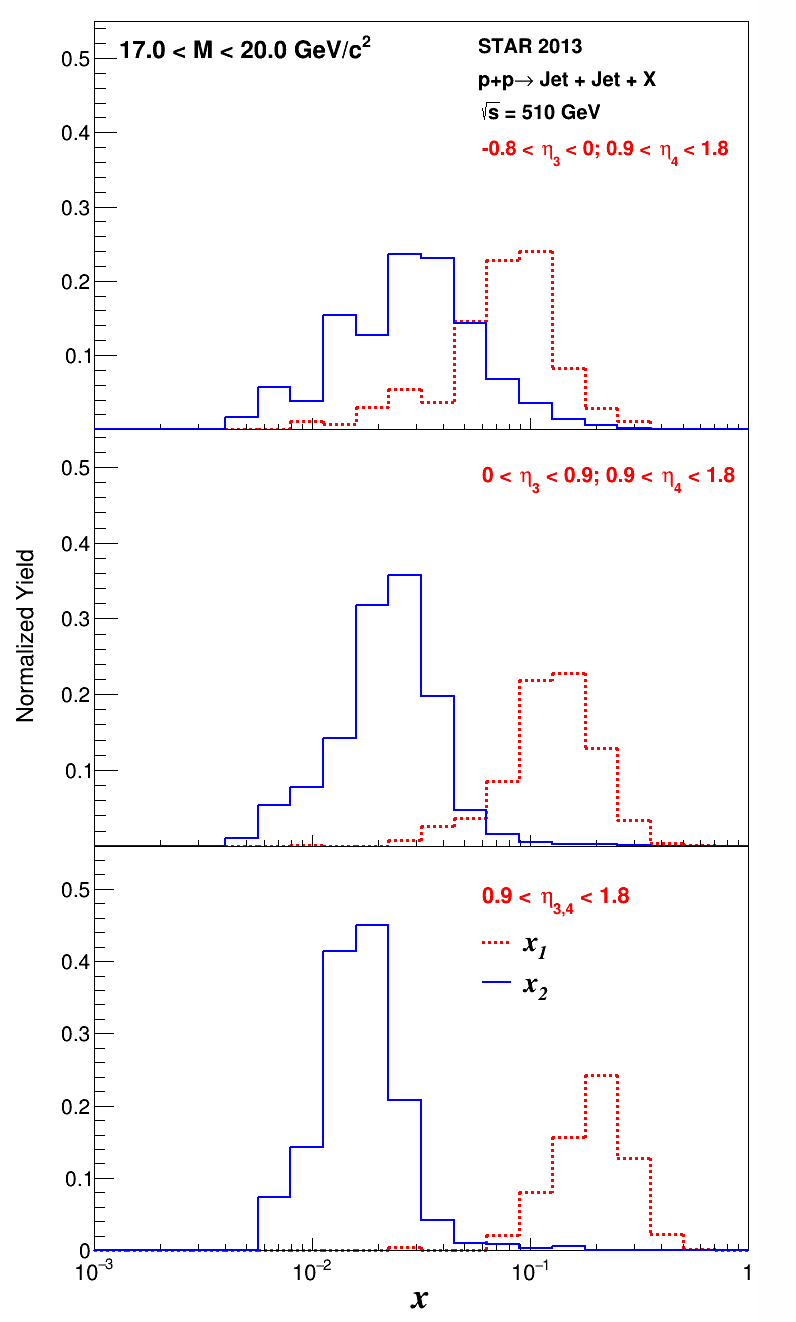
Figure 3: Distributions of parton x1 (red, dotted) and x2 (blue, solid) from leading order simulation, weighted by the partonic asymetry, for dijet events at \sqrt{s} = 510 GeV. The dijet topologies shown are for East Barrel-Endcap (upper plot), West Barrel-Endcap (middle plot), and Endcap-Endcap(lower plot).
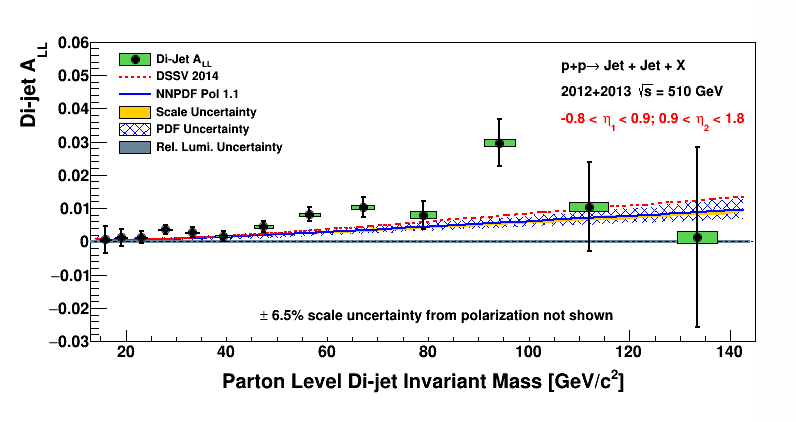
Figure 4: Dijet ALL versus parton-level dijet invariant mass in the Barrel-Endcap full topology for the combined 2012 and 2013 data.
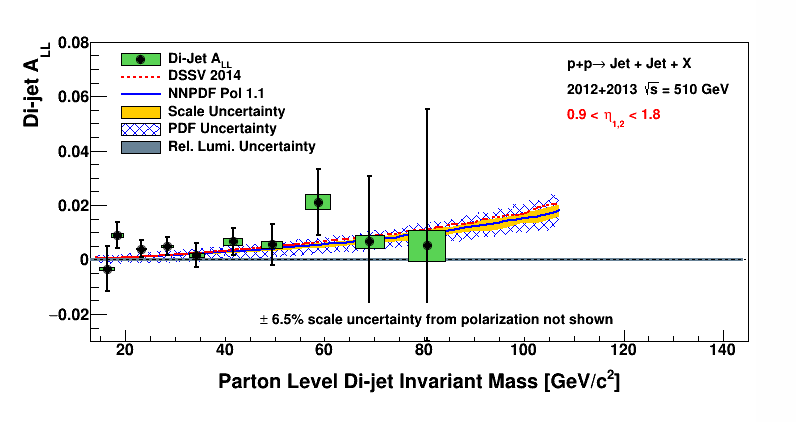
Figure 5: Dijet ALL versus parton-level dijet invariant mass in the Endcap-Endcap topology for the combined 2012 and 2013 data.
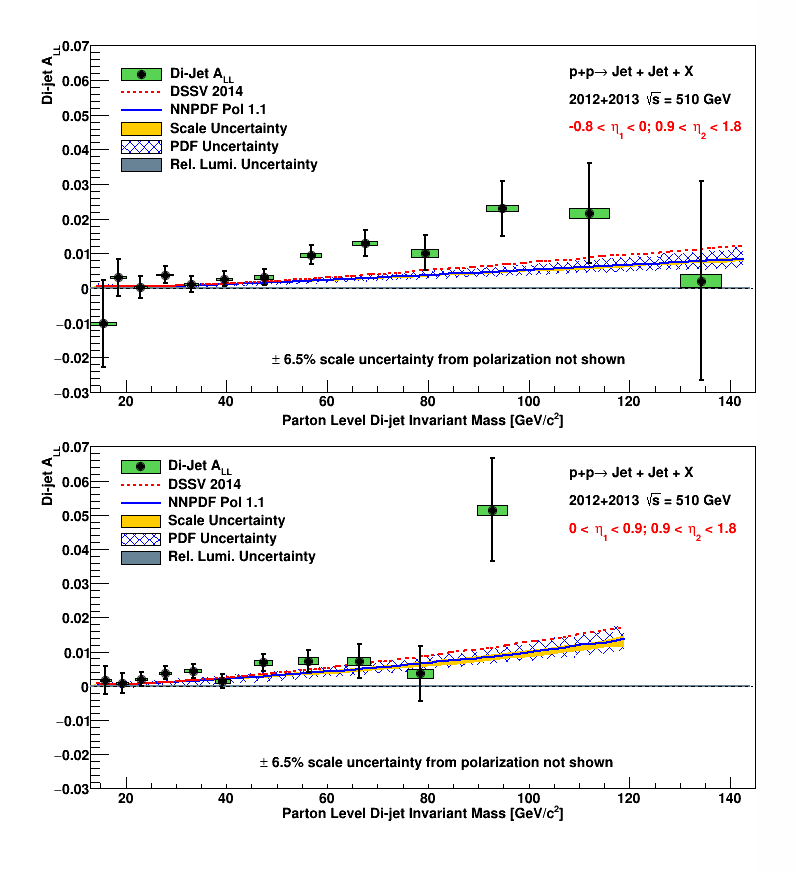
Figure 6: Dijet ALL versus parton-level dijet invariant mass in the East Barrel-Endcap (upper plot) and West Barrel-Endcap (lower plot) topologies for the combined 2012 and 2013 data.
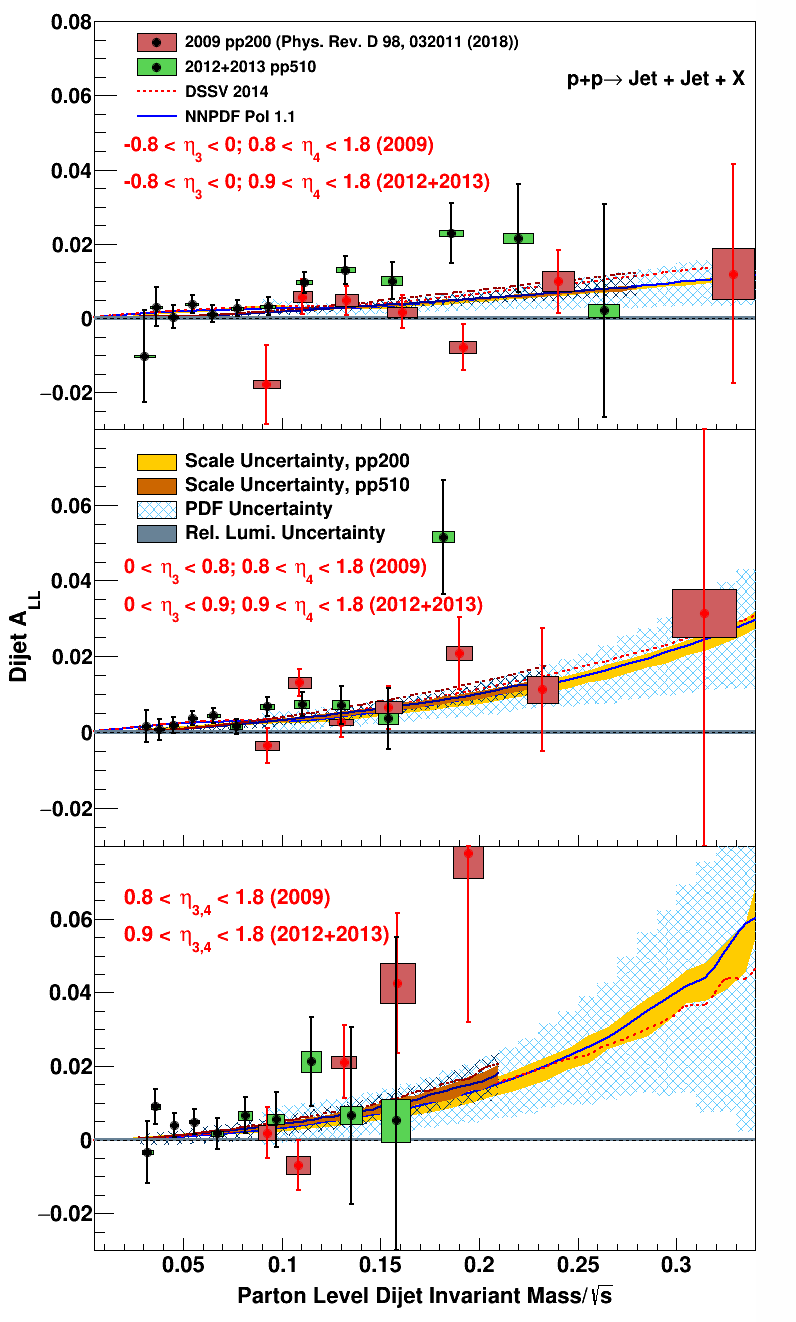
Figure 7: Longitudinal asymmetry ALL as a function of Minv for dijets measured in 2012 and 2013 at \sqrt{s} = 510 GeV compared with data from 2009 at \sqrt{s} = 200 GeV. Results are shown for the East Barrel-Endcap (top plot), West Barrel-Endcap (middle plot), and Endcap-Endcap (bottom plot) topologies.
- wissink's blog
- Login or register to post comments