Time Dependency in BEMC Gains
In an attempt to confirm the findings made by Adam Kocoloski (see here), to perhaps determine where time-dependency is occurring in the BEMC (assuming that there is any localization), and to extend the analysis to 2008 data, we have created and applied analysis tools to off-line EMC calibration data, analyzing ADC tower response with regard to time. This work directly extends the analysis tools developed by Matthew Walker, and uses the EMC off-line calibration data that he maintains.
A sample of our results is shown below for 2006 data:
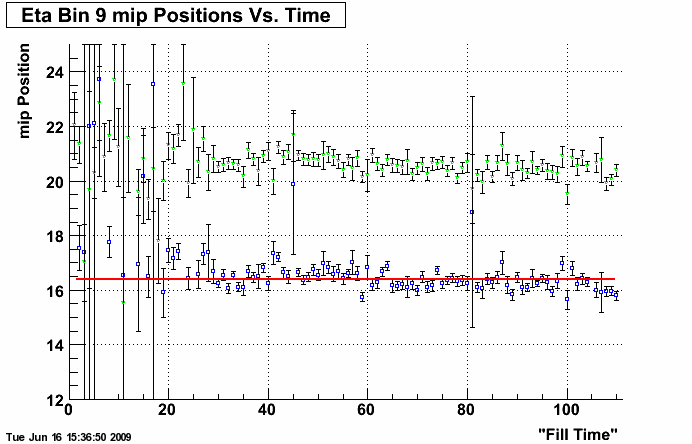
Figure 1: 2006 Eta Bin 9 mip Peak Positions Over Time
.png)
Figure 2: 2006 Chi^2 versus Eta Bin
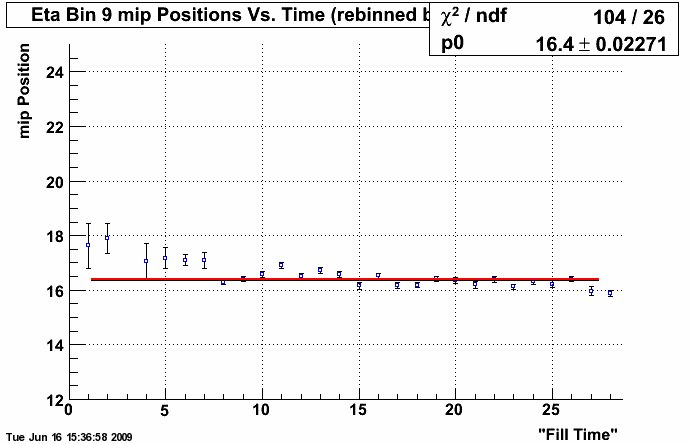
Figure 3: 2006 Eta Bin 9 mip Peak Positions Over Time Using Weighted Average Over 4 Values
.png)
Figure 4: 2006 Chi^2 versus Eta Bin for Weighted Averages
Originally, we had intended to examine every tower on every run and attempt to track tower gains individually, creating histograms for mip position at each pairing. We tried this first with the 2008 data, but this proved unworkable as there simply were not enough events to analyze tower/run gains individually. We found, however, that if we accumulated histograms for eta bins over fills, occupancy was much better and analysis could be performed. This technique was extended to the 2006 data.
Once histogram creation was complete, for each eta bin/fill histogram we then attempted to apply a Gaussian fit across ADC tower responses. We discovered a number of irregularities in attempting to apply this fit, so many so that we abandoned the legacy Gaussian fit methodology and instead used a Landau fit. This appeared to give far fewer errors during the fit process, and also appeared to fit the ADC tower response histograms better than a Gaussian fit. However, this fit did not work perfectly, both because there were histograms with too few events to even attempt a Landau fit, and because the fit applied incorrectly to some histograms. Histograms that could not be fit appeared to have three to five events, probably corresponding to three or fewer bins with occupancy. When a fit was attempted for these histograms, zero or fewer degrees of freedom were reported by root. We eliminated these bin/fill histograms from our consideration since they could not yield statistically significant results. We were able to correct the fits in the second category somewhat. If a naive Landau fit gave a peak result of less than zero, which is not a reasonable fit since it fails to reflect any physical phenomenon, we attempted to correct that fit by eliminating bins over 100 ADC tower response in the fit. Note that this correction was only applied to 2006 data. Out of 220 known bad fits (fits with ADC tower response less than zero), 60 fits could be corrected in this way. This left 160 towers with less than zero ADC tower response. A table of low occupancy bin/fill histograms and known bad bin/fill histograms can be found at the end of this post.
The histograms with their associated Landau fits for 2006 data can be found here, and for 2008 data can be found here. Examining these histograms will reveal that the 2008 data has events well below zero in many of the histograms. The 2006 histograms also display negative events, but this is not nearly as prevalent in the 2006 data as in the 2008 data. These negative ADC responses are apparently due to a zero ADC tower response in the calibration data which then has a pedestal correction applied. Our analysis suggested that the 2006 data is successfully filtering out most towers that would give rise to negative events, but the 2008 data is not. The method for filtering events has not changed from the 2006 data set to the 2008 data set (we use status tables as our primary filtering mechanism), and we are uncertain why this problem is occurring. Also, please note that there is a relatively low-occupancy "zero" fill present in the 2006 data. This fill number was included in the off-line calibration data, and we are uncertain at this time as to the correct fill number(s) for this data. Finally, in the 2006 fits, histograms that were re-fit with ADC tower response bins over 100 eliminated from the fit will appear with a red fit line rather than a yellow fit line.
The final results of this analysis gives us mip peaks over time. Plots of the mip peaks over time for the each eta bin for the 2006 off-line calibration data are available here. One of these plots can be seen in Figure 1 for the 9th eta bin.
For each of these plots, eta bin 1 corresponds to eta = -1, eta = 0 occurs between eta bins 20 and 21, and eta bin 40 corresponds to eta = 1 (fill number mappings are provided at the end of this article). On each plot the Landau peak error is also shown, calculated using GetParError(1). In green, the mip mean values and associated errors are also ploted for comparison. Finally, a constant linear fit has been applied to each graph.
Once these plots were created, we calculated the chi^2 for each eta bin. The chi^2 per eta bin is plotted in Figure 2 and included in the 2006 data analysis results file. There appears to be significant deviation from the fit in Figure 1, as well as in the graphs of the other eta bins, suggesting that there is a time dependence in the information captured by the BEMC. This is further supported by the large chi^2 values in Figure 2. For clarity, a weighted average of every 4 fills was calculated and plotted and a constant linear fit applied. These results are included in the data analysis results file, and an example can be seen in Figure 3 for eta bin 9. Finally, for completeness, the chi^2 for the graphed weighted averages was calculated. This plot can be seen in Figure 4.
This same process was repeated for the 2008 data:
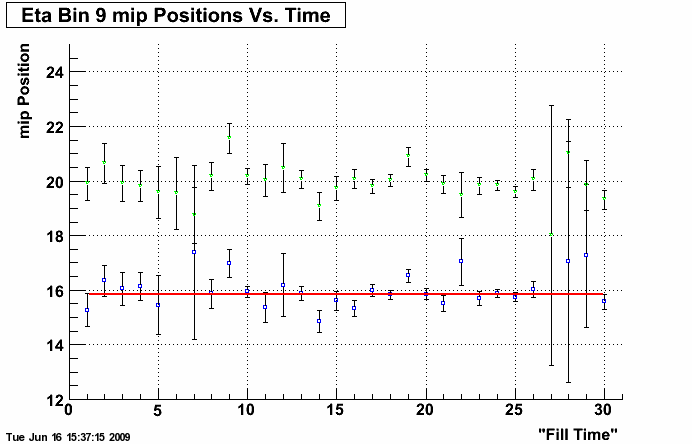
Figure 5: 2008 Eta Bin 9 mip Peak Positions Over Time
.png)
Figure 6: 2008 Chi^2 versus Eta Bin
There was significantly less usable 2008 data, and while weighted averaging was completed, it was not necessary to see trends in the data. There does appear to be some significant time-related deviation in the first four fills, but overall time-dependence in the 2008 data is not nearly so pronounced as in the 2006 data.
For a complete set of mip position fits, data graphs, and chi^2 graphs, including the weighted average graphing for the 2008 data, see the following two PDF files:
It is possible, from the archived postscript files linked above to determine the mapping from actual fill numbers to the "Fill Time" on the individual eta bin mip position graphs. However, for ease of use, a table of mappings is provided here:
2006 Fills
1
0
2
7603
3
7622
4
7627
5
7630
6
7632
7
7637
8
7639
9
7641
10
7642
11
7645
12
7646
13
7651
14
7652
15
7654
16
7655
17
7657
18
7658
19
7662
20
7671
21
7672
22
7673
23
7674
24
7681
25
7685
26
7688
27
7691
28
7697
29
7699
30
7718
31
7722
32
7724
33
7725
34
7729
35
7739
36
7740
37
7744
38
7745
39
7753
40
7756
41
7757
42
7780
43
7781
44
7785
45
7786
46
7788
47
7789
48
7790
49
7791
50
7792
51
7794
52
7795
53
7796
54
7797
55
7800
56
7803
57
7804
58
7805
59
7810
60
7811
61
7815
62
7817
63
7820
64
7823
65
7824
66
7825
67
7826
68
7827
69
7830
70
7831
71
7847
72
7850
73
7851
74
7852
75
7853
76
7855
77
7856
78
7858
79
7863
80
7864
81
7865
82
7871
83
7872
84
7883
85
7886
86
7887
87
7889
88
7890
89
7891
90
7892
91
7893
92
7896
93
7901
94
7908
95
7909
96
7911
97
7913
98
7915
99
7916
100
7918
101
7921
102
7922
103
7926
104
7944
105
7946
106
7949
107
7951
108
7952
109
7954
110
7957
2008 Fills
1
9880
2
9884
3
9885
4
9888
5
9890
6
9897
7
9898
8
9902
9
9905
10
9906
11
9909
12
9910
13
9919
14
9920
15
9935
16
9938
17
9939
18
9940
19
9942
20
9947
21
9948
22
9965
23
9966
24
9971
25
9972
26
9973
27
9974
28
9975
29
9977
30
9981
The complete code used to generate these graphs and histograms can be found here.
2006 Chi^2 Information for Non-Weighted Average Plots
Eta Bin
Chi^2
NDF
Chi^2/NDF
1
295.022
109
2.70663
2
217.36
109
1.99413
3
239.323
109
2.19563
4
302.13
109
2.77184
5
187.008
109
1.71567
6
262.81
109
2.4111
7
296.904
109
2.72389
8
372.264
109
3.41527
9
234.632
109
2.15259
10
197.129
109
1.80853
11
294.355
109
2.70051
12
268.893
109
2.46691
13
274.438
109
2.51778
14
206.787
109
1.89713
15
331.437
109
3.04071
16
331.695
109
3.04308
17
305.638
109
2.80402
18
258.893
109
2.37517
19
270.777
109
2.4842
20
337.333
109
3.09479
21
273.295
109
2.5073
22
314.346
109
2.88391
23
349.383
109
3.20535
24
304.127
109
2.79016
25
342.458
109
3.14182
26
225.758
109
2.07118
27
282.544
109
2.59215
28
208.527
109
1.91309
29
249.901
109
2.29267
30
300.904
109
2.76059
31
228.167
109
2.09328
32
262.696
109
2.41006
33
269.699
109
2.47431
34
252.759
109
2.31889
35
326.472
109
2.99516
36
282.107
109
2.58814
37
323.608
109
2.96888
38
224.126
109
2.05621
39
209.165
109
1.91895
40
238.978
109
2.19246
2008 Chi^2 Information for Non-Weighted Average Plots
Eta Bin
Chi^2
NDF
Chi^2/NDF
1
48.4772
29
1.67163
2
35.8566
29
1.23644
3
50.6746
29
1.7474
4
30.7782
29
1.06132
5
19.1974
29
0.661978
6
49.6863
29
1.71332
7
44.0364
29
1.51849
8
105.2
29
3.62759
9
34.4464
29
1.18781
10
54.6936
29
1.88599
11
50.5857
29
1.74434
12
24.2633
29
0.836667
13
42.7737
29
1.47496
14
61.6484
29
2.12581
15
51.223
29
1.76631
16
33.8621
29
1.16766
17
57.1911
29
1.97211
18
33.6553
29
1.16053
19
48.4714
29
1.67143
20
65.0013
29
2.24142
21
51.4812
29
1.77521
22
40.7595
29
1.4055
23
24.4869
29
0.844377
24
56.7946
29
1.95843
25
60.9415
29
2.10143
26
50.6547
29
1.74671
27
36.6322
29
1.26318
28
55.6407
29
1.91865
29
32.8781
29
1.13373
30
83.8703
29
2.89208
31
49.4795
29
1.70619
32
26.7862
29
0.923662
33
51.5886
29
1.77892
34
33.0107
29
1.1383
35
31.6231
29
1.09045
36
43.4897
29
1.49965
37
24.2453
29
0.836044
38
62.0586
29
2.13995
39
50.4847
29
1.74085
40
81.4427
29
2.80837
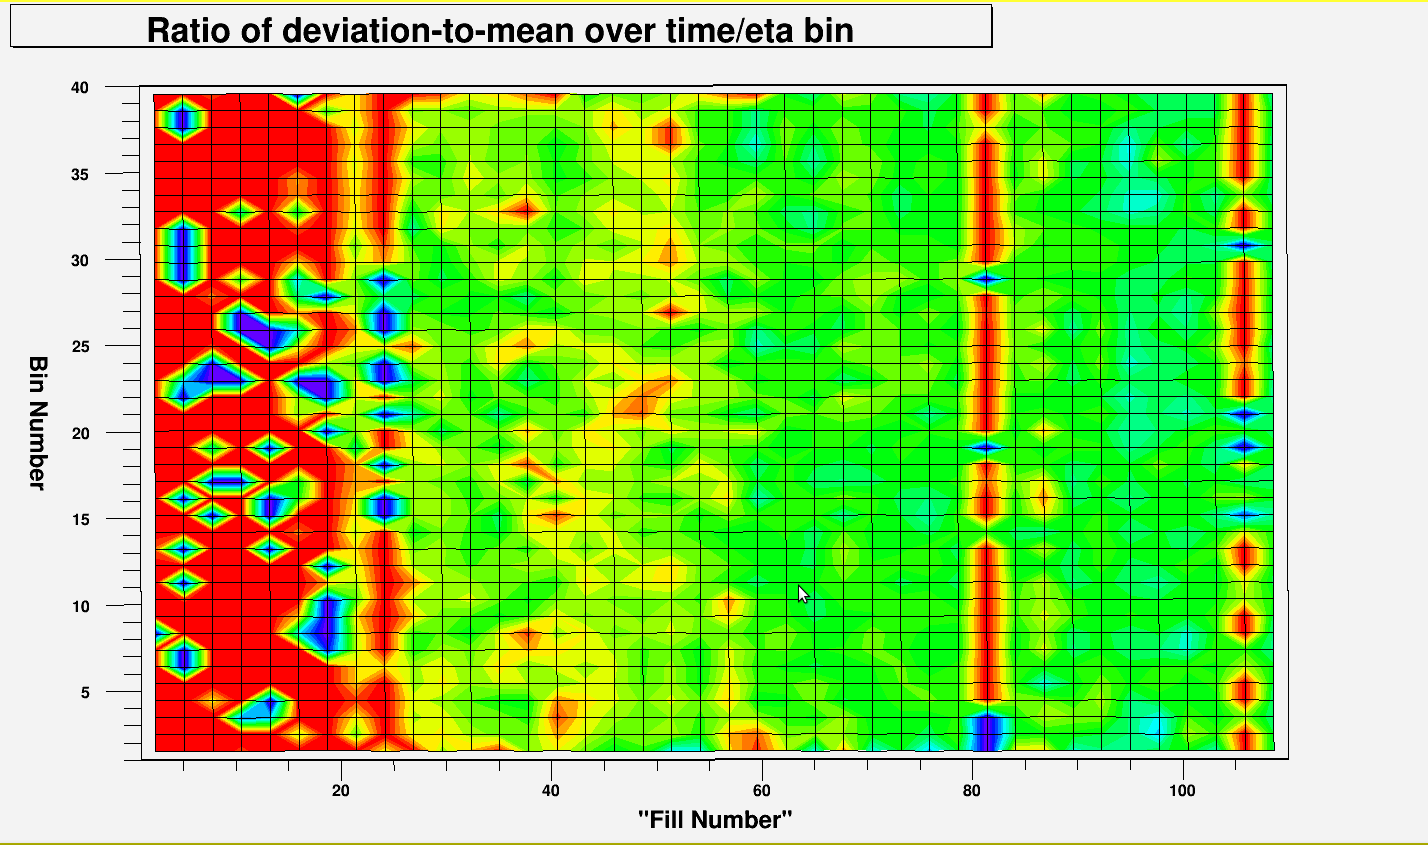
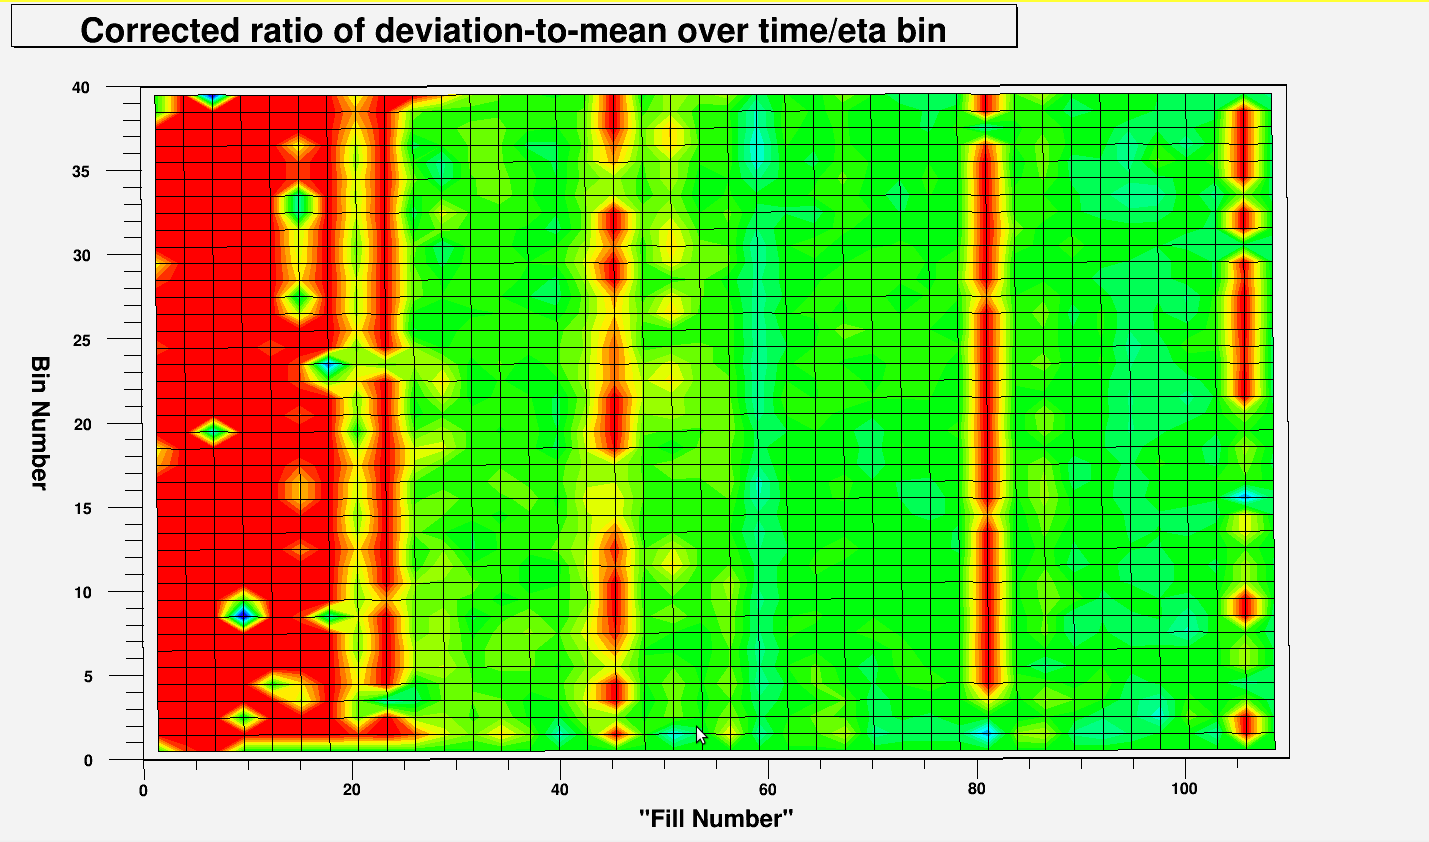
Below are 3D graphs of the bin/fill mip peak deviations and weighted deviations from the mean, both corrected by elimination of the known bad and low occupancy points, and without those corrections.
Row 1: Starting with the unweighted, uncorrected peak deviations from the mean (calculated using the formula (peak-mean)/mean):
.png)
.png)
.png)
.png)
Row 2: Next, the uncorrected weighted deviations (calculated using the formula (peak-mean)/error):
.png)
.png)
.png)
Row 3: Next, the corrected peak deviations from the mean (calculated using the formula (peak-mean)/mean):
.png)
.png)
.png)
.png)
Row 4: Finally, the corrected weighted deviations (calculated using the formula (peak-mean)/error):
.png)
.png)
.png)
Most Significant High/Low Deviation Fills per Eta
| Eta | Min Fill | Max Fill | ||||||||||
|---|---|---|---|---|---|---|---|---|---|---|---|---|
| Fill | Peak | Peak Error | Deviation | Ratio of Deviation to Mean | Weighted Deviation | Fill | Peak | Peak Error | Deviation | Ratio of Deviation to Mean | Weighted Deviation | |
| 1 | 7792 | 16.2562 | 0.501869 | -2.69236 | -0.142088 | -5.36466 | 7725 | 20.8232 | 0.371838 | 1.87463 | 0.0989326 | 5.04153 |
| 2 | 7810 | 16.2683 | 0.236415 | -1.06186 | -0.0612726 | -4.49152 | 7785 | 18.0438 | 0.226746 | 0.71369 | 0.041182 | 3.14753 |
| 3 | 7915 | 14.9799 | 0.280195 | -1.47054 | -0.0893919 | -5.24826 | 7718 | 17.2329 | 0.167656 | 0.782447 | 0.0475639 | 4.66698 |
| 4 | 7810 | 15.4381 | 0.189028 | -0.881331 | -0.054005 | -4.66243 | 7780 | 17.4137 | 0.20918 | 1.09429 | 0.0670542 | 5.23131 |
| 5 | 7810 | 16.0383 | 0.160946 | -0.544681 | -0.0328457 | -3.38425 | 7901 | 17.4833 | 0.276589 | 0.900283 | 0.0542894 | 3.25495 |
| 6 | 7810 | 15.7845 | 0.158294 | -0.612233 | -0.0373387 | -3.8677 | 7780 | 17.1889 | 0.191984 | 0.792101 | 0.0483084 | 4.12587 |
| 7 | 7810 | 15.8564 | 0.172848 | -0.783547 | -0.0470882 | -4.53315 | 7780 | 17.9032 | 0.18105 | 1.26321 | 0.0759143 | 6.97714 |
| 8 | 7918 | 15.0875 | 0.319792 | -1.21471 | -0.0745116 | -3.79842 | 7780 | 17.495 | 0.215598 | 1.19274 | 0.073164 | 5.53222 |
| 9 | 7810 | 15.7443 | 0.16654 | -0.642799 | -0.039226 | -3.85972 | 7780 | 17.2138 | 0.172563 | 0.826756 | 0.0504518 | 4.79104 |
| 10 | 7810 | 15.9281 | 0.147401 | -0.628564 | -0.0379644 | -4.26431 | 7789 | 17.1375 | 0.16474 | 0.580794 | 0.0350792 | 3.52552 |
| 11 | 7863 | 15.7782 | 0.145873 | -0.565314 | -0.0345896 | -3.87538 | 7780 | 17.4071 | 0.1806 | 1.06363 | 0.0650795 | 5.8894 |
| 12 | 7852 | 15.859 | 0.14272 | -0.484601 | -0.0296508 | -3.39546 | 7780 | 17.37 | 0.186065 | 1.02646 | 0.0628049 | 5.51666 |
| 13 | 7810 | 15.0866 | 0.154509 | -0.971244 | -0.0604842 | -6.286 | 7780 | 17.0802 | 0.209848 | 1.02243 | 0.0636716 | 4.87222 |
| 14 | 7944 | 15.9961 | 0.135968 | -0.36042 | -0.0220353 | -2.65077 | 7780 | 17.1137 | 0.211569 | 0.757174 | 0.0462919 | 3.57885 |
| 15 | 7952 | 15.1289 | 0.204275 | -0.926435 | -0.0577026 | -4.53524 | 7780 | 17.0861 | 0.17028 | 1.03078 | 0.0642013 | 6.05342 |
| 16 | 7810 | 15.2906 | 0.153184 | -0.902229 | -0.055718 | -5.88984 | 7780 | 17.3349 | 0.149164 | 1.14211 | 0.0705321 | 7.65675 |
| 17 | 7810 | 15.2082 | 0.160221 | -0.840672 | -0.0523821 | -5.24695 | 7780 | 16.8596 | 0.155612 | 0.810755 | 0.0505179 | 5.2101 |
| 18 | 7957 | 15.6509 | 0.155836 | -0.60625 | -0.0372912 | -3.89031 | 7780 | 17.2347 | 0.185434 | 0.97756 | 0.0601309 | 5.27174 |
| 19 | 7913 | 15.5139 | 0.200186 | -0.765437 | -0.0470191 | -3.82363 | 7780 | 17.482 | 0.170201 | 1.20266 | 0.0738767 | 7.06612 |
| 20 | 7810 | 15.7808 | 0.162136 | -0.611816 | -0.0373226 | -3.77348 | 7780 | 17.5456 | 0.164402 | 1.15289 | 0.0703299 | 7.01266 |
| 21 | 7810 | 15.6191 | 0.186332 | -0.960491 | -0.0579321 | -5.15473 | 7791 | 17.9363 | 0.212503 | 1.35666 | 0.081827 | 6.38418 |
| 22 | 7830 | 15.5136 | 0.187816 | -0.85552 | -0.0522643 | -4.5551 | 7791 | 17.413 | 0.19692 | 1.04393 | 0.0637745 | 5.3013 |
| 23 | 7944 | 15.5275 | 0.139721 | -0.714242 | -0.0439756 | -5.11192 | 7780 | 17.2892 | 0.22595 | 1.04738 | 0.0644868 | 4.63545 |
| 24 | 7810 | 15.3879 | 0.166548 | -0.786669 | -0.0486361 | -4.72338 | 7780 | 16.9291 | 0.190463 | 0.754523 | 0.0466487 | 3.96152 |
| 25 | 7921 | 15.5813 | 0.216888 | -1.09504 | -0.0656645 | -5.04889 | 7725 | 17.2038 | 0.157401 | 0.527487 | 0.0316309 | 3.35123 |
| 26 | 7810 | 15.7683 | 0.170984 | -0.709398 | -0.043052 | -4.14891 | 7780 | 17.3236 | 0.197604 | 0.845904 | 0.0513363 | 4.2808 |
| 27 | 7810 | 15.7084 | 0.175843 | -0.915948 | -0.0550968 | -5.2089 | 7794 | 18.9072 | 0.372134 | 2.28289 | 0.137322 | 6.1346 |
| 28 | 7810 | 15.8663 | 0.171186 | -0.722838 | -0.0435731 | -4.22253 | 7789 | 17.2877 | 0.170334 | 0.698628 | 0.0421137 | 4.10152 |
| 29 | 7810 | 16.0881 | 0.171209 | -0.652473 | -0.0389756 | -3.81098 | 7780 | 17.535 | 0.192011 | 0.794462 | 0.0474573 | 4.13758 |
| 30 | 7810 | 15.727 | 0.168284 | -0.929602 | -0.0558098 | -5.524 | 7780 | 17.8414 | 0.190293 | 1.18479 | 0.0711304 | 6.22613 |
| 31 | 7810 | 16.2059 | 0.168598 | -0.736001 | -0.0434426 | -4.36542 | 7780 | 18.0306 | 0.204738 | 1.08866 | 0.0642586 | 5.31735 |
| 32 | 7824 | 16.3659 | 0.198841 | -0.732938 | -0.0428647 | -3.68605 | 7788 | 17.6849 | 0.13455 | 0.585999 | 0.0342712 | 4.35525 |
| 33 | 7909 | 16.2428 | 0.16712 | -0.832232 | -0.0487398 | -4.97985 | 7780 | 18.1181 | 0.196472 | 1.04307 | 0.0610875 | 5.309 |
| 34 | 7896 | 16.3939 | 0.162028 | -0.499743 | -0.0295817 | -3.0843 | 7780 | 17.8806 | 0.209768 | 0.986915 | 0.0584193 | 4.70479 |
| 35 | 7810 | 15.8762 | 0.181974 | -0.921881 | -0.05488 | -5.066 | 7780 | 17.7778 | 0.220979 | 0.979659 | 0.0583196 | 4.43327 |
| 36 | 7810 | 16.0521 | 0.168851 | -1.16777 | -0.0678156 | -6.91601 | 7639 | 18.68 | 0.45097 | 1.46012 | 0.0847926 | 3.23772 |
| 37 | 7810 | 15.683 | 0.192899 | -1.02627 | -0.061419 | -5.32023 | 7729 | 17.3629 | 0.173397 | 0.653616 | 0.039117 | 3.76948 |
| 38 | 7957 | 16.4592 | 0.179872 | -0.726167 | -0.0422549 | -4.03713 | 7672 | 18.3291 | 0.342754 | 1.14375 | 0.0665533 | 3.33693 |
| 39 | 7810 | 16.9372 | 0.222909 | -1.02862 | -0.0572542 | -4.61451 | 7671 | 20.0084 | 0.515087 | 2.04264 | 0.113696 | 3.96561 |
| 40 | 7952 | 17.0782 | 0.719276 | -2.87938 | -0.144275 | -4.00316 | 7724 | 21.3157 | 0.317357 | 1.3581 | 0.0680492 | 4.2794 |
Low Statistic Eta-Fills
| Eta | Fill | # of Events | Peak | Peak Error | Mean | Mean Error | Deviation | Ratio of Deviation to Mean | Weighted Deviation | Chi^2 | DOF | Chi^2/DOF |
|---|---|---|---|---|---|---|---|---|---|---|---|---|
| 1 | 7622 | 1 | 76.9168 | 37747.2 | 64.01 | 0 | 57.9682 | 3.05924 | 0.0015357 | 0 | -2 | -0 |
| 2 | 7627 | 3 | 26.3603 | 337.937 | 21.0933 | 1.6238 | 9.03017 | 0.521067 | 0.0267214 | 7e-06 | 0 | |
| 3 | 7622 | 2 | 24.129 | 232.466 | 22.605 | 5.97859 | 7.67857 | 0.46677 | 0.0330309 | 0 | -1 | -0 |
| 4 | 7622 | 1 | 49.9168 | 37747.2 | 37.44 | 0 | 33.5974 | 2.05873 | 0.000890063 | 0 | -2 | -0 |
| 4 | 7645 | 3 | 20.1926 | 2155.04 | 12.56 | 2.44046 | 3.8732 | 0.237336 | 0.00179728 | 1e-06 | 0 | |
| 5 | 7622 | 2 | 13.5575 | 151.071 | 12.54 | 3.6911 | -3.0255 | -0.182446 | -0.0200271 | 0 | -1 | -0 |
| 5 | 7645 | 3 | 16.8601 | 129.956 | 17.2667 | 0.392891 | 0.277071 | 0.0167081 | 0.00213203 | 0 | -1 | -0 |
| 5 | 7946 | 3 | 45.4678 | 1324.56 | 23.9167 | 5.08445 | 28.8848 | 1.74183 | 0.0218071 | 4e-06 | 0 | |
| 6 | 7622 | 2 | 34.9168 | 37747.2 | 22.38 | 0 | 18.5201 | 1.1295 | 0.000490634 | 0 | -2 | -0 |
| 7 | 7622 | 1 | 29.9168 | 37747.2 | 17.31 | 0 | 13.2769 | 0.79789 | 0.000351731 | 0 | -2 | -0 |
| 7 | 7645 | 3 | 29.6874 | 645.228 | 19.02 | 2.57853 | 13.0475 | 0.784105 | 0.0202215 | 6e-06 | 0 | |
| 8 | 7627 | 4 | -0.046769 | 1.74688 | 17.0425 | 1.5453 | -16.349 | -1.00287 | -9.35896 | 0.050738 | 0 | |
| 9 | 7622 | 2 | 17.3893 | 54.9986 | 16.865 | 1.46725 | 1.00228 | 0.0611632 | 0.0182238 | 0 | -1 | -0 |
| 9 | 7645 | 2 | 16.5575 | 151.071 | 15.55 | 3.77595 | 0.17046 | 0.0104021 | 0.00112835 | 0 | -1 | -0 |
| 10 | 7622 | 2 | 32.9623 | 137.425 | 32.35 | 3.59917 | 16.4056 | 0.990877 | 0.119379 | 0 | -1 | -0 |
| 10 | 7645 | 3 | 19.1728 | 743.2 | 22.1733 | 1.75961 | 2.61617 | 0.158013 | 0.00352014 | 0 | -1 | -0 |
| 12 | 7622 | 1 | 47.9168 | 37747.2 | 35 | 0 | 31.5732 | 1.93184 | 0.000836439 | 0 | -2 | -0 |
| 12 | 7627 | 3 | 29.4881 | 687.446 | 22.0133 | 1.84261 | 13.1445 | 0.804259 | 0.0191208 | 1e-06 | 0 | |
| 12 | 7645 | 1 | 34.9168 | 37747.2 | 21.65 | 0 | 18.5732 | 1.13642 | 0.000492043 | 0 | -2 | -0 |
| 13 | 7622 | 2 | 16.3893 | 54.9986 | 15.7 | 1.27279 | 0.331535 | 0.0206463 | 0.00602805 | 0 | -1 | -0 |
| 13 | 7946 | 3 | 42.6037 | 3930.01 | 23.3933 | 4.51864 | 26.5459 | 1.65315 | 0.00675467 | 1e-06 | 0 | |
| 15 | 7622 | 3 | 24.4761 | 512.419 | 16.5033 | 2.19761 | 8.42072 | 0.52448 | 0.0164333 | 7e-06 | 0 | |
| 16 | 7622 | 3 | 32.3934 | 702.242 | 23.34 | 2.79793 | 16.2007 | 1.00049 | 0.0230699 | 3e-06 | 0 | |
| 17 | 7622 | 2 | 27.8664 | 409.688 | 24.895 | 10.3556 | 11.8176 | 0.736349 | 0.0288453 | 0 | -1 | -0 |
| 17 | 7645 | 4 | 66.9798 | 75.7947 | 16.155 | 1.47708 | 50.931 | 3.1735 | 0.67196 | 0.293459 | 0 | |
| 18 | 7622 | 3 | 26.6959 | 399.389 | 20.53 | 1.5439 | 10.4387 | 0.642099 | 0.0261367 | 7e-06 | 0 | |
| 18 | 7645 | 2 | 22.3893 | 54.9986 | 22.235 | 1.41068 | 6.13216 | 0.377197 | 0.111497 | 0 | -1 | -0 |
| 19 | 7622 | 4 | 21.6959 | 399.389 | 12.1925 | 3.18653 | 5.41659 | 0.332729 | 0.0135622 | 7e-06 | 0 | |
| 20 | 7622 | 3 | 56.9131 | 1527.33 | 28.0633 | 6.67613 | 40.5204 | 2.47186 | 0.0265302 | 0 | 0 | |
| 22 | 7622 | 1 | 38.9168 | 37747.2 | 26.13 | 0 | 22.5477 | 1.37746 | 0.000597335 | 0 | -2 | -0 |
| 22 | 7645 | 3 | 42.5498 | 2707.01 | 16.54 | 5.97902 | 26.1807 | 1.59939 | 0.00967142 | 1e-06 | 0 | |
| 23 | 7622 | 1 | 25.9168 | 37747.2 | 13.11 | 0 | 9.67505 | 0.595689 | 0.000256312 | 0 | -2 | -0 |
| 23 | 7645 | 2 | 48.9168 | 37747.2 | 18.815 | 11.9324 | 32.6751 | 2.01179 | 0.000865628 | 0 | -2 | -0 |
| 24 | 7622 | 3 | 27.3603 | 337.937 | 22.08 | 1.54773 | 11.1857 | 0.691562 | 0.0331 | 7e-06 | 0 | |
| 26 | 7622 | 2 | 35.748 | 178.071 | 34.51 | 4.42649 | 19.2703 | 1.16948 | 0.108217 | 0 | -1 | -0 |
| 27 | 7622 | 1 | 51.9168 | 37747.2 | 38.51 | 0 | 35.2925 | 2.12294 | 0.000934969 | 0 | -2 | -0 |
| 28 | 7622 | 2 | 31.7243 | 246.046 | 29.69 | 6.35689 | 15.1352 | 0.912356 | 0.0615134 | 0 | -1 | -0 |
| 29 | 7622 | 1 | 60.9168 | 37747.2 | 48.24 | 0 | 44.1763 | 2.63888 | 0.00117032 | 0 | -2 | -0 |
| 30 | 7622 | 1 | 50.9168 | 37747.2 | 38.17 | 0 | 34.2602 | 2.05686 | 0.000907623 | 0 | -2 | -0 |
| 30 | 7645 | 4 | 75.9818 | 41.5784 | 18.815 | 1.38133 | 59.3252 | 3.56166 | 1.42683 | 0.113972 | 0 | |
| 32 | 7622 | 5 | 24.9505 | 4.93462 | 26.09 | 1.52163 | 7.85166 | 0.459191 | 1.59114 | 0 | 0 | |
| 32 | 7645 | 4 | 48.0022 | 1491.63 | 19.7425 | 6.86818 | 30.9034 | 1.80733 | 0.0207178 | 6e-06 | 0 | |
| 33 | 7627 | 3 | 19.9859 | 69.2489 | 11.93 | 6.48611 | 2.9109 | 0.170477 | 0.0420354 | 0 | -1 | -0 |
| 34 | 7622 | 3 | 68.7494 | 3390.99 | 31.51 | 8.39737 | 51.8558 | 3.06954 | 0.0152922 | 0 | 0 | |
| 34 | 7645 | 3 | 24.5813 | 82.9206 | 16.9033 | 6.11957 | 7.68764 | 0.455061 | 0.0927109 | 0 | -1 | -0 |
| 35 | 7622 | 3 | 49.3223 | 2175.28 | 21.9033 | 6.19134 | 32.5242 | 1.93618 | 0.0149517 | 1e-06 | 0 | |
| 36 | 7622 | 3 | 16.1445 | 28.6589 | 15.7667 | 0.308989 | -1.07532 | -0.0624468 | -0.0375214 | 0 | -1 | -0 |
| 37 | 7622 | 2 | 32.9147 | 273.193 | 31.215 | 6.95439 | 16.2055 | 0.969848 | 0.0593187 | 0 | -1 | -0 |
| 37 | 7645 | 2 | 49.8183 | 545.975 | 46.055 | 14.2659 | 33.109 | 1.98148 | 0.060642 | 0 | -1 | -0 |
| 38 | 7622 | 2 | 20.5575 | 151.071 | 19.525 | 3.90677 | 3.37213 | 0.19622 | 0.0223215 | 0 | -1 | -0 |
| 39 | 7622 | 3 | 33.3433 | 939.526 | 21.6167 | 2.76205 | 15.3775 | 0.855935 | 0.0163673 | 2e-06 | 0 | |
| 39 | 7946 | 4 | 26.9223 | 287.431 | 16.6275 | 5.37088 | 8.95656 | 0.498535 | 0.0311608 | 6e-06 | 0 | |
| 40 | 7622 | 2 | 17.7005 | 313.888 | 15.195 | 8.17062 | -2.2571 | -0.113095 | -0.00719078 | 0 | -1 | -0 |
| 40 | 7645 | 4 | 67.9168 | 37747.2 | 15.195 | 11.534 | 47.9593 | 2.40306 | 0.00127054 | 0 | -2 | -0 |
| 40 | 7946 | 5 | 45.4468 | 1188.63 | 13.644 | 6.59569 | 25.4893 | 1.27717 | 0.0214442 | 7e-06 | 0 |
Known Bad Fit Eta-Fills
| Eta | Fill | # of Events | Peak | Peak Error | Mean | Mean Error | Deviation | Ratio of Deviation to Mean | Weighted Deviation | Chi^2 | DOF | Chi^2/DOF |
|---|---|---|---|---|---|---|---|---|---|---|---|---|
| 1 | 7645 | 5 | -162.295 | 746.584 | 32.712 | 5.37511 | -181.244 | -9.56504 | -0.242765 | 0.354344 | 1 | 0.354344 |
| 2 | 7658 | 16 | -722.823 | 6129.87 | 24.5693 | 3.63959 | -740.154 | -42.709 | -0.120745 | 0.462132 | 11 | 0.042012 |
| 2 | 7865 | 23 | -253.136 | 756.103 | 25.8178 | 5.72682 | -270.466 | -15.6067 | -0.357711 | 4.06701 | 11 | 0.369728 |
| 3 | 7641 | 31 | -374.64 | 897.542 | 38.8548 | 6.93628 | -391.09 | -23.7738 | -0.435735 | 1.9264 | 18 | 0.107022 |
| 3 | 7645 | 5 | -39.006 | 97.6639 | 11.87 | 3.97764 | -55.4564 | -3.37112 | -0.56783 | 0.158935 | 1 | 0.158935 |
| 3 | 7865 | 40 | -169.356 | 232.162 | 22.4665 | 2.39787 | -185.806 | -11.2949 | -0.80033 | 7.76637 | 20 | 0.388319 |
| 4 | 7632 | 38 | -69.6698 | 90.1208 | 22.4366 | 1.70706 | -85.9892 | -5.26913 | -0.954156 | 7.31369 | 19 | 0.384931 |
| 4 | 7637 | 26 | -363.683 | 940.243 | 24.9231 | 3.20896 | -380.003 | -23.2853 | -0.404154 | 3.28437 | 17 | 0.193198 |
| 4 | 7651 | 10 | -33.4488 | 140.74 | 24.776 | 2.46974 | -49.7683 | -3.04963 | -0.353618 | 0.581991 | 5 | 0.116398 |
| 5 | 7646 | 17 | -503.214 | 2997.59 | 23.5318 | 2.79526 | -519.797 | -31.3451 | -0.173405 | 1.69467 | 11 | 0.154061 |
| 6 | 7627 | 10 | -295.23 | 760.307 | 20.544 | 2.62396 | -311.627 | -19.0054 | -0.40987 | 0.446146 | 6 | 0.0743577 |
| 6 | 7674 | 14 | -96.908 | 3408.75 | 28.9307 | 8.25457 | -113.305 | -6.91019 | -0.0332394 | 0.465872 | 9 | 0.0517636 |
| 7 | 7630 | 33 | -554.342 | 3038.44 | 26.2752 | 2.20018 | -570.982 | -34.3139 | -0.187919 | 9.20749 | 16 | 0.575468 |
| 7 | 7646 | 16 | -110.274 | 431.234 | 20.8362 | 1.78132 | -126.914 | -7.62709 | -0.294305 | 1.93863 | 8 | 0.242328 |
| 7 | 7652 | 51 | -63.1174 | 8.82568 | 27.4572 | 3.27111 | -79.7574 | -4.79312 | -9.03697 | 5.53314 | 24 | 0.230547 |
| 7 | 7657 | 24 | -122.051 | 26.2778 | 25.4733 | 4.28524 | -138.691 | -8.33482 | -5.27788 | 2.68334 | 11 | 0.24394 |
| 7 | 7658 | 20 | -79.6501 | 176.21 | 19.1015 | 1.94428 | -96.29 | -5.78667 | -0.546451 | 2.27219 | 10 | 0.227219 |
| 7 | 7946 | 16 | -497.928 | 2426.77 | 20.7481 | 3.74721 | -514.568 | -30.9236 | -0.212038 | 1.9861 | 8 | 0.248263 |
| 8 | 7622 | 5 | -73.9891 | 288.33 | 29.554 | 4.77487 | -90.2914 | -5.53859 | -0.313153 | 0.317716 | 1 | 0.317716 |
| 9 | 7637 | 23 | -23.3765 | 43.0642 | 23.6261 | 2.94623 | -39.7635 | -2.42652 | -0.923355 | 3.73794 | 9 | 0.415327 |
| 9 | 7641 | 34 | -659.53 | 2779.98 | 42.2934 | 5.90999 | -675.917 | -41.247 | -0.243137 | 4.09492 | 18 | 0.227495 |
| 9 | 7658 | 11 | -348.271 | 1989.46 | 21.4355 | 3.70182 | -364.658 | -22.2528 | -0.183294 | 0.828885 | 6 | 0.138148 |
| 9 | 7674 | 27 | -242.607 | 529.234 | 25.513 | 2.80218 | -258.995 | -15.8048 | -0.489376 | 4.26093 | 16 | 0.266308 |
| 10 | 7658 | 20 | -355.279 | 979.405 | 30.3755 | 4.87389 | -371.836 | -22.4584 | -0.379655 | 1.51073 | 12 | 0.125894 |
| 10 | 7946 | 7 | -369.586 | 2084.62 | 22.9771 | 5.59187 | -386.143 | -23.3225 | -0.185234 | 0.416222 | 3 | 0.138741 |
| 11 | 7646 | 14 | -651.061 | 6665 | 21.7621 | 3.46293 | -667.405 | -40.8362 | -0.100136 | 1.67592 | 8 | 0.20949 |
| 11 | 7657 | 17 | -0.020992 | 1129.16 | 22.9953 | 3.29588 | -16.3645 | -1.00128 | -0.0144926 | 1.28801 | 11 | 0.117091 |
| 12 | 7646 | 27 | -66.9036 | 96.3096 | 27.0719 | 4.94485 | -83.2472 | -5.09357 | -0.864371 | 3.7794 | 12 | 0.31495 |
| 12 | 7658 | 17 | -352.274 | 1851.26 | 24.2812 | 3.09065 | -368.618 | -22.5543 | -0.199117 | 1.2523 | 12 | 0.104358 |
| 12 | 7674 | 22 | -201.555 | 616.238 | 21.4473 | 2.20073 | -217.899 | -13.3324 | -0.353595 | 4.13012 | 11 | 0.375465 |
| 12 | 7685 | 18 | -58.89 | 473.895 | 23.0772 | 2.80612 | -75.2335 | -4.60324 | -0.158756 | 1.76284 | 10 | 0.176284 |
| 13 | 7630 | 21 | -2.18303 | 660.259 | 19.6248 | 2.5076 | -18.2408 | -1.13595 | -0.0276268 | 1.66467 | 14 | 0.118905 |
| 13 | 7651 | 14 | -40.2844 | 644.74 | 20.7679 | 2.1083 | -56.3422 | -3.50871 | -0.0873874 | 1.22913 | 8 | 0.153641 |
| 14 | 7646 | 23 | -146.948 | 256.444 | 25.8796 | 3.32407 | -163.305 | -9.98407 | -0.636804 | 2.99729 | 13 | 0.230561 |
| 14 | 7674 | 25 | -115.355 | 186.193 | 26.6272 | 3.77843 | -131.712 | -8.05255 | -0.707394 | 5.4276 | 11 | 0.493418 |
| 15 | 7637 | 24 | -155.96 | 617.27 | 20.2467 | 1.79252 | -172.015 | -10.7139 | -0.278671 | 4.16486 | 12 | 0.347071 |
| 15 | 7651 | 12 | -376.867 | 2201.05 | 33.7325 | 6.98286 | -392.922 | -24.473 | -0.178516 | 0.436896 | 7 | 0.0624137 |
| 15 | 7685 | 12 | -205.157 | 636.094 | 24.445 | 3.55647 | -221.213 | -13.7781 | -0.347767 | 1.06052 | 6 | 0.176753 |
| 15 | 7946 | 11 | -179.666 | 986.897 | 16.9745 | 1.93131 | -195.722 | -12.1904 | -0.19832 | 0.828924 | 6 | 0.138154 |
| 16 | 7630 | 38 | -13.7496 | 20.1048 | 23.2105 | 2.72527 | -29.9423 | -1.84912 | -1.48932 | 6.2739 | 16 | 0.392118 |
| 16 | 7641 | 33 | -319.069 | 712.412 | 33.6773 | 4.70495 | -335.262 | -20.7044 | -0.470601 | 4.75977 | 18 | 0.264432 |
| 16 | 7646 | 18 | -436.452 | 1720.29 | 25.8117 | 3.70441 | -452.644 | -27.9535 | -0.263121 | 2.77884 | 10 | 0.277884 |
| 16 | 7652 | 45 | -78.8639 | 83.2954 | 22.13 | 1.57156 | -95.0566 | -5.87031 | -1.1412 | 8.9961 | 20 | 0.449805 |
| 16 | 7657 | 28 | -194.305 | 428.471 | 19.8111 | 2.54414 | -210.497 | -12.9995 | -0.491276 | 4.37847 | 14 | 0.312748 |
| 16 | 7674 | 29 | -61.8334 | 746.317 | 20.1734 | 1.66547 | -78.0262 | -4.81858 | -0.104548 | 4.31681 | 14 | 0.308343 |
| 16 | 7685 | 18 | -190.094 | 562.809 | 23.7067 | 4.269 | -206.287 | -12.7394 | -0.366531 | 1.89479 | 9 | 0.210532 |
| 17 | 7637 | 23 | -228.508 | 577.181 | 22.8991 | 2.79759 | -244.557 | -15.2383 | -0.423709 | 2.5927 | 14 | 0.185193 |
| 17 | 7641 | 36 | -97.158 | 156.761 | 31.3769 | 4.31425 | -113.207 | -7.05389 | -0.722161 | 7.21073 | 16 | 0.450671 |
| 17 | 7642 | 40 | -179.774 | 265.176 | 25.4625 | 2.93833 | -195.823 | -12.2017 | -0.738465 | 8.54683 | 20 | 0.427342 |
| 17 | 7657 | 18 | -236.913 | 758.04 | 24.6456 | 2.83649 | -252.962 | -15.762 | -0.333705 | 1.5273 | 11 | 0.138846 |
| 18 | 7646 | 13 | -255.732 | 1933.77 | 20.3354 | 2.0078 | -271.989 | -16.7304 | -0.140652 | 3.09005 | 6 | 0.515009 |
| 18 | 7657 | 17 | -428.934 | 1888.67 | 25.5253 | 3.60838 | -445.191 | -27.3843 | -0.235717 | 2.54822 | 10 | 0.254822 |
| 18 | 7685 | 16 | -97.6688 | 309.225 | 22.605 | 4.25345 | -113.926 | -7.00773 | -0.368424 | 2.59056 | 6 | 0.43176 |
| 19 | 7651 | 10 | -654.199 | 387.385 | 27.182 | 5.44986 | -670.478 | -41.1859 | -1.73078 | 0.460313 | 6 | 0.0767188 |
| 19 | 7865 | 33 | -56.4801 | 71.7536 | 22.6976 | 1.60707 | -72.7594 | -4.46944 | -1.01402 | 5.9763 | 17 | 0.351547 |
| 19 | 7946 | 13 | -484.356 | 3467.84 | 21.2585 | 3.19716 | -500.636 | -30.7529 | -0.144365 | 0.454576 | 9 | 0.0505084 |
| 20 | 7641 | 30 | -136.045 | 284.353 | 27.5355 | 2.87934 | -152.438 | -9.29917 | -0.536088 | 4.84212 | 15 | 0.322808 |
| 20 | 7658 | 27 | -93.8957 | 23.9295 | 22.02 | 2.51149 | -110.288 | -6.72791 | -4.60889 | 3.96436 | 13 | 0.304951 |
| 20 | 7674 | 23 | -325.92 | 1118.85 | 23.2752 | 2.8774 | -342.313 | -20.8821 | -0.30595 | 4.01796 | 13 | 0.309074 |
| 21 | 0 | 36 | -129.668 | 214.379 | 29.6667 | 3.92157 | -146.248 | -8.82097 | -0.682193 | 6.78311 | 17 | 0.399006 |
| 21 | 7641 | 39 | -144.034 | 245.098 | 23.5859 | 2.64618 | -160.613 | -9.6874 | -0.655302 | 8.44895 | 20 | 0.422448 |
| 21 | 7685 | 23 | -254.419 | 715.596 | 32.5057 | 4.84377 | -270.999 | -16.3453 | -0.378704 | 1.52688 | 14 | 0.109063 |
| 21 | 7946 | 7 | -132.807 | 630.403 | 20.2443 | 2.60807 | -149.387 | -9.01029 | -0.236971 | 1.17921 | 2 | 0.589604 |
| 22 | 7630 | 35 | -149.413 | 265.018 | 32.8674 | 4.75751 | -165.782 | -10.1277 | -0.625552 | 4.55739 | 16 | 0.284837 |
| 22 | 7641 | 35 | -102.509 | 142.989 | 23.2589 | 2.69187 | -118.878 | -7.26235 | -0.831381 | 5.64378 | 16 | 0.352736 |
| 22 | 7658 | 19 | -20.0999 | 1934.26 | 27.6505 | 5.17233 | -36.469 | -2.22792 | -0.0188543 | 1.30114 | 12 | 0.108428 |
| 23 | 7637 | 11 | -127.375 | 355.062 | 24.8082 | 3.01167 | -143.616 | -8.8424 | -0.404482 | 0.982009 | 4 | 0.245502 |
| 23 | 7642 | 35 | -67.4556 | 93.3874 | 23.624 | 2.54298 | -83.6974 | -5.15322 | -0.896239 | 3.89249 | 18 | 0.21625 |
| 23 | 7658 | 20 | -433.532 | 2027.93 | 26.901 | 3.11484 | -449.774 | -27.6924 | -0.221789 | 3.36641 | 12 | 0.280534 |
| 23 | 7674 | 24 | -254.55 | 549.111 | 25.8917 | 3.11687 | -270.792 | -16.6726 | -0.493146 | 2.58567 | 15 | 0.172378 |
| 23 | 7685 | 24 | -253.079 | 646.915 | 23.3354 | 3.33867 | -269.32 | -16.582 | -0.416315 | 4.10568 | 12 | 0.34214 |
| 24 | 7632 | 45 | -158.492 | 211.445 | 23.4044 | 2.42658 | -174.666 | -10.7988 | -0.826059 | 13.4837 | 18 | 0.749092 |
| 24 | 7637 | 15 | -357.397 | 1978.04 | 25.224 | 2.85512 | -373.572 | -23.0962 | -0.18886 | 0.870183 | 10 | 0.0870183 |
| 24 | 7641 | 37 | -116.445 | 122.043 | 25.5168 | 2.40134 | -132.62 | -8.19927 | -1.08667 | 6.36603 | 18 | 0.353668 |
| 24 | 7674 | 23 | -485.496 | 2958.4 | 26.5217 | 5.55673 | -501.67 | -31.016 | -0.169575 | 3.55596 | 14 | 0.253997 |
| 24 | 7685 | 21 | -195.378 | 629.346 | 34.9771 | 8.50666 | -211.552 | -13.0793 | -0.336146 | 1.93596 | 13 | 0.14892 |
| 25 | 7646 | 11 | -723.282 | 5759.22 | 30.9645 | 5.17808 | -739.958 | -44.3718 | -0.128482 | 0.450996 | 7 | 0.064428 |
| 25 | 7652 | 46 | -88.7993 | 115.155 | 21.1983 | 1.6516 | -105.476 | -6.32487 | -0.915943 | 11.4329 | 21 | 0.544422 |
| 25 | 7946 | 10 | -82.8525 | 3548.05 | 23.112 | 3.37436 | -99.5289 | -5.96827 | -0.0280517 | 0.462346 | 6 | 0.0770577 |
| 26 | 7642 | 30 | -255.741 | 557.954 | 25.2053 | 2.63638 | -272.218 | -16.5204 | -0.487887 | 6.01531 | 16 | 0.375957 |
| 26 | 7645 | 6 | -264.22 | 1717.19 | 26.8283 | 4.68065 | -280.698 | -17.035 | -0.163463 | 0.410666 | 2 | 0.205333 |
| 26 | 7651 | 20 | -57.5385 | 93.0688 | 25.459 | 2.31391 | -74.0162 | -4.4919 | -0.795284 | 1.13528 | 10 | 0.113528 |
| 26 | 7685 | 16 | -217.928 | 693.073 | 26.8181 | 4.42709 | -234.406 | -14.2257 | -0.338212 | 1.16921 | 9 | 0.129912 |
| 27 | 7645 | 5 | -42.7535 | 15.7492 | 21.56 | 2.76656 | -59.3779 | -3.57174 | -3.77021 | 0.327149 | 1 | 0.327149 |
| 28 | 0 | 34 | -60.801 | 78.2266 | 20.1779 | 2.47752 | -77.3901 | -4.66512 | -0.989307 | 7.0611 | 14 | 0.504364 |
| 28 | 7657 | 17 | -276.485 | 543.431 | 24.8394 | 3.38191 | -293.074 | -17.6667 | -0.539302 | 1.18531 | 11 | 0.107755 |
| 28 | 7658 | 27 | -24.3842 | 3685.73 | 22.5141 | 2.72477 | -40.9733 | -2.4699 | -0.0111167 | 5.18526 | 13 | 0.398866 |
| 28 | 7946 | 7 | -16.3182 | 93.8401 | 34.8329 | 13.2704 | -32.9073 | -1.98367 | -0.350674 | 0.289646 | 2 | 0.144823 |
| 29 | 7630 | 35 | -390.822 | 1555.79 | 22.8891 | 2.0307 | -407.562 | -24.3458 | -0.261965 | 6.45615 | 19 | 0.339797 |
| 29 | 7632 | 56 | -252.127 | 404.405 | 29.6725 | 3.16152 | -268.867 | -16.0608 | -0.664847 | 13.7233 | 25 | 0.548934 |
| 29 | 7685 | 26 | -598.86 | 3563.26 | 24.5262 | 3.06826 | -615.601 | -36.773 | -0.172764 | 4.66493 | 12 | 0.388745 |
| 29 | 7865 | 48 | -3.39389 | 411.141 | 23.4067 | 2.41839 | -20.1345 | -1.20273 | -0.0489722 | 8.73652 | 26 | 0.33602 |
| 30 | 7632 | 36 | -119.673 | 147.381 | 24.6357 | 2.2822 | -136.33 | -8.18473 | -0.925016 | 4.50131 | 19 | 0.236911 |
| 30 | 7637 | 11 | -232.243 | 1395.53 | 21.3164 | 3.03241 | -248.9 | -14.943 | -0.178356 | 0.826994 | 6 | 0.137832 |
| 30 | 7641 | 40 | -71.5027 | 16.6894 | 28.2851 | 3.27136 | -88.1593 | -5.29276 | -5.28236 | 6.43511 | 18 | 0.357506 |
| 30 | 7642 | 46 | -64.1883 | 61.6896 | 24.0633 | 2.6442 | -80.8449 | -4.85363 | -1.31051 | 8.78536 | 21 | 0.418351 |
| 30 | 7946 | 8 | -54.9849 | 42.0146 | 24.4337 | 3.14607 | -71.6415 | -4.30109 | -1.70516 | 1.00907 | 3 | 0.336358 |
| 31 | 7630 | 25 | -175.922 | 390.279 | 23.0416 | 3.5338 | -192.863 | -11.3838 | -0.494168 | 3.33107 | 13 | 0.256236 |
| 31 | 7646 | 18 | -870.494 | 7475.34 | 30.3167 | 5.75062 | -887.436 | -52.3811 | -0.118715 | 0.906901 | 12 | 0.0755751 |
| 31 | 7652 | 44 | -25.5923 | 149.931 | 24.0795 | 2.69229 | -42.5342 | -2.51059 | -0.283692 | 11.2309 | 16 | 0.701929 |
| 31 | 7657 | 22 | -163.58 | 286.717 | 22.0195 | 4.02157 | -180.522 | -10.6553 | -0.629617 | 2.7093 | 9 | 0.301033 |
| 31 | 7674 | 23 | -394.52 | 1151.58 | 28.1813 | 3.33528 | -411.462 | -24.2867 | -0.357302 | 1.63299 | 16 | 0.102062 |
| 31 | 7946 | 10 | -58.1625 | 236.25 | 18.696 | 1.39311 | -75.1044 | -4.43306 | -0.317903 | 0.745645 | 5 | 0.149129 |
| 33 | 0 | 29 | -373.706 | 1574.15 | 26.2383 | 1.98957 | -390.781 | -22.8861 | -0.248248 | 3.22657 | 19 | 0.169819 |
| 33 | 7645 | 5 | -29.5913 | 152.523 | 18.602 | 1.84523 | -46.6663 | -2.73301 | -0.305962 | 0.312283 | 1 | 0.312283 |
| 33 | 7646 | 21 | -395.034 | 1372.52 | 23.7476 | 3.8076 | -412.109 | -24.1352 | -0.300257 | 2.31314 | 11 | 0.210285 |
| 33 | 7685 | 14 | -110.62 | 270.427 | 22.985 | 3.10041 | -127.695 | -7.47846 | -0.472197 | 2.29729 | 7 | 0.328184 |
| 34 | 0 | 31 | -112.877 | 181.045 | 24.5032 | 2.36277 | -129.771 | -7.68163 | -0.716787 | 4.83591 | 14 | 0.345422 |
| 34 | 7632 | 42 | -65.2592 | 18.6265 | 22.4205 | 1.98273 | -82.1528 | -4.86294 | -4.41052 | 7.7001 | 19 | 0.405269 |
| 34 | 7646 | 21 | -283.059 | 881.691 | 24.8881 | 3.02442 | -299.953 | -17.7553 | -0.340201 | 2.33609 | 13 | 0.1797 |
| 34 | 7652 | 43 | -182.022 | 268.576 | 28.7609 | 4.00109 | -198.915 | -11.7746 | -0.740631 | 5.71241 | 21 | 0.272019 |
| 35 | 7646 | 14 | -305.799 | 1714.64 | 25.8164 | 6.32991 | -322.597 | -19.2044 | -0.188143 | 0.855674 | 8 | 0.106959 |
| 35 | 7657 | 19 | -465.858 | 3872.64 | 23.37 | 3.77318 | -482.657 | -28.7328 | -0.124633 | 0.466595 | 14 | 0.0333282 |
| 36 | 7646 | 22 | -184.621 | 456.623 | 30.015 | 5.38083 | -201.841 | -11.7214 | -0.44203 | 2.40663 | 12 | 0.200552 |
| 37 | 7685 | 11 | -148.529 | 628.472 | 26.1345 | 4.10675 | -165.239 | -9.88904 | -0.262921 | 0.750802 | 6 | 0.125134 |
| 38 | 0 | 36 | -54.4057 | 71.3504 | 20.3419 | 1.48366 | -71.5911 | -4.16581 | -1.00337 | 5.62247 | 15 | 0.374831 |
| 38 | 7630 | 33 | -169.32 | 456.911 | 21.4364 | 2.05789 | -186.505 | -10.8525 | -0.408187 | 3.41462 | 19 | 0.179717 |
| 38 | 7658 | 23 | -17.5239 | 34.9903 | 21.7904 | 2.62754 | -34.7093 | -2.0197 | -0.991969 | 4.69944 | 8 | 0.587431 |
| 39 | 0 | 23 | -100.439 | 221.362 | 18.907 | 3.62077 | -118.405 | -6.59059 | -0.534895 | 1.39118 | 13 | 0.107014 |
| 39 | 7645 | 7 | -12.1538 | 60.6808 | 21.3886 | 1.29229 | -30.1196 | -1.6765 | -0.496361 | 0.270745 | 3 | 0.0902483 |
| 39 | 7685 | 12 | -447.368 | 3097.94 | 24.2233 | 3.86443 | -465.334 | -25.9011 | -0.150208 | 1.25151 | 6 | 0.208585 |
| 40 | 0 | 31 | -158.897 | 255.482 | 23.27 | 4.85951 | -178.855 | -8.96177 | -0.700068 | 3.1161 | 11 | 0.283281 |
| 40 | 7655 | 67 | -129.691 | 221.501 | 23.2605 | 2.88527 | -149.649 | -7.49836 | -0.675613 | 11.5369 | 27 | 0.427293 |
- wwitzke's blog
- Login or register to post comments