- xuanli's home page
- Posts
- 2015
- 2014
- 2013
- December (4)
- November (2)
- October (6)
- September (4)
- August (6)
- July (4)
- June (4)
- May (4)
- April (3)
- March (15)
- February (6)
- January (5)
- 2012
- December (3)
- November (10)
- October (9)
- September (4)
- August (5)
- July (11)
- June (3)
- May (1)
- April (1)
- March (1)
- January (2)
- 2011
- December (3)
- October (4)
- September (3)
- August (3)
- July (2)
- June (6)
- May (13)
- April (7)
- March (10)
- February (2)
- January (1)
- 2010
- 2009
- My blog
- Post new blog entry
- All blogs
EEMC tower SMD raw adc studies
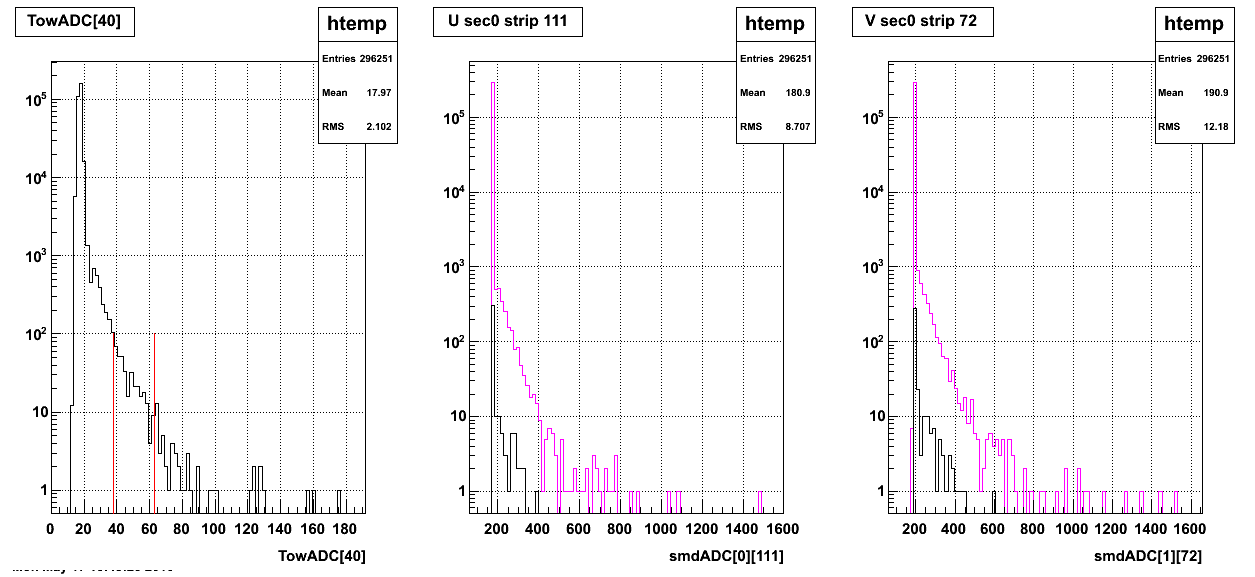
Now I am looking at the raw adc distribution for one tower in sector 0 and set some cuts on the raw adc distribution of the tower to check the raw adc distribution of the ESMD U/V strips which have crossing points near the center of the tower.
I select tow towers and look at two different length U strips.
In the following plots, the red lines in the left panel plot shows the cut in the tower raw adc distribution, and the magenta lined in the right two panels stand for the raw adc distribution without cut for this strip and the black lines stand for the raw adc distribution with this cut of this strip.
(1) run 9057081
Fig 1, U strip 11 with cut 1.
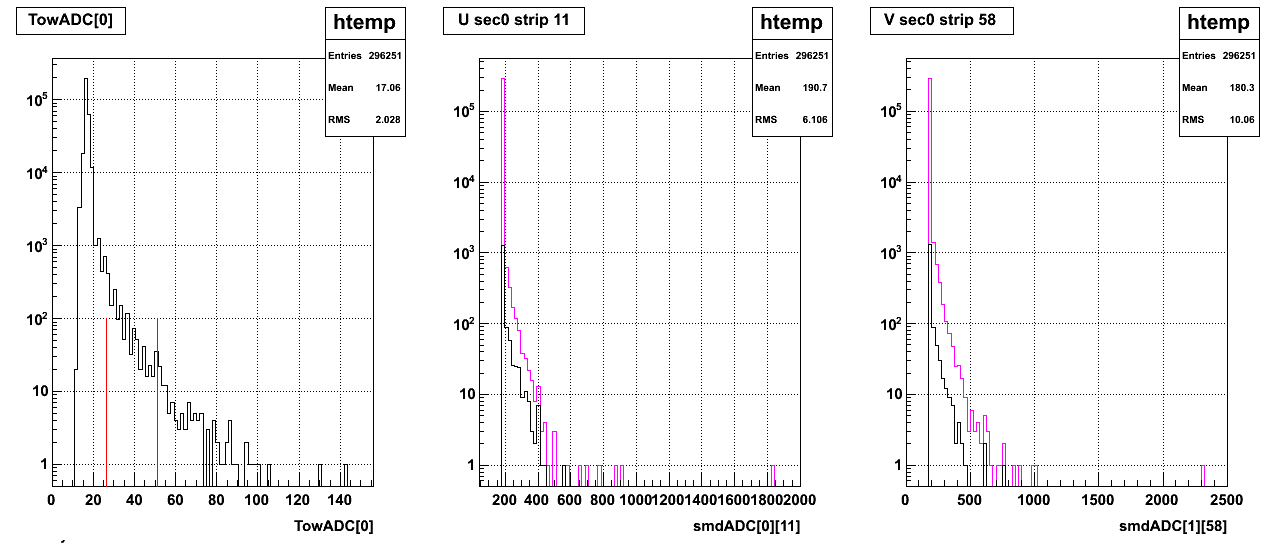
Fig 2, U strip 11 with cut 2.
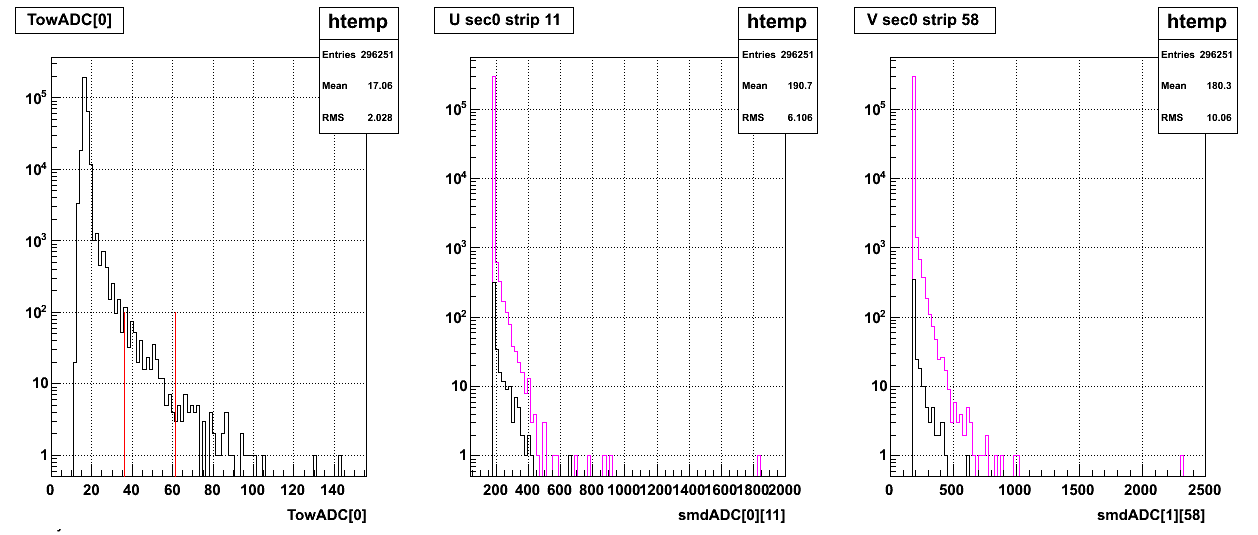
Fig 3, U strip 111 with cut 1.
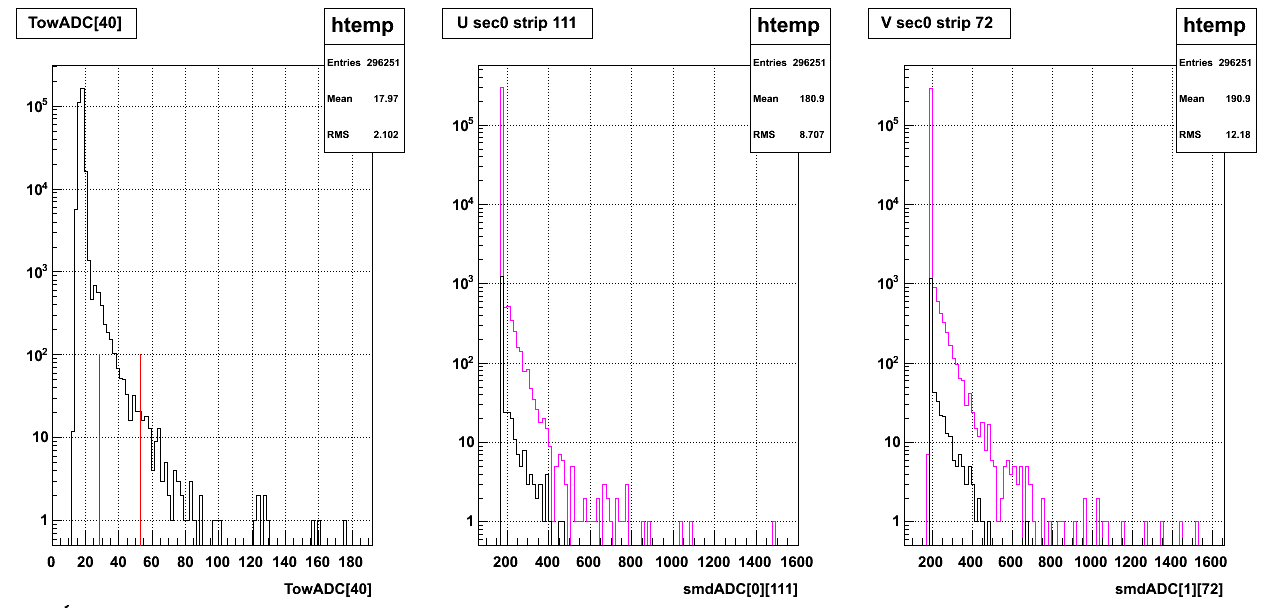
Fig 4, U strip 111 with cut 2.
(2) run 9067020
Fig 5, U strip 11 with cut 1.
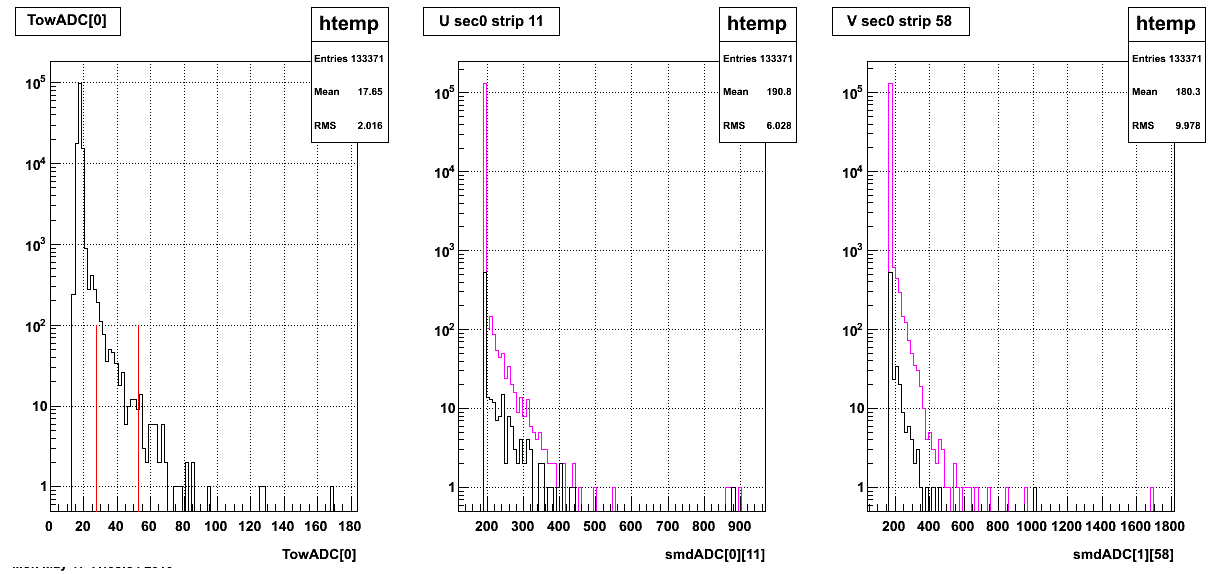
Fig 6, U strip 11 with cut 2.
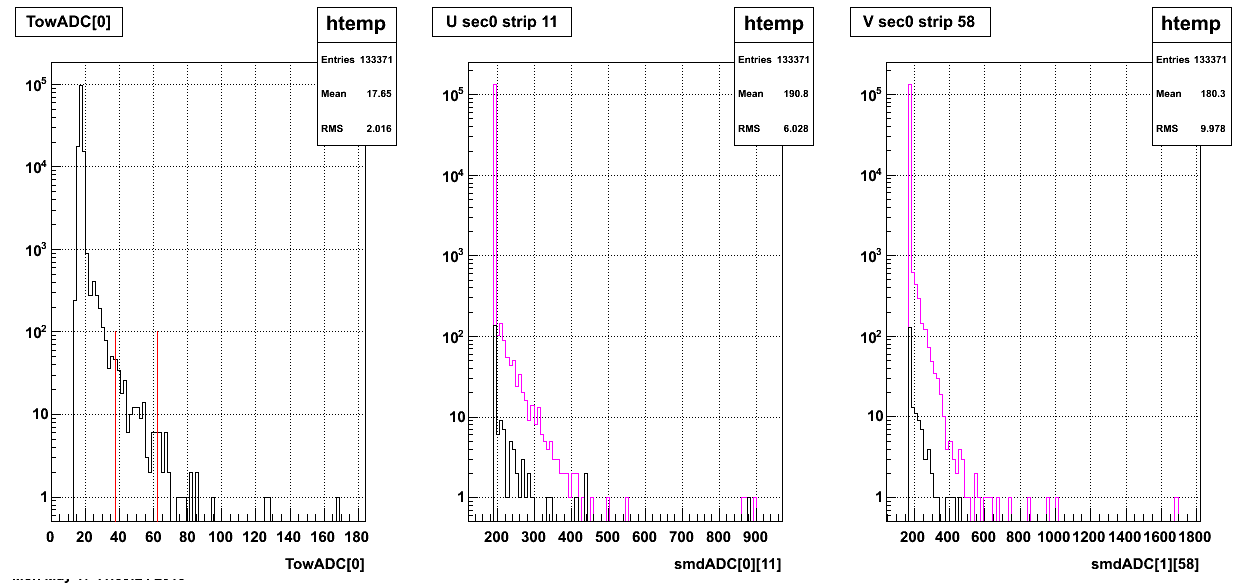
Fig 7, U strip 111 with cut 1.
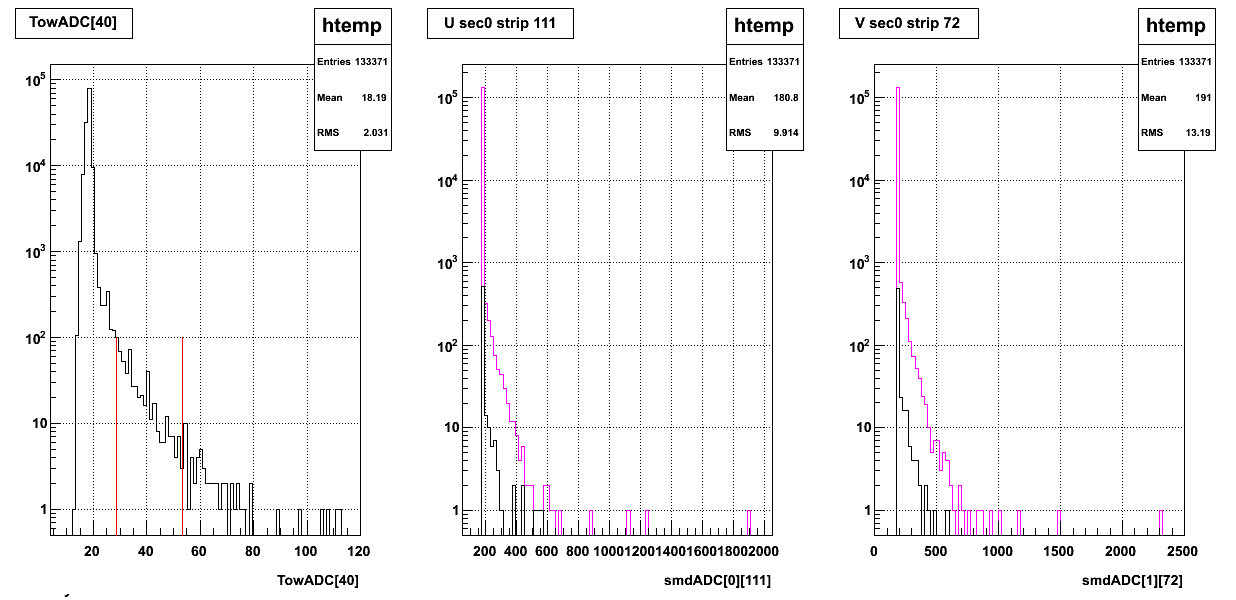
Fig 8, U strip 111 with cut 2.
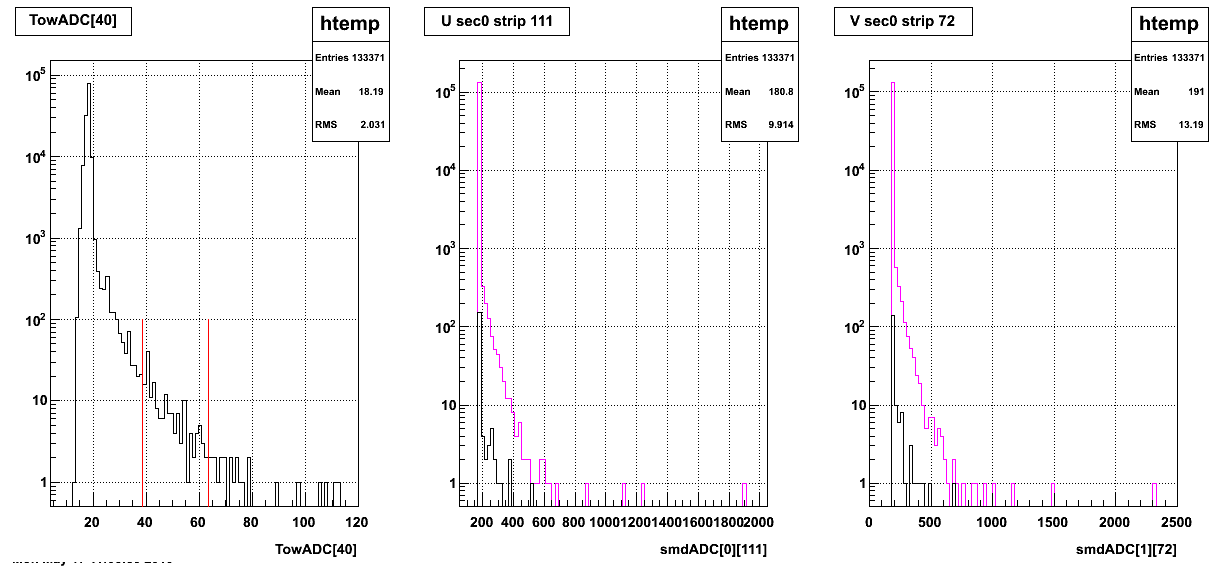
- xuanli's blog
- Login or register to post comments
