d+Au ridge: Charge Identification -- FTPC Eta Dependence for Global Tracks
This page is documentary purpose.
Motivation:
1. FTPC charge identification ability dependence on η acceptance. Larger |η|, worse resolution.
2. FTPC global tracks doesn't have the primary vertex (from TPC) included for reconstruction. Momentum and further the charge would be different for global and primary tracks.
Here we will compare small and large FTPC |η| using global tracks.
For more discussion
on FTPC eta dependence for primary tracks: drupal.star.bnl.gov/STAR/blog/yili/dau-ridge-charge-identification-ftpc-eta-dependence
on FTPC global tracks with all eta acceptance: drupal.star.bnl.gov/STAR/blog/yili/dau-ridge-charge-identification-ftpc-global-tracks-instead-primary-tracks
Method:
Global FTPC tracks pT and η dependence in dihadron correlation for d+Au Ridge study.
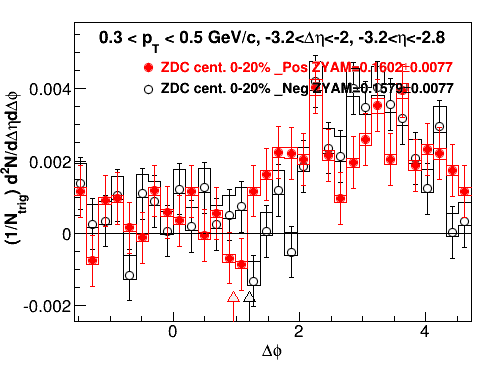
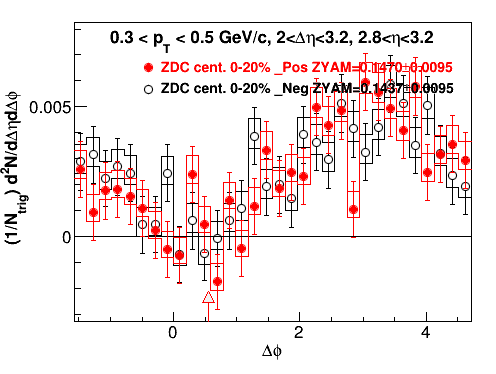
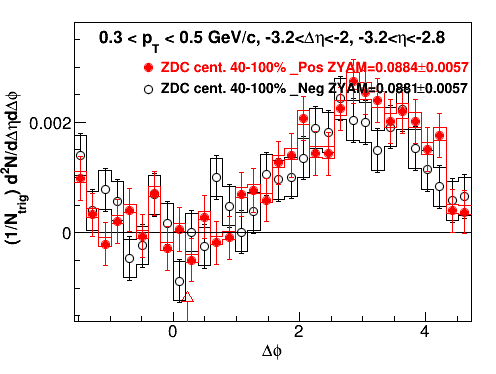
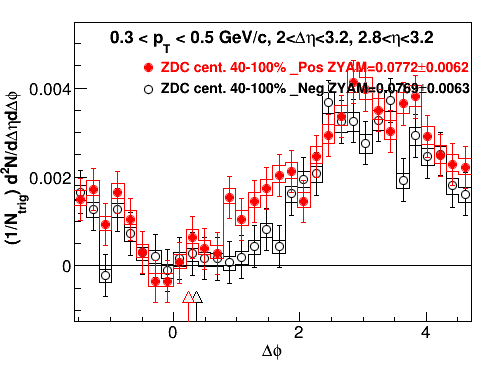
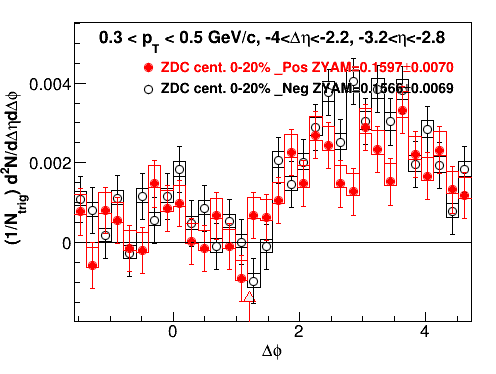
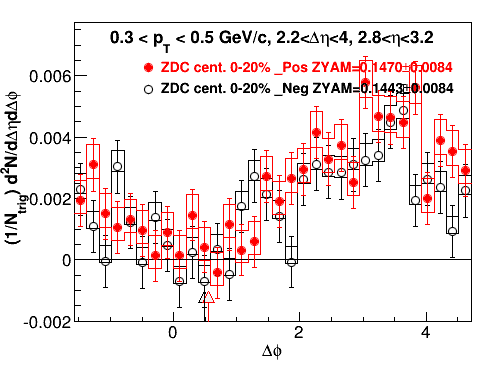
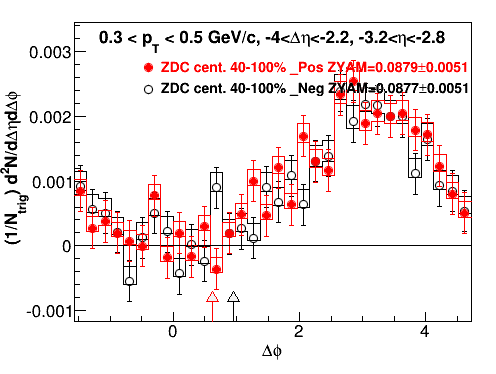
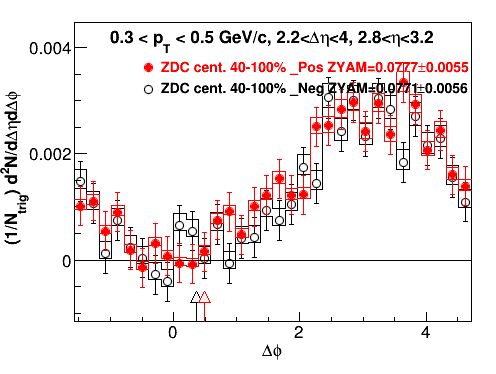
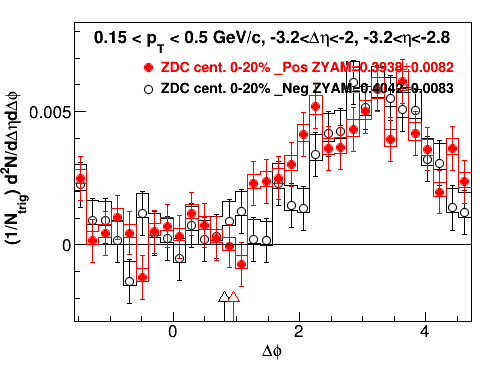
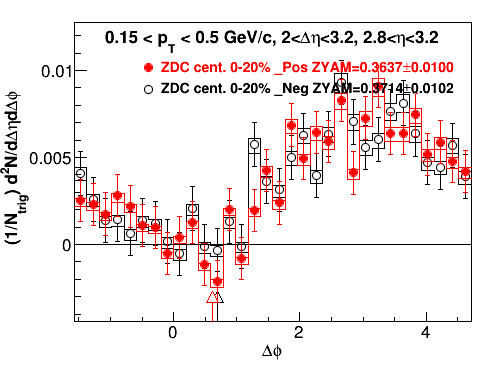
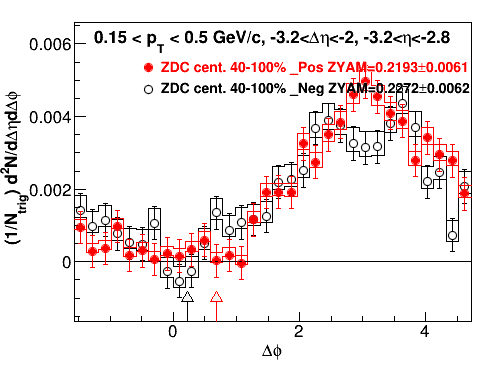
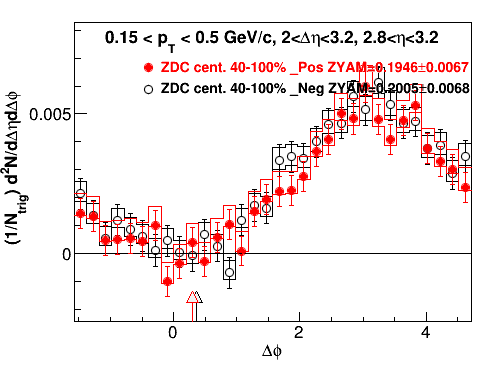
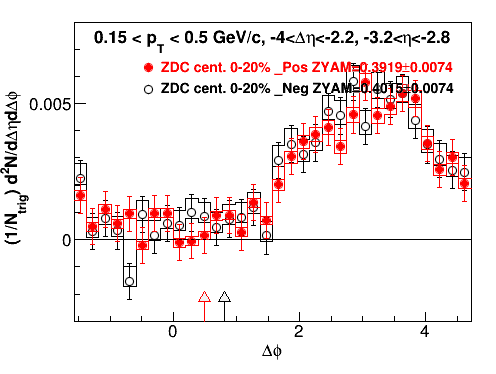
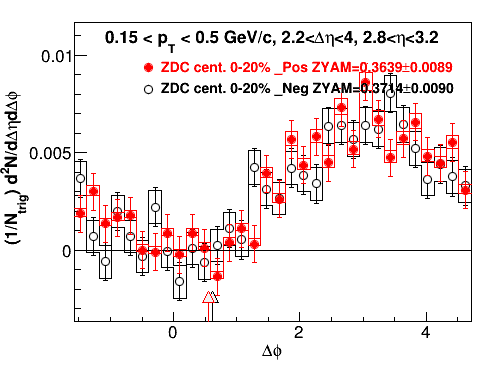
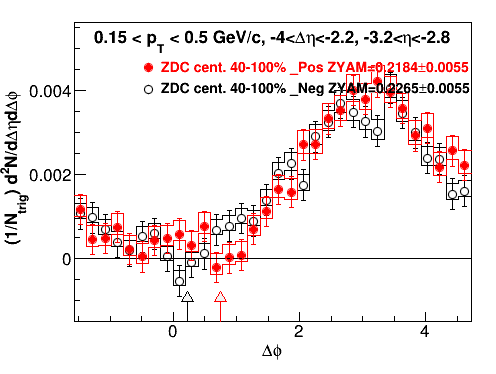
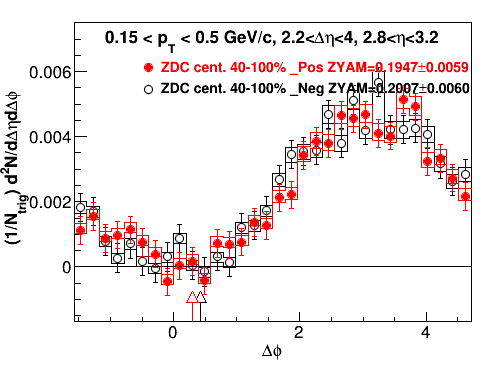
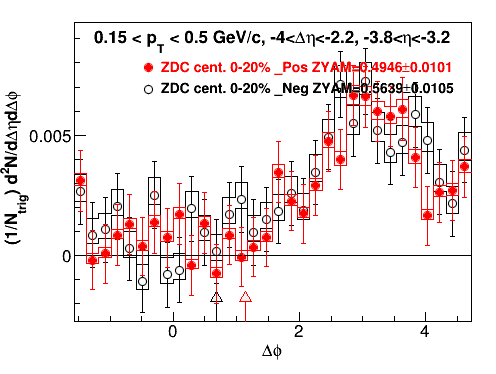
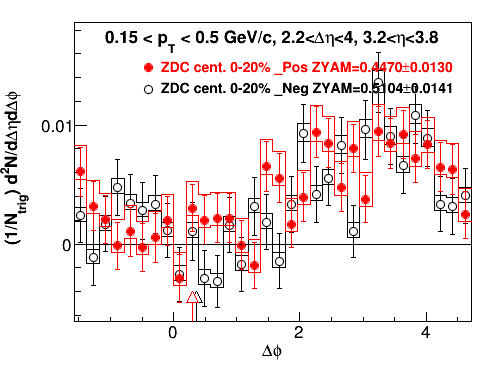
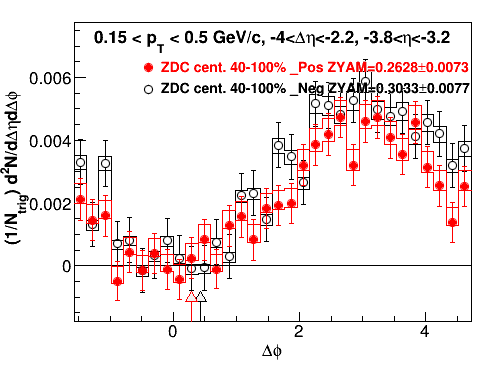
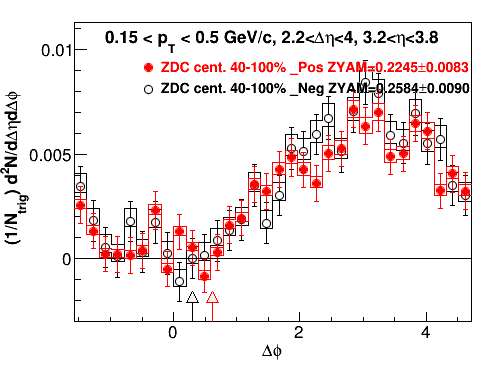
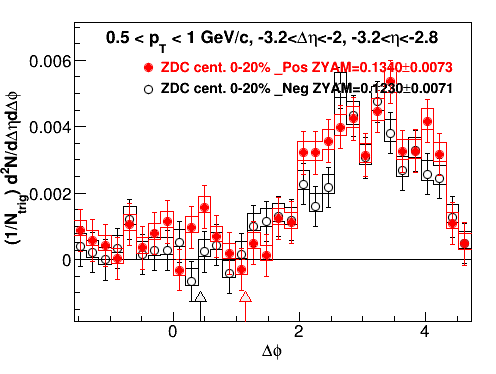
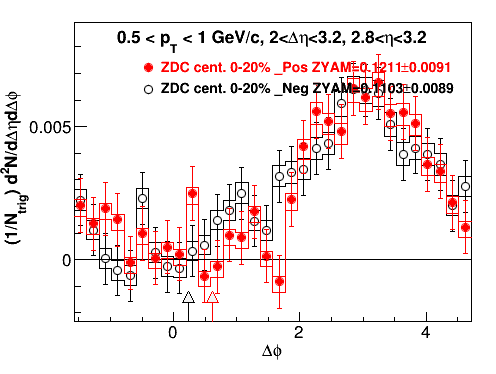
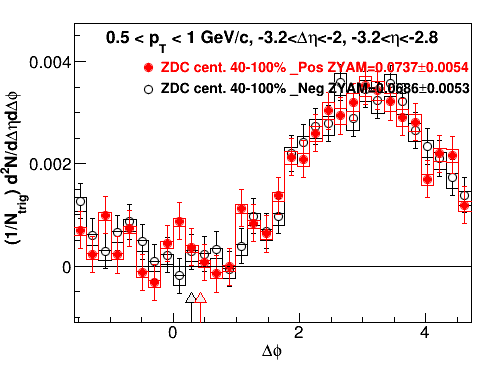
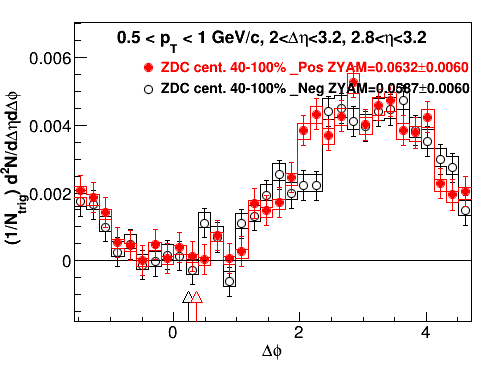
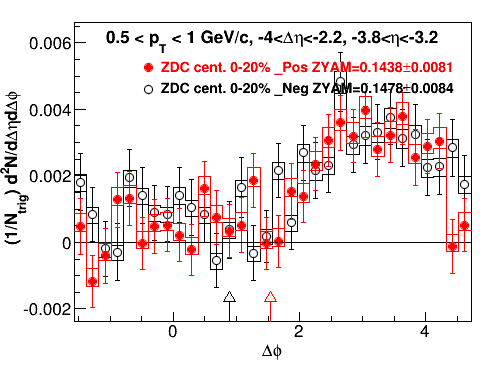
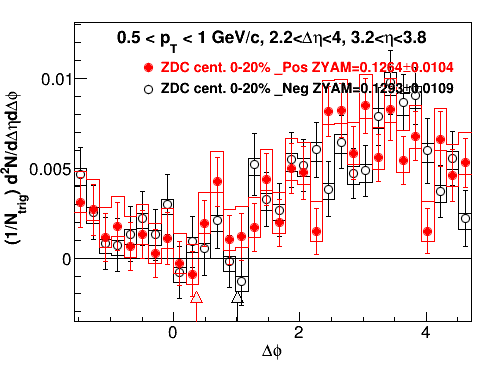
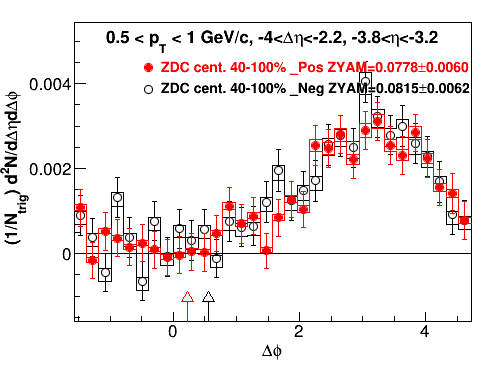
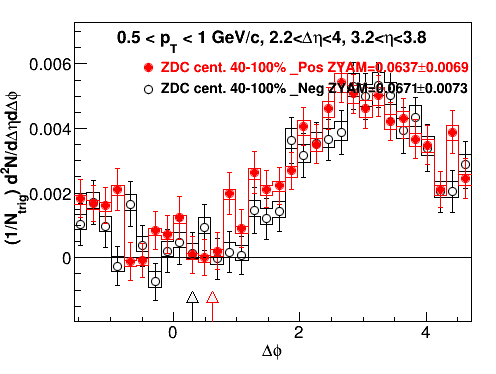
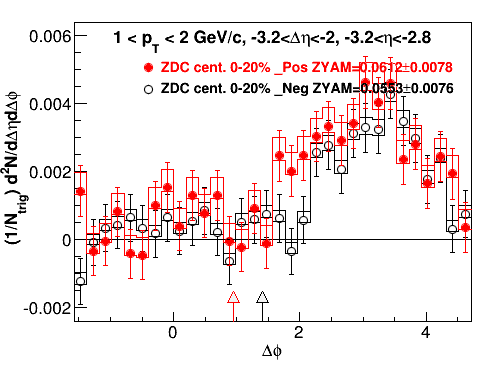
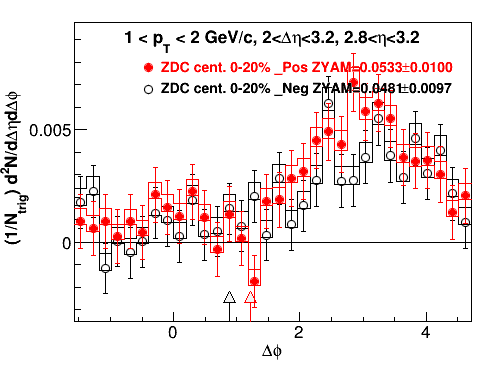
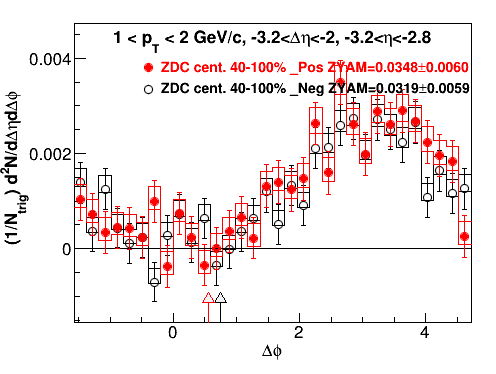
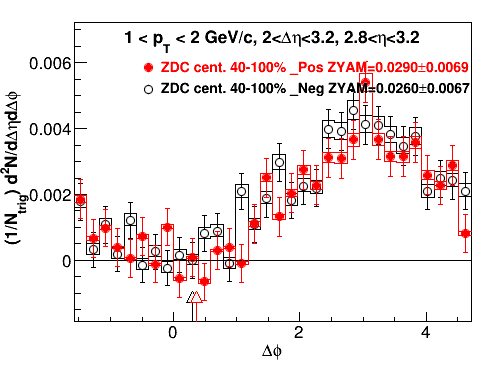
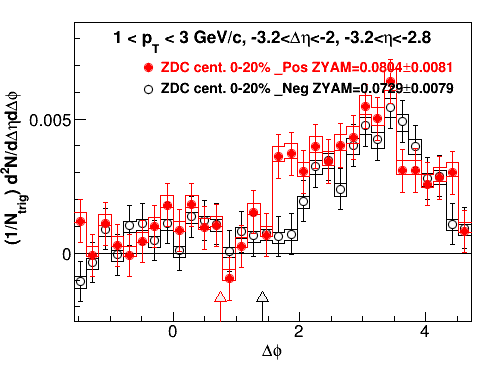
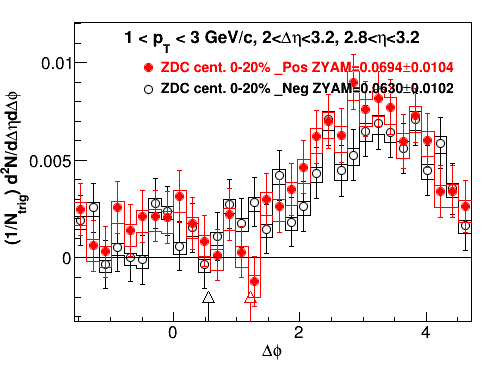
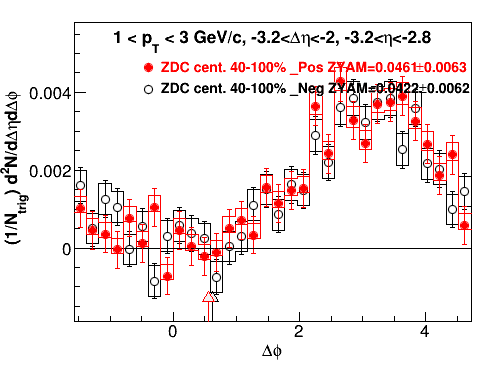
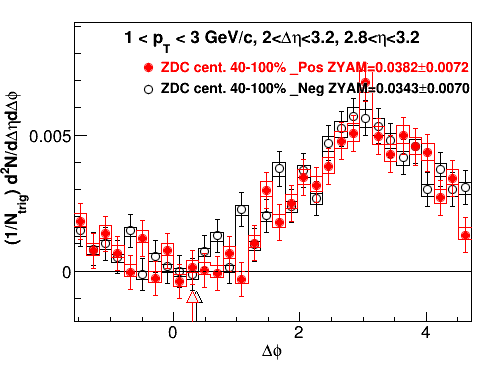
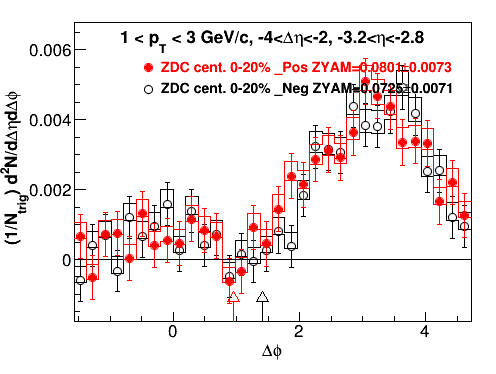
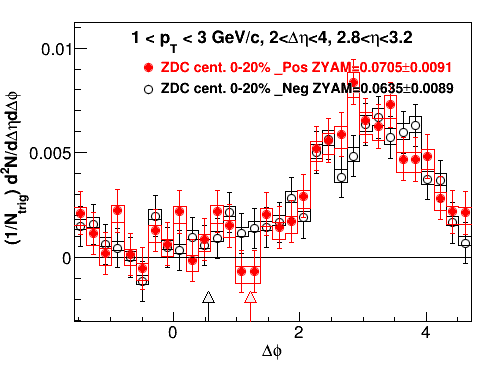
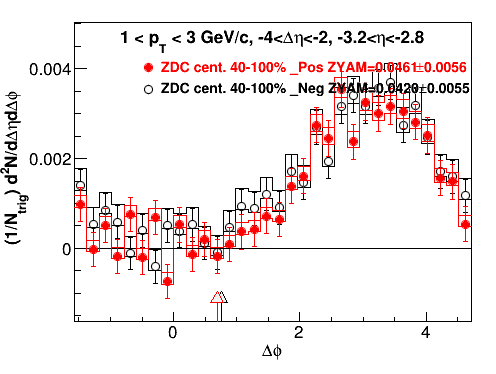
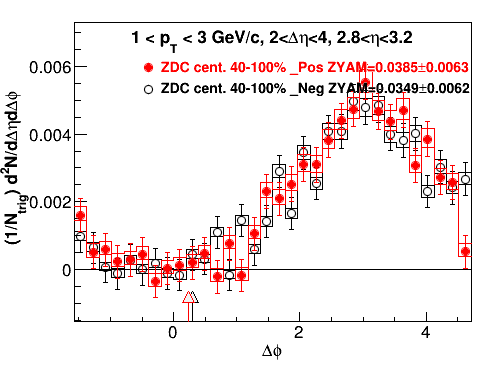
Trigger particle is TPC primary track. Associate particle is FTPC global track. The positive vs negative charge associate particle. The dihadron correlation below shown is ZYAM substracted.
Data set:
Run3
|Vz| < 50 cm
primary track for TPC and global track for FTPC
nHitsFit > 25 points for TPC, 5 points for FTPC
nHitsFit/nHitsPoss >= 51%
globa dca < 3 cm
|eta|<1 for TPC, 2.8<|eta|<3.8 for FTPC
Results:
Instruction on how the figures organized:
Each table is one pT pair. Here trigger and associated particle use the same pT bins.
(TPC is |η| < 1 )
For FTPC:
The first row: 2<|Δη|<3.2, 2.8<|η|<3.2. Small η, small Δη
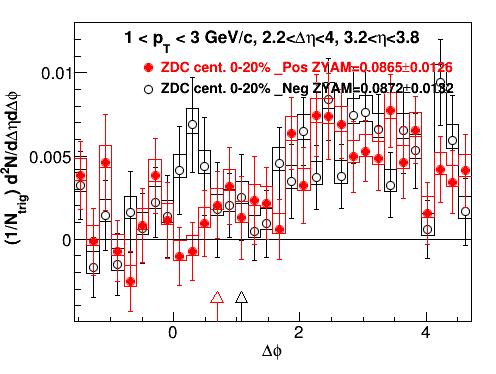
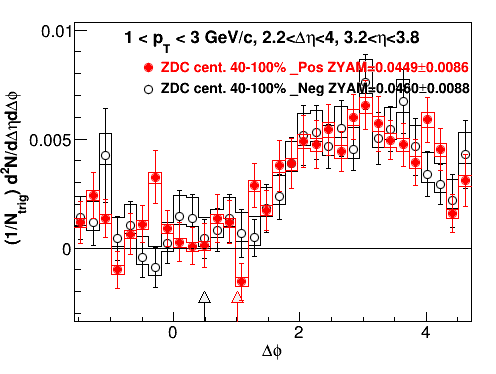
The second row: 2.2<|Δη|<4, 2.8<|η|<3.2 Small η, large Δη
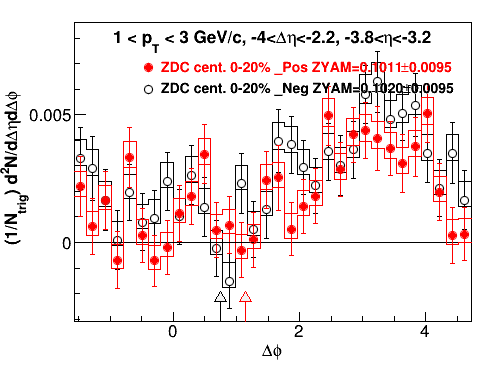
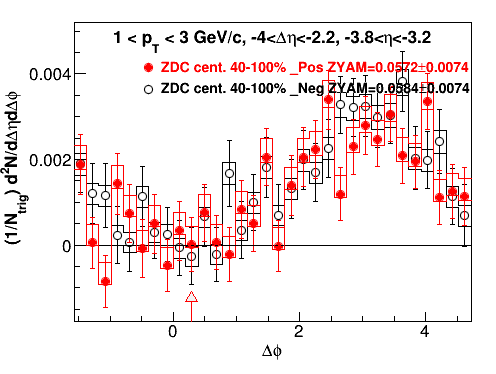
The third row: 2.2<|Δη|<4, 3.2<|η|<3.8 Large η, large Δη
Each row: Au-side 0-20%, d-side 0-20%, Au-side 40-100%, d-side 40-100%.
Note: The dihadron correlations magnitude below needs scaled by 1/2.
1. 0.15 < pT< 0.3 GeV/c
 |
 |
 |
 |
 |
 |
 |
 |
| too large fluctuation for 3.2<|η|<3.8 |
2. 0.15 < pT< 0.5 GeV/c
 |
 |
 |
 |
 |
 |
 |
 |
 |
 |
 |
 |
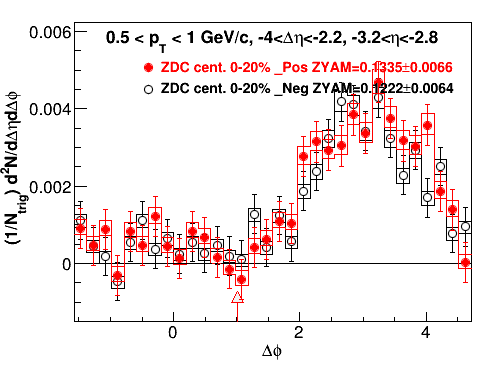
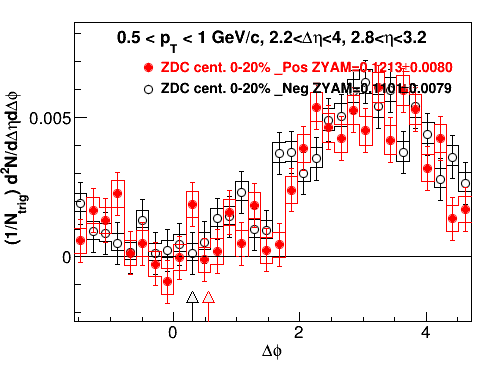
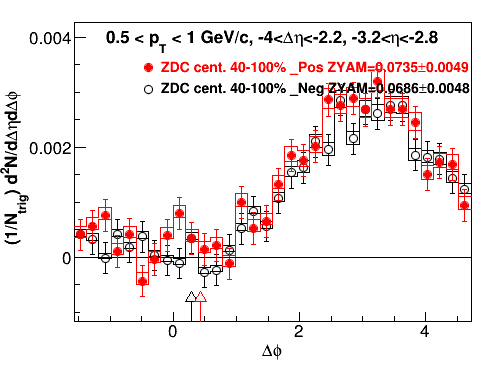
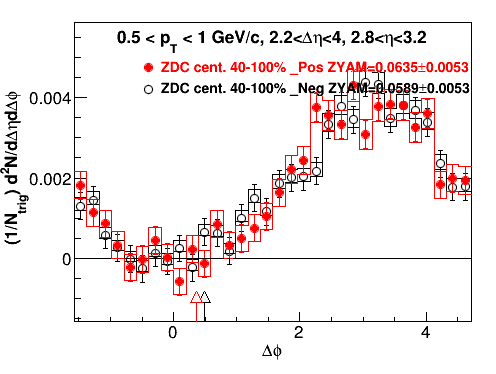
3. 0.5 < pT< 1 GeV/c
 |
 |
 |
 |
 |
 |
 |
 |
 |
 |
 |
 |
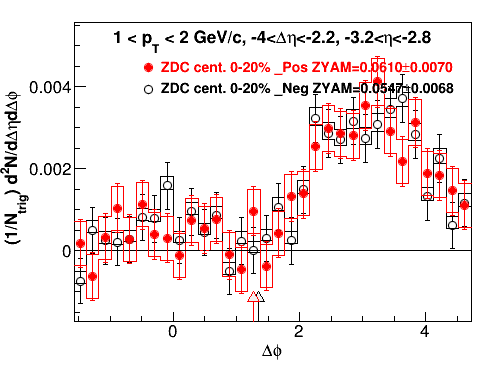
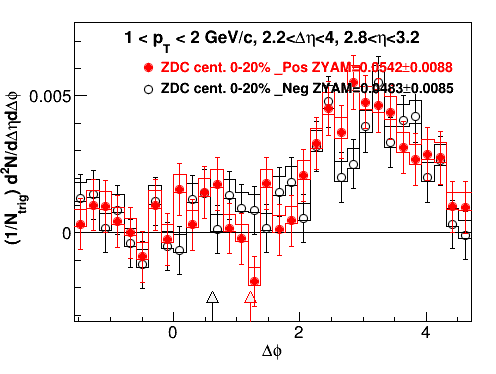
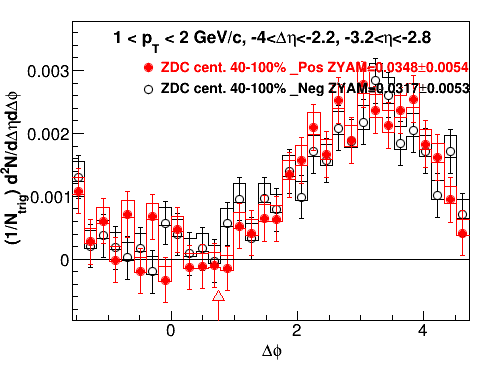
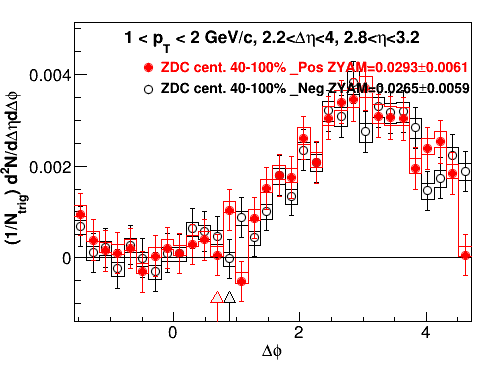
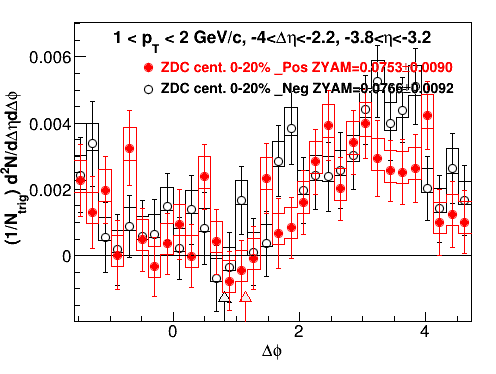
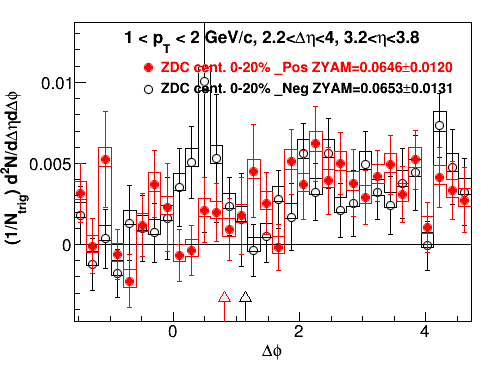
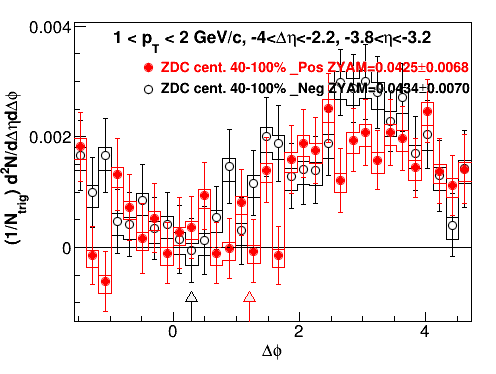
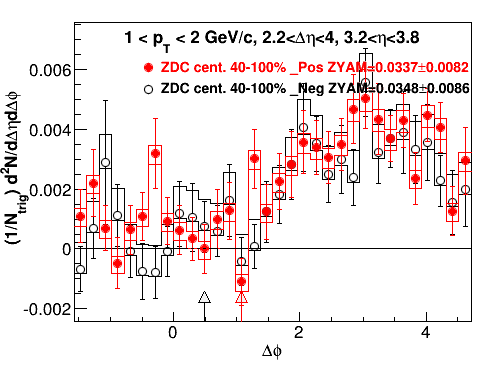
4. 1 < pT< 2 GeV/c
 |
 |
 |
 |
 |
 |
 |
 |
 |
 |
 |
 |
6. 1 < pT< 3 GeV/c
 |
 |
 |
 |
 |
 |
 |
 |
 |
 |
 |
 |
Conclusion:
1. Near-side: From small η to large η, the FTPC resoluation goes worse. The near-side peak structure becomes blurred for Au-side 0-20%. There is even 'false' peak structure shown up in 1-2 or 1-3 GeV/c d-side 0-20% in 3.2<|η|<3.8, which is not seen in 2.8<|η|<3.2 when there is better resolution.
2. Away-side: The same for different η.
However, when primary tracks instead of global tracks used for FTPC, it is another story. See drupal.star.bnl.gov/STAR/blog/yili/dau-ridge-charge-identification-ftpc-eta-dependence
For result with primary tracks, the positive and negative away-side associate yield is different and they change according to η. When η increases, the positive (red points) relatively increases repected to negative associated yield.
-- I don't understand why.
- yili's blog
- Login or register to post comments