- yuxip's home page
- Posts
- 2015
- 2014
- December (2)
- November (1)
- October (2)
- September (6)
- August (2)
- July (1)
- June (3)
- May (4)
- April (1)
- March (2)
- 2013
- December (1)
- November (1)
- October (3)
- September (3)
- August (2)
- July (1)
- June (2)
- May (1)
- April (3)
- March (1)
- February (1)
- January (1)
- 2012
- 2011
- My blog
- Post new blog entry
- All blogs
08/04/2013 --FMS simulation and data comparison
Here I am trying to resolve the issue of large deviations of reconstructed pi0 mass at high pT as seen in the previous blog. Basically the goal is to estimate
how much of these shifts comes from two photon separation measurements and how much comes from energy scale systematics. I'll start with a comparsion
between data and pi0 or eta only simulations to show some basic performance of the reconstruction and some complication factors there might be to go from
single particle to full pythia simulations.
Some of the important settings in the simulation include the parameterization of Pb-glass attenuations and surface reflectivity, which are shown in figure 1.
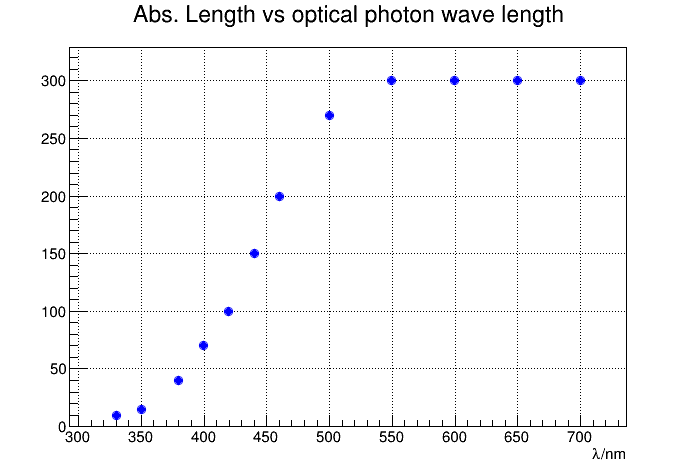
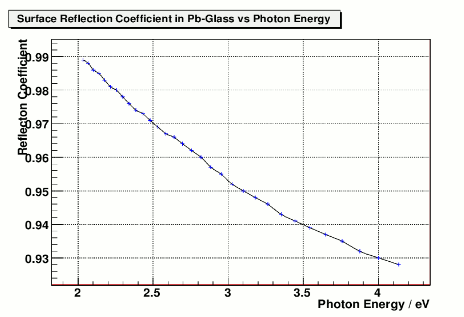
Figure 1. Pb-glass attentuation and surface reflectivities used in GSTAR simulations
Both of these parameters were taken from ref.6 of the following article,
http://www.star.bnl.gov/protected/spin/yuxip/fms_resolution/EMshowerProfile.pdf
according to the timestamp of that reference the measurement was done at around 2001. The surface reflectivies was increase by 7% compared to
the orginal numbers due to the lack of total internal reflections on the aluminized mylar in Geant3 and this effect has been extensively studied by Len
and Steve. These parameters has been used in Len's thesis work on 2006 FPD data and produced pretty good match between data and simulation.
But the condition of the Pb-glass must have been degraded due to radiation damage in going from 2006 to 2011. In the summer of 2013 Stephen and
Chirs measured the transmittance of a few clear and radiation-damaged cells, the results can be found here.
I took the data from Chris and estimated the range over which the attentuations could vary between a clear glass and a dark one. Basically Chris
normailzed the transmittance so that the average transmittance for lambda > 900nm is 1. I re-plotted the results for a dark small and large cell in figure 2.
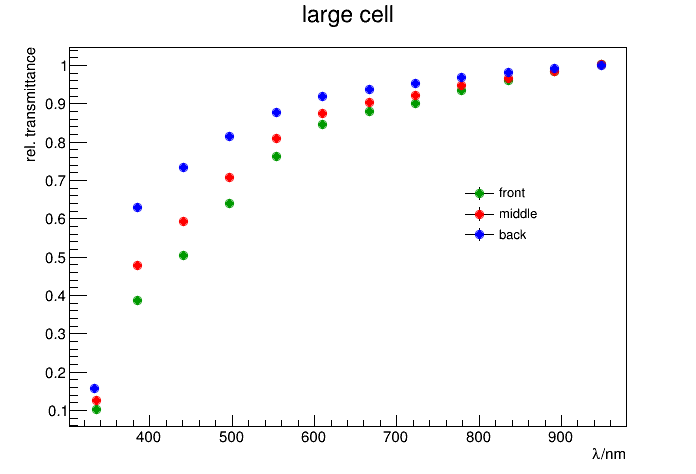
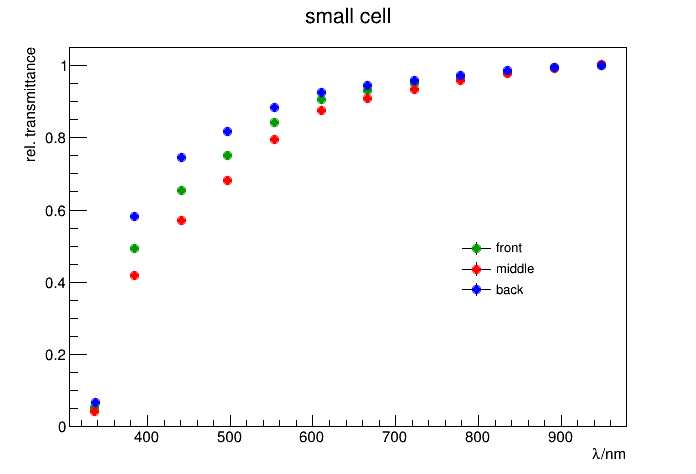
Figure 2. light transmittance on a dark large cell (left) and a dark small cell (right)
I have the same plot for clear cells as well. Then I make the assumption that the attentuations of a clear glass at lambda above 900nm is
unchaged (=300cm), and by using the formula exp(-d/L) / exp(-d/300) = T_rel I was able to convert the relative light transmittance to attentuation.
Here d is the width of the cell (since the tranmittance measurement was done by shooting the light through the transverse dimension of a glass).
T_rel is the relative transmittance (capped at 1). An example of this conversion can be seen on figure 3.
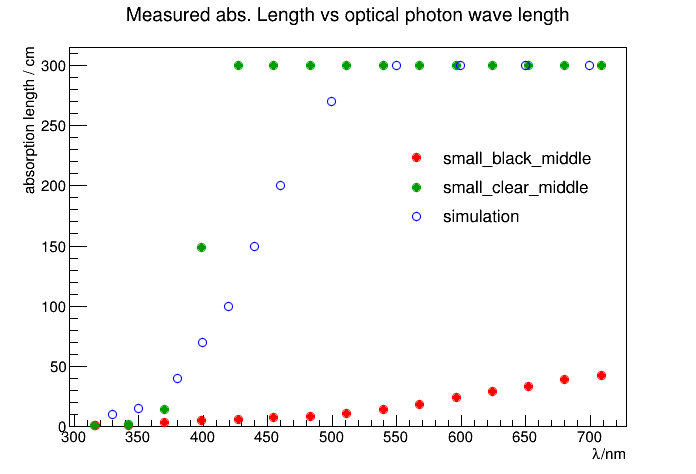
Figure 3. effective attenuation of clear and dark small cells, compared to simulation
If there is nothing substantially wrong in my estimate then we are probably looking at a very non-uniform group of cells taking data together as of run13.
This situation is probably a litter better for run11. So if I use the standard attentuation curve for all of the cells in simulation I will not expect it to reproduce
the width of the pi0 signals. At best one can hope that the centroid the mass peak could match if calibration procedure is implemented in the same manner
between data and simulation.
Nest I am going to show some comparisons with single pi0, or single eta, using the standard attentuation and reflectivity curve as shown in figure 1. The
single pi0 or eta was generated with a flat energy distribution from 40 to 120 GeV. I also have another same of single pi0 with energy from 20 to 150 GeV,
to push the upper limit to higher energy when comparing with data (mostly at 60-80 GeV and 80 to 90 GeV)
The calibration (conversion from number of photo-electrons to energy) for these samples was done in the same way as data. Namely small cells are
calibrated with 40 GeV pions and large cells with 25 GeV pions. Notice that these are oberved energies so by putting the mass of 40 GeV pions at nominal
value one actually folds in the bin migration effect. But for asymmetries measurement it's usually not necessary to unfold the measured energy scales.
The calibration constant in simulation was actually determined with full pythia + GSTAR simulations by putting the pion mass at nominal value at 25 GeV for
large cells and 40 GeV for small cells. Then the same calibration was used for single pi0 and eta as well, since single particle simulations have flat energy
distribution this could potentially underestimate the energies of reconstructed pi0 or eta.
Figure 4 shows the reconstructed energy and mass of eta meson vs generated in simulation.
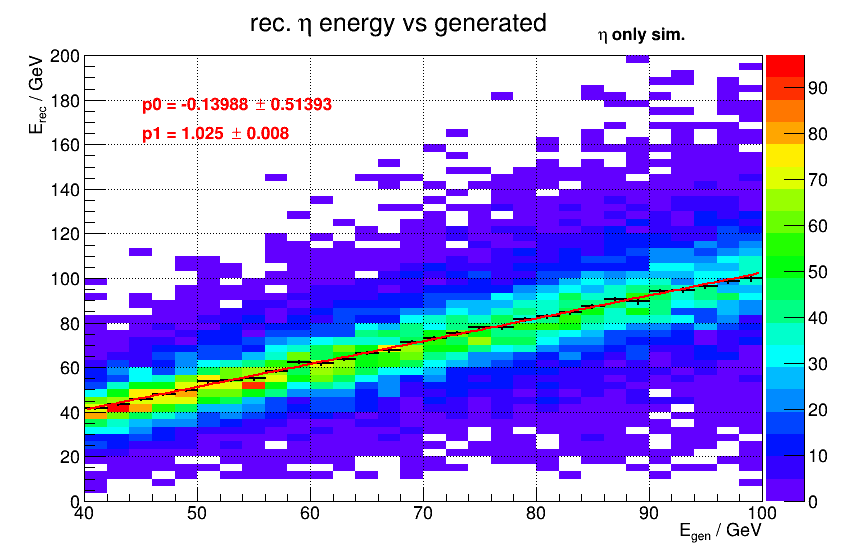
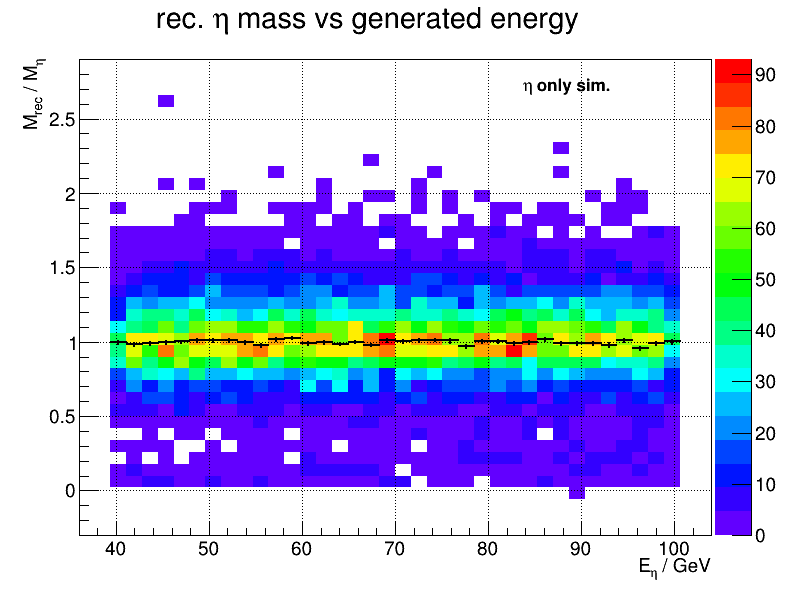
Figure 4 a). reconstructed eta energy vs generated Figure 4 b). reconstructed eta mass / nominal mass vs generated energy
So the limited attenuations we put in the simulation only generated ~2% overestimate of the energy scale at high energies, and almost no effect on eta mass.
Figure 5 shows the same plot for single pi0s.
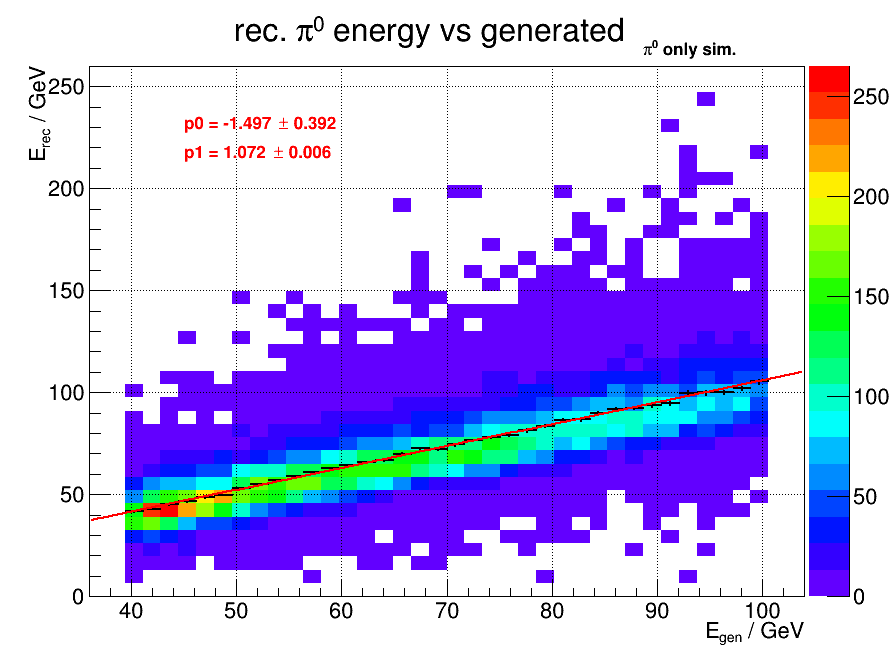
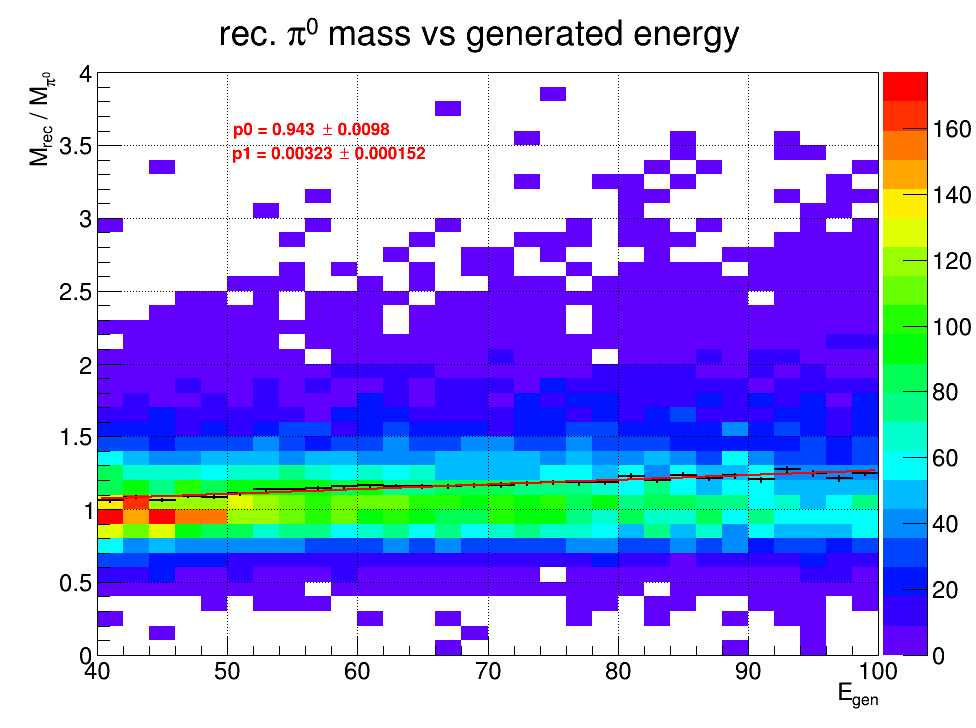
Figure 5 a). reconstructed pi0 energy vs generated Figure 4 b). reconstructed pi0 mass / nominal mass vs generated energy
For pions the reconstructed energy shows a slightly greater overestimate than eta, which is likely due to some reconstruction effect itself. But the mass
of pions have shifted by a lot --it's accurate at 20 GeV but becomes 20% higher at 80 GeV. Figure 6 shows a group of comparisons on the reconstructed
mass between pi0 simulation and data, at low energy and high energy, high pT.
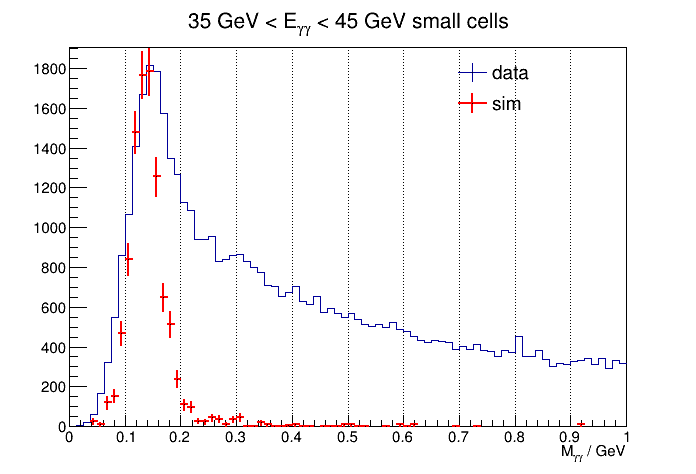
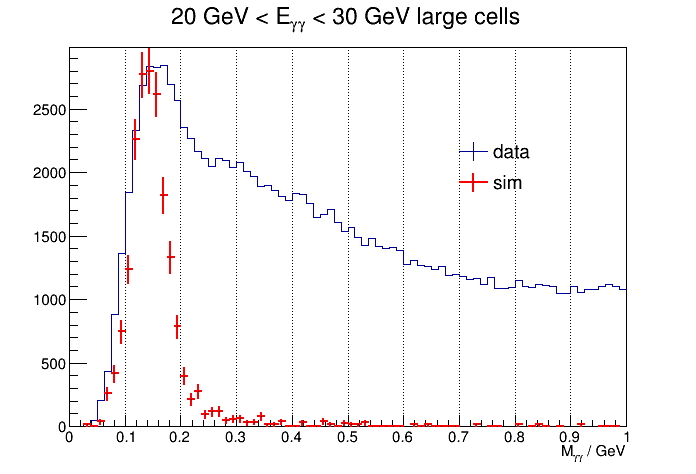
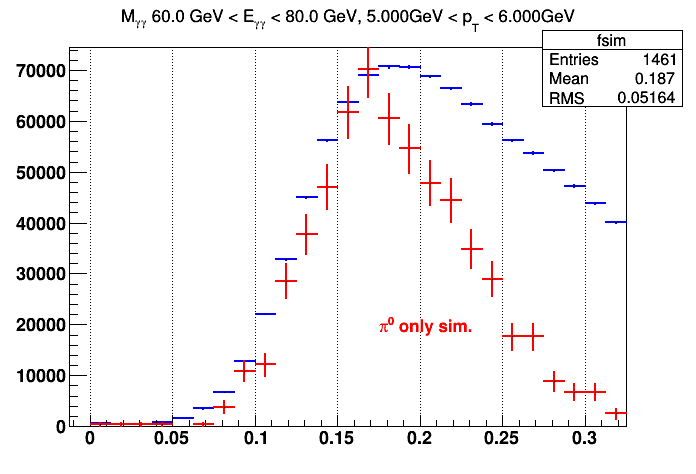
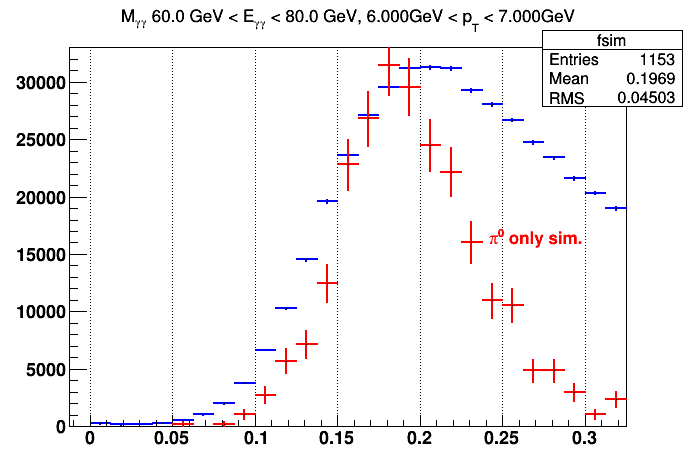
In summary the limited Pb glass attenuations in simulation only produced a little energy dependence and when compared to data (which we believe we've
got the energy scale correct) the location of (overestimated) pi0 mass agrees resonably well. Next I will try to quantify the remaining differences and
uncertainties of the energy scale.
- yuxip's blog
- Login or register to post comments
